


Introduction
The prevalence of diabetes for all age-groups worldwide was 2⋅8 % in 2000 and is estimated to be 4⋅4 % in 2030. The total number of people with diabetes was projected to rise from 171 million in 2000 to 366 million in 2030(Reference Wing1). The findings from Basic Health Research (RISKESDAS 2018) showed that the prevalence of type 2 diabetes mellitus (T2DM) in Indonesia was 10⋅9 %, whereas the prevalence of pre-diabetes was almost threefold, 30⋅8 %(Reference Kemenkes2). Indonesia is predicted to have 21⋅3 millions of diabetic people in 2030. Epidemiologically, Indonesia has reached the epidemic of type 2 diabetes(3).
At present, around half of diabetic people stay undiagnosed and only two-third of the diagnosed are under either pharmacological or non-pharmacological treatments. On top of that, only one-third of the treated ones are in good metabolic control(3). Further risks of the disease are not only creating burden but also micro and macrovascular damage of vital organs that good metabolic control should be attained. HbA1c has been used as an indicator of glycaemic control and is significantly associated with better quality of life with lower family burden(Reference Hoey, Aanstoot and Chiarelli4,5) . Lifestyle changes, particularly in dietary patterns, have contributed a great deal to the incidence and risks of T2DM. Shifting the forms of food from indigenous staple grain to modern processing involving refinery is reflected in nutritional outcomes and metabolic disorder. Decreased intakes of vegetables and fruits replaced by preprocessed food, added sugar and those of animal origin lead towards a rapid increase of adult-onset diabetes(Reference Wang, Fang and Gao6). Dietary changes, in particular refined carbohydrates, have formed the basis of staple food of most individuals with T2DM in Indonesia. Due to high refined carbohydrates, there is a shortage of vegetable intake while the Indonesian dietary guideline recommends 3–5 servings of vegetable daily for healthy people. Despite availability of various green leafy vegetables as the richness of biodiversity in Indonesia, barriers of vegetable intake exist as evidenced by the statistic(Reference Kemenkes2). Referring to 2018 Basic Health Research, the prevalence of diabetes over 15 years of age in urban area is 1⋅9 and 95⋅5 % of the Indonesian population do not meet recommended adequate intake of vegetables(Reference Kemenkes2).
There are interventions targeted to T2DM adults that include the increase of fruit and vegetable intakes(Reference Villegas, Shu and Gao7–Reference Alexander, McClure and Calvi10). Non-starchy, green leafy vegetables with its low glycaemic index and rich content of fibre, phytochemicals and other components that are protective against diabetes, may contribute to better glycaemic control among type 2 diabetic adults. Viscous soluble fibre has also been demonstrated to diminish post-prandial blood glucose and insulin responses and contribute to the low glycaemic index of foods(Reference Liu, Serdula and Janket11,Reference Liu and Chou12) . The mechanisms involve diffusion barriers due to increased viscosity of the intestinal contents, hindering both amylase action in the lumen and the absorption of monosaccharides(Reference Bender and Asp13).
Processing and cooking of vegetables may compromise its nutritional benefit. Cooking, such as boiling, causes overall flavones losses(Reference Makris and Rossiter14) while microwaving pressure-cooking, griddling, baking and frying can profoundly affect both the texture and the nutritional value of vegetables(Reference Jiménez-Monreal, García-Diz and Martínez-Tomé15–Reference Rickman, Barrett and Bruhn17). A study from The Nurses’ Health Study showed that an increase of one serving per day in green leafy vegetable consumption was associated with modestly lowering hazard of diabetes whereas the same change in fruit juice intake was associated with an increased hazard of diabetes(Reference Bazzano, Li and Joshipura18). Given the benefit of raw vegetables, we aimed to assess the effect of improved vegetables intakes particularly raw vegetables on glycaemic control of adults with T2DM.
Materials and methods
Study setting and population
The study was conducted in 2013 among subjects with T2DM who were working at Telkom company (telephone communication company) and their family members. They represented the urban population with T2DM of the middle socio-economic class in Jakarta, Indonesia. The inclusion criteria included males and females aged 18–55 years old, with fasting blood glucose ≥126 mg/dl and HbA1c ≥ 8 %. The onset of diabetes was restricted to after 15 year of age to confirm the T2DM.
Sample size
The sample size was calculated based on the expected mean difference of 0⋅8 % in HbA1C between intervention and control with sd 1⋅1 %. With 95 % confidence interval (CI), 90 % power and attrition of 10 %, the sample size was 43 subjects in each treatment group(Reference Davis, Tomuta and Schechter19).
Since the study was a non-blinded trial, allocation to treatment group was done using cluster randomisation of offices. Six offices were randomised into either the intervention or control group.
Study design and intervention
The study is a non-blinded, clustered randomised intervention trial. Subjects with type 2 diabetes were screened for the HbA1C and were invited to join the study if HbA1C > 8 % (Fig. 1). The management of the company who was not directly involved in the study randomly assigned the offices into either intervention (three offices) or control group (three offices). Subjects in the intervention group received intensive coaching to improve vegetable intake using the Empowerment Model according to behaviour transformation of T2DM adults to improve the glycaemic control. The training was designed as learner-centred through practice, discussion and interactive role model simulation to experience real values of coaching method, providing opportunities of learning by doing and learning by experience. Details of the model will be reported elsewhere. They were encouraged to achieve more vegetable intake (≥4 servings day) while the control group received standard message to follow conventional dietary pattern of T2DM management according to the guidelines of the Indonesian Society of Endocrinology(3). Participants from the intervention group were supported with a manual for client, simplified food composition table (FCT) on macronutrient contents and a booklet of variations of raw vegetable preparations. Similarly, subjects from control group received a weekly 15–30 min standard health counselling session for diabetes patients while those from intervention group received empowerment model counselling during the course of the study. Counselling was given by health providers on a weekly basis for 12 weeks. All respondents from both groups were required to check daily fasting and post-prandial blood glucose to record the results in the record book. They were also required to record their daily intake in the self-reported food record form.

Fig. 1. Participant flowchart.
Data collection
Standard, structured questionnaires were administered by trained enumerators. Anthropometry, biochemical and dietary assessments were also conducted at baseline and at the end of 12 weeks intervention.
Biochemical assessment
For biochemical assessment, 5 ml of non-fasting blood samples was taken from each subject by experienced phlebotomist in the morning. The blood samples were analysed for the fasting and post-prandial blood glucose, HbA1C, total cholesterol, triacylglycerols, low density lipoprotein (LDL), high density lipoprotein (HDL), Apolipoprotein B and haemoglobin. HbA1C was measured with high-performance liquid chromatography ion exchange, using D-10 tool. Total cholesterol concentration was measured with enzymatic colorimetry using commercial reagents. LDL and HDL concentrations in serum were measured with homogeneous enzymatic colorimetry using commercial reagents. Triacylglycerols concentration was measured with GPO-PAP (glycerol peroxidase phosphate acid) and Apo B plasma was measured using immunoturbidimetry.
Anthropometry assessment
Anthropometric measurements were carried out by trained persons. Body weight was measured using an electronic weighing scale (SECA 874, Hamburg, Germany) to the nearest 0⋅1 kg and height was measured using a measuring tape (Microtoise SECA 206, Hamburg, Germany) to the nearest 0⋅1 cm. Waist circumference was measured using a SECA measuring tape to the nearest 0⋅1 cm.
Dietary assessment
Semi-quantitative food-frequency questionnaire (SQ-FFQ) and 24-h dietary recall were used. SQ-FFQ was used to assess the usual intake of vegetables. The SQ-FFQ, which had been validated with 3-d weighed food records (2 weekdays and 1 weekend-day), consisted of seventeen starchy carbohydrate food items, ten composite vegetable food items, twenty-six raw vegetables and twenty-eight cooked vegetables. The term ‘raw vegetables’ in the present study included all kinds of commonly consumed raw vegetables in Indonesia, such as lettuces (water crest, romaine, butterhead, iceberg, lolorosa), all variants of tomatoes, cucumber, carrot, eggplant, all kinds of sprouts, poh-pohan (Pilea melastomoides), smelly beans, all variants of capsicums, garlic, onions, shallots, chilli peppers, long beans, basil, all variants of cabbages and leunca nightshade berries (Solanum nigrum).
We developed a template of simplified FCT as a tool for subjects of the intervention group in selecting food items based on their calorie, macronutrients, fibre and antioxidant content. Nutrient values of the FCT were mainly obtained from Indonesian FCT complemented by Singaporean and Malaysian FCTs(Reference Indonesia20–Reference Currie, Peters and Tynan24). The FCT consisted of related food items commonly consumed. Energy under- and over-reporting was identified based on the ratio of reported energy intake (EIrep) and predicted total energy expenditure (pTEE) using McCrory method; the ratio of <0⋅4 and >1⋅6 were excluded as they were considered under- and over-reporting of energy(Reference McCrory, McCrory and Hajduk25).
Ethical consideration
This study was conducted according to the guidelines laid down in the Declaration of Helsinki and all procedures involving human subjects/patients were approved by The Committee of Medical Research Ethics of the Faculty of Medicine University of Indonesia prior to the commencement of the study (77/H2.F1/ETIK/2013). Subjects were informed about the purpose of the study and written informed consents were obtained from all subjects prior to the study. Subjects’ participation was voluntary, and they could withdraw their involvement at any time during the study period without any restriction. This trial was registered at ClinicalTrials.gov with the registration number: NCT01828242 (https://clinicaltrials.gov/NCT01828242).
Statistical analysis
Data were processed and analysed using STATA version 15. The Kolmogorov–Smirnov goodness-of-fit test was used to check the normality of each variable. Descriptive characteristics were expressed as means (sd) for normally distributed data and median with upper and lower quartile for the not normally distributed data. Nonparametric analysis using Mann–Whitney was used for the not normally distributed data. For the normally distributed data, unpaired student's t test was used to compare the results between the two groups. Categorical data was presented in frequency (percentage). Dietary data were analysed using Nutrisurvey 2004. The main analysis examined whether differences in the outcome variable (mean difference of HbA1C) between baseline and 12 weeks existed between the control and intervention groups. A regression analysis was conducted using differences in HbA1C between baseline and 12 weeks as the dependent variable in a general linear model. Paired T-test was conducted for the changes of biochemical indicators from baseline to end line during the period of 12 weeks intervention.
Results
Description of the study
A total of 140 subjects were eligible to join the study. Eighty-four subjects completed the baseline assessment and six Telkom office sites in Jakarta were randomised into intervention and control (Fig. 1).
The intervention group consisted of forty-two subjects in Gambir, Prumpung and Percetakan Negara 1 offices and the control group consisted of forty-two subjects in Slipi, Gatot Subroto and Percetakan Negara 2 offices. During the course of the study, three subjects (two from intervention group and one from the control group) discontinued their participation due to work transfers to other cities. The study was conducted for 12 weeks, from March to May 2013. Background characteristics of respondents are described in Table 1. There was no significant difference between the two groups in terms of age, gender, ethnicity, levels of education, levels of income and family history of T2DM.
Table 1. Background characteristics of respondents

a Chi-square test, significance at P < 0⋅05.
Dietary intake
The energy and macronutrient intakes as well as energy distribution are described in Table 2. Vegetable intake between the two groups was comparable at the baseline of the study but after 12 weeks of intervention, there was significantly higher intake of raw vegetables in the intervention group, compared to the control group (P < 0⋅001). After 12 weeks of intervention, energy, carbohydrate and fat intakes were significantly lower in the intervention group, which led to lower percentage energy from carbohydrate and higher percentage energy from protein.
Table 2. Energy, macronutrient and vegetable intakes between the intervention and control groups at baseline and end line of 12 weeks intervention
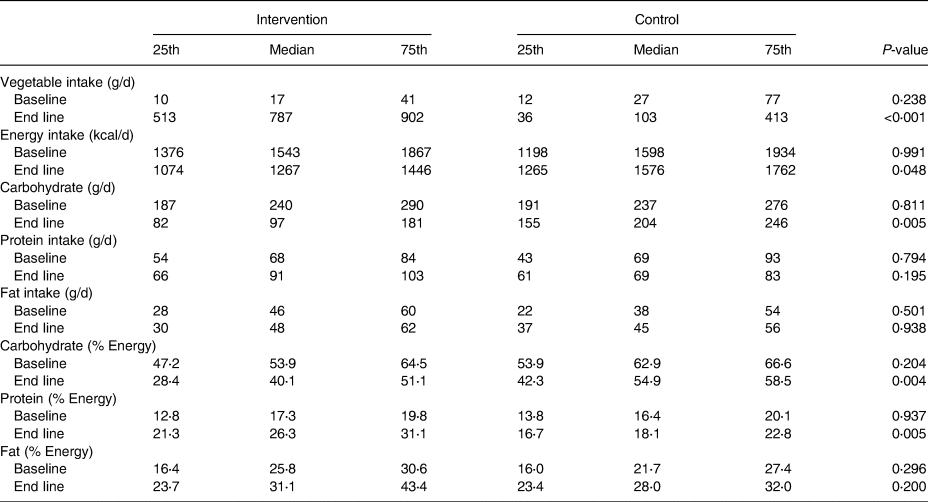
Vegetable intake: N 40 for intervention, N 41 for control at baseline and end line.
Energy and nutrient intakes; energy distribution: N 21 for intervention, N 23 for control at baseline, N 16 for intervention, N 34 for control at end line, Somersd, significance at P < 0⋅05.
Changes in biochemical indicators
The mean HbA1C in the intervention group decreased 3⋅1 % over 12 weeks while it decreased by 2⋅3 % in the control group (P = 0⋅009). Similarly, mean fasting blood glucose, post-prandial blood glucose and total cholesterol reduced significantly in the intervention group compared to the control, respectively (Table 3). The reduction of fasting blood glucose, post-prandial glucose and cholesterol in the intervention group were −76⋅5 ± 62⋅9 mg/dl, −156⋅3 ± 93⋅3 mg/dl and −21 ± 46⋅5 mg/dl while the values in the control group were −50⋅2 ± 43⋅3 mg/dl, −101 ± 78 mg/dl and −1⋅9 ± 36⋅1 mg/dl, respectively. The reduction of triacylglycerols, LDL, HDL and apoprotein B were not significantly different between the two groups.
Table 3. Indicators of glycaemic control and lipid profile between the intervention and control groups at baseline and end line of the 12 weeks intervention

a Geometric mean and sd, independent sample T-test significance at P < 0⋅05.
Effect of intervention on HbA1C at end line
The univariable regression analysis showed the absence of family history of diabetes, insulin use and HbA1C values at baseline of the study and the intervention were significant determinants to the reduction of HbA1C. The adjusted model showed baseline HbA1C significantly contributed to the model for reduction of HbA1C at end line and the effect on intervention in reducing HbA1C at the end line remained significant after the model was adjusted for baseline HbA1C (P = 0⋅03, effect size = −0⋅55, 95 % CI −1⋅2, −0⋅1) (Table 4).
Table 4. Regression analysis on mean difference in HbA1C from baseline to 12 weeks after interventiona
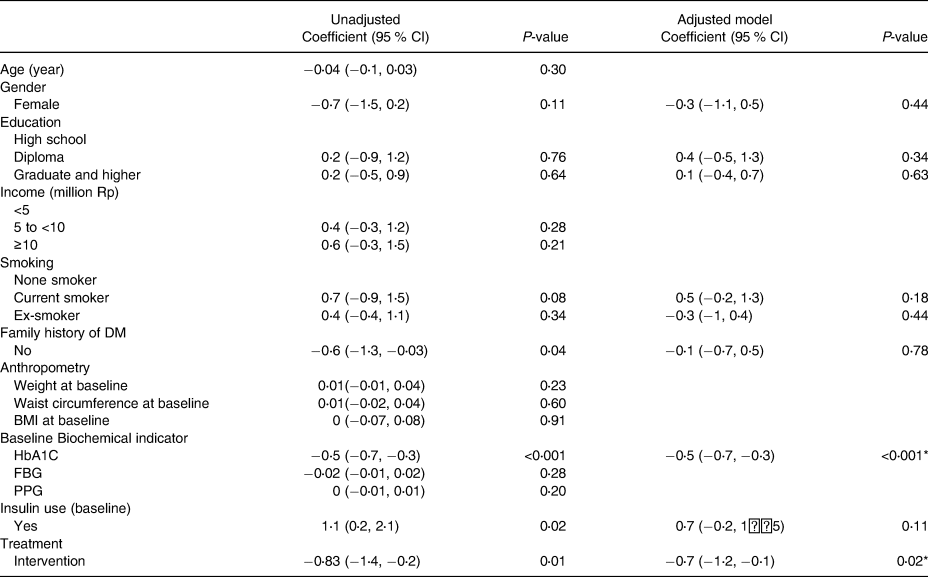
a Adjusted R-square: 0⋅407.
* P < 0⋅001.
Changes in anthropometry indicators
After 12 weeks intervention, body weight and waist circumference were reduced significantly in the intervention group compared to the control group (Supplementary Table S1). The mean body weight was reduced −3⋅1 ± 4⋅7 kg in the intervention group and −1⋅1 ± 4⋅2 kg in the control group, while the mean waist circumference in the intervention group was decreased by 3⋅1 ± 4⋅7 cm compared to 0⋅9 ± 4⋅2 cm of the control group (P = 0⋅044).
Discussion
During the 12-week intervention that emphasised raw vegetable consumption, we found a significant decrease of HbA1C, fasting and post-prandial blood glucose among subjects with T2DM in the intervention group. In addition, there was a significant improvement in lowering total cholesterol, body weight and waist circumference in the intervention group. The respondents in the intervention group achieved the recommended vegetable intake of ≥400 g daily according to the WHO/FAO on diet, nutrition and the prevention of chronic diseases(Reference Nishida, Uauy and Kumanyika26). This finding is not only important for glycaemic control but also had important implication to a food-based dietary guideline for the population as currently in Indonesia 95⋅5 % of the population do not consume the recommended amount of vegetables and fruits(Reference Kemenkes2).
The findings in our study were similar to previous studies of lifestyle changes intervention among T2DM. The study was conducted among 193 Japanese adults with T2DM using structured individual-based lifestyle education and the finding showed a greater reduction (−0⋅5 %, P = 0⋅004) of HbA1C in the intervention group (0⋅7 ± 0⋅1) compared to the control group (−0⋅2 ± 0⋅1)(Reference Adachi, Yamaoka and Watanabe27). Subjects in the intervention group were encouraged to reduce energy intake at dinner and increase vegetable consumption at breakfast and lunch. However, post-prandial glucose, total cholesterol and waist circumference were not measured in the study. Another trial in Japan investigating the effects of vegetable and green vegetable intake on HbA1C and triacylglycerols in T2DM elderly patients showed a significant HbA1C decrease with the increase of total vegetable intake (P = 0⋅016)(Reference Takahashi, Kamada and Yoshimura28). Besides achieving glycaemic control, we reported improvement in anthropometric status of the respondents especially the reduction of waist circumference in the intervention group. In the Japanese study, a significant decrease in waist circumference was also observed along with increased total vegetable intake (P-value for trend = 0⋅026). This finding is particularly important since excess weight, particularly central obesity, is recognised as a major determinant of diabetes risk in all populations, with the magnitude of the association reported as being stronger in Asians than whites(Reference Whincup, Gilg and Papacosta29).
In the present study, we encouraged the respondents to increase their vegetable intakes by individual coaching using an empowerment model. The finding showed that the approach was effective in achieving the glycaemic control but more importantly, it is imperative to make sure that the approach is sustainable among the respondents. An earlier study, X-PERT Diabetes, which was the patient-centred, group-based, self-management of diabetes programme using structured education for diabetes control among T2DM patients also reported encouraging findings(Reference Deakin, Cade and Williams30). By 14 months, the X-PERT group compared with the control group showed significant improvements in the mean HbA1C (−0⋅6 % v. +0⋅1 %, P < 0⋅001). In addition, the study reported that significant improvements were observed in body weight, BMI, waist circumference, total cholesterol, self-empowerment, diabetes knowledge, physical activity levels, food care, fruit and vegetable intake, enjoyment of food and treatment satisfaction. Our study has demonstrated a better improvement in mean HbA1C (−3⋅1 ± 1⋅7) likely due to the emphasis of intervention on various raw vegetable intake with balanced diet. Our finding also showed the percent energy contribution from carbohydrate in the intervention group improved, which reduced from 53 % at baseline to 40 % at end line. A similar finding was not observed in X-PERT study which showed percent energy contribution from carbohydrate were 50⋅6 % at baseline, 54⋅0 % at 4 months and 53⋅5 % at 14 months, respectively. This finding was important since previous study showed that risk of obesity significantly increased when percentage energy from carbohydrate is greater than 49 % especially in people with β-adrenoceptor polymorphism(Reference Martínez, Corbalán and Sánchez-Villegas31). The most important dietary change in our intervention is therefore in improving vegetable intakes to meet the recommended portions of >400 g and in decreasing percentage energy from carbohydrate to less than 45 %.
Another study conducted among Indonesian women showed a significant improvement in their lipid profile such as total cholesterol, LDL, HDL and body weight after receiving 400 g of vegetables for 21 d. The study was conducted among overweight and menopausal women with dyslipidemia and the finding support increased vegetable intake as an effective approach(Reference Sari, Utari and Kamoshita32). In our study, besides indicators of glycaemic control, we found that total cholesterol and Apoprotein B improved significantly in the intervention group but not LDL and HDL. Findings from our study will be useful for management of T2DM through dietary interventions. These findings showed that glycaemic control can be achieved through dietary modification. This evidence will not only reduce the burden of medication but also empower Indonesia as the source of abundant varieties of vegetables through promotive and preventive health campaigns. There is more recent evidence which suggest the benefits of consuming fruits and vegetables and a study conducted among eight European countries showed an inverse association between fruits and vegetables intakes, measured by plasma vitamin C and carotenoids, and low risk of developing type 2 diabetes(Reference Zheng, Sharp and Imamura33). Similarly, a study conducted among Swedish adults reported consumption of 500 g (or more) fruits and vegetables significantly reduced the risk of insulin resistance, measured by homeostasis model assessment of insulin resistance (HOMA-IR) and body fat % among female participants(Reference Fernström, Fernberg and Hurtig-Wennlöf34).
The findings in our study were aligned with effective dietary strategies recommended by WHO that addition of vegetables to the diet reduces overall energy density, increasing the amount of food that can be consumed for a given level of calories. At the same time, adding vegetable would not only reduce calorie intake but also increase satiety and reduce hunger(Reference Tohill and Joint35). This may explain for the significant decrease in HbA1C observed in the intervention which accompanied the reduction in energy and carbohydrate intakes in the intervention group.
The strength of the present study is in the use of intensive coaching to improve vegetable intake using the Empowerment Model to improve the glycaemic control. The intervention showed the positive effect in a relatively shorter period (3 months) as compared to earlier studies (4–14 months). The vegetable intake was estimated so it can represent usual intakes as it has been validated with 3-d weighed food records. The limitation of the study was that it was conducted in the middle-class workers and their family members and therefore could not represent the general population. In addition, by nature of the work, the majority of the staff were males and therefore caution must be taken in the interpretation of the findings. Although the purpose of intervention is to increase intake of raw vegetables, the weight of raw vegetables consumed was not recorded in the study and could not provide the ratio of raw to cooked vegetables. In achieving glycaemic control, both diet and physical activities are fundamental; however, in our study, the physical activities level of respondents were not recorded and cannot be included in the model. Dietary intervention together with physical activities among white-collar workers with type 2 diabetes should be considered.
Further study is needed to investigate the long-term sustainability of the dietary changes and efficacy of the subjects in maintaining good glycaemic control. The studies may include further investigation of the effect of high fibre consumption in T2DM, dietary relapse after more than one-year dietary change, as well as the cost and reward of implementing the model in primary care level, hospital level and private sector.
Conclusion
The study demonstrated that increased vegetable intakes contributed significantly to improving the glycaemic control among adults with type 2 diabetic mellitus. The empowerment model applied in this study provides promising results to be integrated into management of type 2 diabetes.
Supplementary material
The supplementary material for this article can be found at https://doi.org/10.1017/jns.2022.41. (in the table, please add the unit “cm” to Waist circumference and add the unit kg/m2 to BMI)
Acknowledgements
We appreciate the collaboration of Yayasan Kesehatan Telkom for providing teamwork in organising manpower during the trial and giving opportunity for the employees to voluntarily join in the study. The trial was greatly supported by Adelina Haryono, Roza Hasje and Nia Rahmah Housniati who provided the coaching and counselling for the subjects.
T. S. Y., L. W., W. A. and U.F designed research, T. S. Y. and M. K. H. conducted research, R. S, S. B. and M. K. H analysed data, U. F , T. S. Y. and M. K. H wrote the paper, D. M, E. S. B and I. S reviewed the manuscript, T. S. Y. had primary responsibility for the final content. All authors read and approved the final manuscript.
The baseline and end line laboratory expenses were covered by Yayasan Kesehatan Telkom.
We have no conflict of interest with any financial or non-financial aspects in the subject matter or materials discussed in this manuscript.


 Open access