


Cancer is the third leading cause of death in Kenya with a mortality rate estimated at 26 941 annually( 1 ). Malnutrition and cachexia are common in cancer and often contribute to poor health outcomes. Malnutrition is a clinical condition characterised by an imbalance of energy, protein and other nutrients that causes measurable adverse effects on body tissue, function and clinical outcome( Reference Todorovic, Russell and Elia 2 ). Cancer cachexia is a multifactorial syndrome characterised by an ongoing loss of skeletal muscle mass, with or without loss of fat mass that cannot be fully reversed by conventional nutrition support( Reference Fearon, Strasser and Anker 3 ). Cachexia is a manifestation in advanced cancer that affects 50–80 % of cancer patients and accounts for up to 20 % of cancer deaths( Reference Argilés, Busquets and Stemmler 4 , Reference Meriggi 5 ). Early detection and management of malnutrition and cachexia are therefore key. This has necessitated the integration of nutrition care in cancer management for improved clinical outcomes and quality of life( Reference Meyenfieldt 6 ).
The 2013 National Guidelines for Cancer Management in Kenya identifies nutrition care for persons with cancer as an integral part of cancer treatment( 7 ). It singles out the need for early initiation of management plans that incorporate nutritional assessment, diagnosis and intervention. BMI and weight loss are currently the main indicators of malnutrition and cachexia, respectively, in Kenyan public hospitals. However, previous studies have shown the limitations of using BMI as the sole indicator of malnutrition in cancer because it can yield high or normal results in patients with large tumours, ascites or oedema, thereby masking weight loss. Unintentional weight loss is instead recommended( Reference Santarpia, Contaldo and Pasanisi 8 , Reference Laky, Janda and Cleghorn 9 ).
The Malnutrition Universal Screening Tool (MUST) is designed to identify adults who are underweight or obese and at risk of malnutrition, and who may benefit from appropriate intervention( Reference Todorovic, Russell and Elia 2 ). It uses BMI, weight loss and acute disease effect scores in estimating the overall risk of malnutrition. The European Society of Clinical Nutrition and Metabolism (ESPEN) consensus statement provides a minimum set of criteria for the diagnosis of malnutrition that can be applied independently of clinical setting and aetiology( Reference Cederholm, Bosaeus and Barazzoni 10 ). It allows for inclusion of parameters such as fat-free mass where applicable in diagnosing malnutrition. The international consensus on definition and classification of cancer cachexia also provides diagnostic criteria for cachexia that include weight loss or loss of skeletal muscle mass( Reference Fearon, Strasser and Anker 3 ). These assessments enrich understanding of the variability in nutritional status, and have the potential to alter cancer treatment paradigms for improved health outcomes( Reference Prado, Maia and Ormsbee 11 , Reference Prado, Cushen and Orsso 12 ).
There is scarce information on the burden of malnutrition and cachexia among cancer out-patients in Kenya to inform decision making and policy( 1 ). In view of the lack of information and the recent advances in screening and diagnosis of malnutrition and cachexia, this study sought to establish the risk of malnutrition, and factors associated with the occurrence of malnutrition and cachexia, with the ultimate aim of informing nutrition programmes for cancer management in Kenya and beyond.
Research methods
Study design and population
This was a facility-based cross-sectional study among cancer out-patients seeking treatment at Kenyatta National Hospital (KNH) and Texas Cancer Centre (TCC) in Nairobi, Kenya. KNH is the largest public referral hospital in Kenya. The KNH cancer treatment centre receives more than 22 000 cancer patients annually( Reference Muthike 13 ). TCC, on the other hand, is a private facility that receives approximately 1092 cancer patients annually( Reference Nyongesa 14 ).
Inclusion criteria
The study included all out-patients with confirmed stage I–IV cancer disease, aged above 18 years and receiving treatment (radiotherapy, chemotherapy, surgery or hormonal) in the two selected cancer treatment sites.
Sample size estimation and allocation
Prevalence of malnutrition among cancer patients in Kenya remains unknown. Using the Fischer formula( Reference Fisher 15 ), a sample size of 512 participants was calculated factoring in a 10 % non-response rate. The calculated sample size was distributed between the two facilities using the square root allocation method to ensure appropriate representation of the two facilities based on the number of patients received per facility per year. A systematic random sampling method was used in recruiting participants until the desired sample size was achieved. This entailed obtaining the total number of patients expected in each facility from the hospital records and selecting a random starting point. The sampling interval was determined by dividing the total number expected by the desired sample size.
Recruitment and training of research assistants
Research assistants with a medical background were recruited and trained on the protocol, study procedures including the consenting process, study tools and on proper data collection using pretested data collection tools. Training and certification were done to harmonise data collection methods between researchers. This was followed by piloting of the study tools and definitive data collection.
Assessments
Sociodemographic assessments
Data collection was done between June and July 2016. Interviews were carried out and information on socio-economic and demographic characteristics collected using a pretested structured questionnaire. Education level was categorised into four categories: none, primary (1–8 years), secondary (9–14 years), and tertiary (>14 years). Occupation was classified as formal, non-formal, unemployed and retirees.
Anthropometric assessments
Weight and height were measured using calibrated Seca 762 classic mechanical medical weighing scales and UNICEF standard height boards, and findings recorded to the nearest 0·1 kg and 0·1 cm, respectively. In measuring height, participants were asked to stand upright, without head gear and shoes, arms hanging loosely at the sides, feet slightly apart, and with the back of the heels and head against the stadiometer. In measuring weight, the scale was placed on a flat surface and zero checked before every measurement. Participants were weighed without shoes while wearing minimal clothing. Weight and height measurements were used to compute BMI using the formula of BMI = weight (kg)/height (m2). Information on weight history was retrieved from patients’ medical records and used to calculate changes in weight. The current weight was deducted from the previous weight to calculate the amount of weight lost.
Body composition assessments
Total body fat, body water and lean mass percentages were estimated using a commercially available single-frequency four-electrode bioimpedance analyser system (Bodystat 1500). Tetrapolar hand to foot measurements were performed in a supine position lasting for 15 min. The gel-filled electrodes were placed on the dorsal surfaces of the right hand and foot, distal ones being, respectively, proximal to the metacarpal and metatarsal phalangeal joints in accordance with standard tetrapolar electrode placement to minimise gap impedence( Reference Khalil, Mohktar and Ibrahim 16 ). The instrument recorded whole body impedance from the hands to the feet by applying an electric alternating current flux of 0·8 A at an operating frequency of 50 kHz. Fat-free mass index (FFMI) was calculated using the formula FFMI = lean body mass (kg)/height (m2).
Clinical and dietary assessments
Details on participants’ diagnosis (clinical history, types of cancer and clinical stages) and treatment were retrieved from patient files. Information on symptoms such as lack of appetite, feeling nauseated or vomiting was self-reported. Dietary diversity was assessed using individual Food Variety Scores (FVS) that collect data on specific food items consumed( Reference Torheim, Barikmo and Parr 17 ). Participants provided details on the variety of foods consumed 7 d and 24 h prior to the interview. Each food item was given a score of 1 if consumed at least once over 24 h and the 7 d period regardless of the frequency. The FVS were classified as either adequate by creating a cut-off point where the mean of the upper tercile was used to classify the respondent as either having adequate or inadequate dietary diversity.
Risk of malnutrition
Participants were screened using the MUST to identify those at risk of malnutrition. The overall risk was an aggregate of BMI, weight loss and acute disease scores whose cut-off points and interpretation of the data were done in accordance with MUST guidelines( Reference Todorovic, Russell and Elia 2 ). BMI cut-offs of >20, 18·5–20 and <18·5 kg/m2 were scored as 0, 1 and 2, respectively. Unplanned weight loss of <5, 5–10 and >10 % in the past 3–6 months was scored as 0, 1 and 2, respectively. The acute disease effect did not apply to the out-patients and was scored a zero. A score aggregate of 0, 1 and 2 represented low, medium and high risk of malnutrition, respectively.
Diagnosis of malnutrition
Diagnosis of malnutrition was done in accordance with the ESPEN criteria for the diagnosis of malnutrition( Reference Cederholm, Bosaeus and Barazzoni 10 ). The criteria provide for the use of low BMI (<18·5 kg/m2), or combined finding of unintentional weight loss of >5 % over 3 months and at least one of either a reduced BMI of <20 kg/m2 or <22 kg/m2 in subjects younger and older than 70 years, respectively, or a low FFMI of <15 kg/m2 and <17 kg/m2 in females and males, respectively, to diagnose malnutrition. Similar to ESPEN, the local criterion uses low BMI in diagnosing malnutrition; hence further bivariate and multivariate analyses were done using low BMI.
Diagnosis of cachexia
Diagnosis of cachexia was in accordance with the Fearon criteria for the assessment of cachexia( Reference Fearon, Strasser and Anker 3 ). Diagnosis of cancer cachexia was based on BMI < 20 kg/m2 and any degree of weight loss >2 %. The local definition of cachexia is >5 % weight loss/month or >10 % weight loss over 6 months( 7 ).
Information from the MUST will be used to identify patients at risk of malnutrition for targeted intervention. In addition to information on malnutrition based on low BMI, differences in malnutrition based on weight loss and either a reduced age-specific BMI or low sex-specific FFMI diagnostic criteria will help inform clinical practice, the development of guidelines and appropriate care plans for cancer out-patients in Kenya.
Ethical considerations
This study was conducted according to the guidelines laid down in the Declaration of Helsinki and all procedures involving human subjects were approved by the Kenya Medical Research Institute (KEMRI) Scientific and Ethics Review Unit (reference: KEMRI/SERU/CPHR/001/3026) and the KNH Ethics and Research Review Committee (registration certificate: P462/07/2015). Written informed consent was obtained from all study subjects.
Data management and statistical analysis
Quantitative data were double-entered using the Microsoft Access application. Clean and validated data were exported to SPSS version 20.0 statistical software (IBM Corp.) for data analysis. Exploratory data analysis techniques were used at the initial stage of analysis to uncover the data distribution characteristics of continuous variables and identify outliers. Descriptive statistics such as proportions and frequency distributions were used to summarise categorical variables and measures of central tendency and dispersion for continuous variables. Pearson's χ2 test or Fisher's exact test, where applicable, was used to assess the relationship between dependent and independent categorical variables. To test for association between independent continuous variables and dependent categorical variables, the unpaired Student's t test for normally distributed continuous variables and the Mann–Whitney U test for non-normally distributed continuous variables were used for dichotomous dependent categorical variable. For dependent categorical variables with more than two categories, one-way ANOVA for normally distributed continuous variables and Kruskal–Wallis one-way ANOVA for non-normally distributed continuous variables were carried out. The threshold for statistical significance was set at α = 0·05 (two-sided). Post hoc grouping of study participants was done during analysis since this was a comparative study.
Results
A total of 512 participants were recruited (male: 28·1 %; female: 71·9 %). The mean age was 52 (sd 13·8) years. The majority of the participants (71·7 %) were aged 40 years and above, 20·3 % were in formal employment, and 9·8 % had not received formal education. The top three site cancers were cancer of the breast (28·7 %), female genital (22·7 %) and digestive organs (21·7 %). The majority (260; 52 %) of the patients presented with late-stage cancer (stages III and IV) compared with 213 (42·6 %) with early-stage cancer (stages 0, I and II). Table 1 shows the sociodemographic and clinical characteristics of the study participants.
Table 1. Sociodemographic and clinical characteristics of study participants (n 512)
(Numbers and percentages)
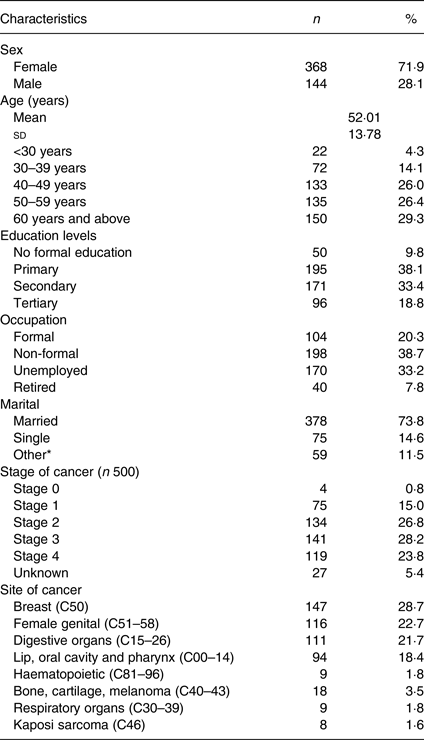
* Divorced, widowed or separated.
Breast (39·7 %) and cervical (25 %) cancer were the leading cancers in females, and prostate (24 %) and oesophagus (24 %) in males. Up to 470 (91·8 %) participants were on treatment, out of whom 202 (43 %) were on one form of treatment (chemotherapy 114 (24·3 %), surgery sixteen (3·4 %), radiotherapy sixty-eight (14·5 %) and hormonal therapy four (0·8 %)), while 183 (38·9 %) and eighty-five (18·1 %) were on two and three combined forms of treatments, respectively. Fatigue and poor appetite were reportedly the most common symptoms experienced in the previous 24 h (38·3 and 32·4 %), and 1 month at 50 and 51 %, respectively. Up to 35 % reported feeling nauseated while 28 % had vomited in the previous 1 month. Only 18·6 % of the participants reported having received nutrition services in the form of nutrition counselling and education or food support during their hospital visits.
Risk of malnutrition
The risk of malnutrition was assessed in 471 participants. Those found at risk of malnutrition were 33·1 % (12·5 % at medium risk and 20·6 % at high risk). The risk of malnutrition was significantly higher in males (OR 2·84 (95 % CI 1·87, 4·31); P < 0·001), patients who smoked cigarettes (OR 2·86 (95 % CI 1·76, 4·66); P < 0·001), those with stage II cancer disease (OR 1·97 (95 % CI 1·12, 3·43); P = 0·017), and those on radiotherapy treatment (OR 2·35 (95 % CI 1·36, 4·06); P = 0·002), as shown in Table 2. Those aged <30 years were less likely to be at risk (OR 0·26 (95 % CI 0·09, 0·67); P < 0·001), and so were patients with breast cancer (OR 0·34 (95 % CI 0·18, 0·63); P = 0·001).
Table 2. Sociodemographic and clinical factors associated with risk of malnutrition
(Numbers and percentages; odds ratios and 95 % confidence intervals)
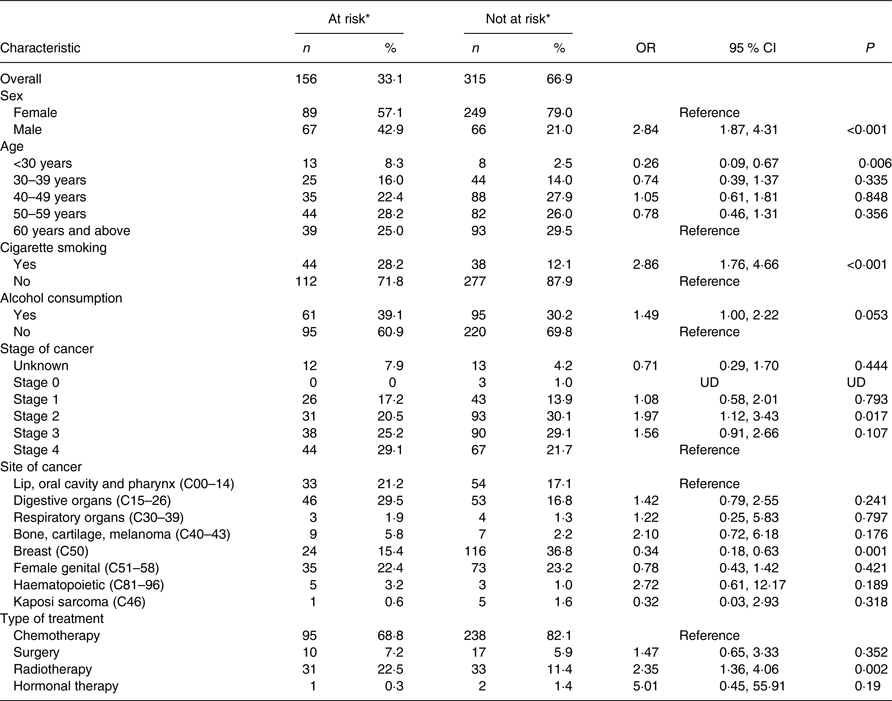
UD, undetermined; MUST, Malnutrition Universal Screening Tool.
* Risk of malnutrition assessed using the MUST ((BMI cut-offs of >20, 18·5–20 and <18·5 kg/m2 representing low, medium and high risk, respectively) + (unplanned weight loss of <5 %, 5–10 % and >10 % in the past 3–6 months representing low, medium and high risk, respectively)).
Prevalence and factors associated with malnutrition
Malnutrition was assessed in 506 participants. Malnutrition based on BMI < 18·5 kg/m2 was 13·4 % (males, 24·8 %; females, 8·9 %). Bivariate analysis revealed males to be 3·39 (95 % CI 2·01, 5·73) times likely to be malnourished compared with females. Likewise, the odds of having malnutrition were higher among cigarette smokers (3·19 (95 % CI 1·81, 5·60); P < 0·001), alcohol consumers (2·01 (95 % CI 1·20, 3·38), P = 0·008), patients with stage II cancer (2·30 (95 % CI 1·02, 5·17); P = 0·044), those with cancer in digestive organs (2·56 (95 % CI 1·22, 5·35); P = 0·012), and those undergoing surgery (3·26 (95 % CI 1·35, 7·86); P = 0·002) and radiotherapy treatment (2·37 (95 % CI 1·19, 4·69); P = 0·002). The opposite was observed in patients less than 30 years of age and those with breast cancer disease, as shown in Table 3.
Table 3. Sociodemographic and clinical factors associated with malnutrition
(Numbers and percentages; odds ratios and 95 % confidence intervals)
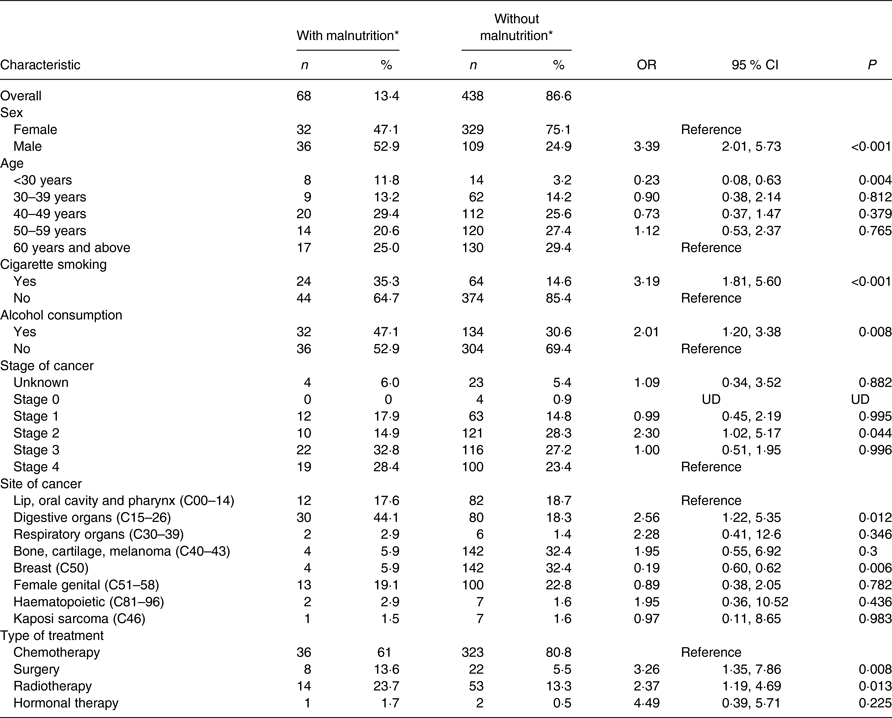
UD, undetermined; ESPEN, European Society of Clinical Nutrition and Metabolism.
* Based on ESPEN diagnostic criterion for malnutrition (BMI < 18·5 kg/m2).
The overall weight loss >5 % over 3 months was 18·2 % and low FFMI 43·1 %. Malnutrition based on the combined findings of unintentional weight loss of >5 % over 3 months together with age-specific reduced BMI was 8·6 %, and with sex-specific low FFMI was 11·5 %.
The mean FVS was 14·4 (sd 5·6). BMI was significantly associated with the previous 24 h and 7 d FVS at P < 0·001 and P < 0·003, respectively. A majority (97 %) of participants with low BMI reported inadequate dietary diversity.
Prevalence and factors associated with cachexia
The prevalence of cachexia based on the Fearon criteria was 14·1 %. Being male, cigarette smoking, alcohol consumption and radiotherapy treatment were significantly associated with cachexia, as shown in Table 4. Males were 3·99 (95 % CI 2·39–6·67; P < 0·001) times more likely to have cachexia compared with females. The odds were higher among cigarette smokers (OR 3·95 (95 % CI 2·29, 6·82); P < 0·001), alcohol consumers (OR 1·91 (95 % CI 1·15, 3·17); P = 0·012) and patients on radiotherapy treatment (OR 2·63 (95 % CI 1·39, 4·97); P = 0·003). Patients with breast cancer were 0·19 (95 % CI 0·07, 0·51, P = 0·001) times more likely to have cachexia compared with those with lip, oral cavity and pharynx cancer. Unlike malnutrition, patients <30 years of age were 6·52 (95 % CI 2·45, 17·36; P < 0·001) times more likely to have cachexia.
Table 4. Sociodemographic and clinical factors associated with cachexia
(Numbers and percentages; odds ratios and 95 % confidence intervals)
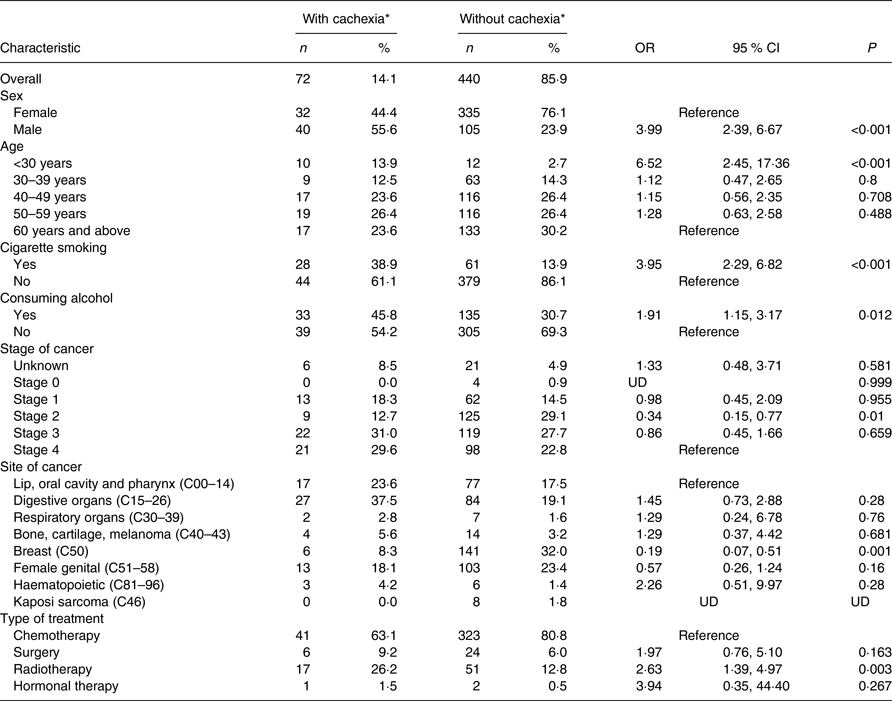
UD, undetermined.
* Diagnosis based on Fearon criteria for assessment of cachexia (BMI < 20 kg/m2 and any degree of weight loss >2 %).
Prevalence of cachexia based on the local definition of cachexia (>10 % weight loss over 6 months) was 8·5 %.
Predictors of risk of malnutrition, malnutrition and cachexia
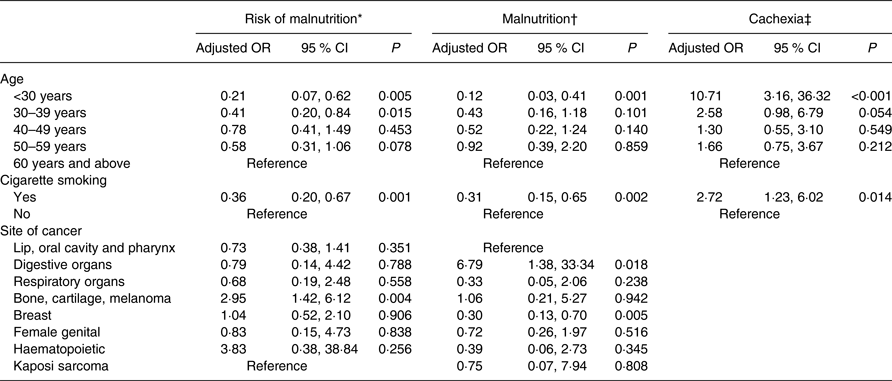
Binary logistic regression using the backward conditional method was performed to examine the effect of independent predictors on the risk of malnutrition, malnutrition and cachexia. Age, cigarette smoking and site of cancer were considered for multivariate analysis. The risk of malnutrition was significantly associated with age <30 years (adjusted OR (AOR) 0·21 (95 % CI 0·07, 0·62); P = 0·005), the 30–39 years age group (AOR 0·41 (95 % CI 0·20, 0·84); P = 0·015), cigarette smoking (AOR 0·36 (95 % CI 0·20, 0·67); P = 0·001) and bone, cartilage and melanoma cancer (AOR 2·95 (95 % CI 1·42, 6·12); P = 0·004). Malnutrition was significantly associated with age <30 years (AOR 0·12 (95 % CI 0·03, 0·413); P = 0·001), cigarette smoking (AOR 0·31 (95 % CI 0·15, 0·65); P = 0·002), digestive organ cancer (AOR 6·79 (95 % CI 1·38, 33·34); P = 0·018) and breast cancer (AOR 0·30 (95 % CI 0·13, 0·70); P = 0·005). Cachexia was significantly associated with age <30 years (AOR 10·71 (95 % CI 3·16, 36·32); P < 0·001) and cigarette smoking (AOR 2·72 (95 % CI 1·23, 6·02); P = 0·014). Table 5 shows age, cigarette smoking and site of cancer as predictors of risk and presence of malnutrition, and only age and cigarette smoking for cachexia.
Table 5. Predictors of risk of malnutrition, malnutrition and cachexia
(Adjusted odds ratios and 95 % confidence intervals)
MUST, Malnutrition Universal Screening Tool; ESPEN, European Society of Clinical Nutrition and Metabolism.
* Assessed using the MUST.
† Based on ESPEN diagnostic criterion of BMI < 18·5 kg/m2.
‡ Based on Fearon criteria of BMI < 20 kg/m2 and any degree of weight loss >2 %.
Discussion
The present study sought to establish the prevalence and factors associated with malnutrition and cachexia among cancer out-patients in Nairobi, Kenya. A third of the patients were found to be at risk of malnutrition, while 13·4 and 14·1 % had malnutrition and cachexia, respectively. Our findings confirm previous results that show malnutrition and cachexia as common nutritional challenges among cancer patients, and that negatively make an impact on the response to cancer treatment, quality of life and overall prognosis( Reference Irungu, Oburra and Ochola 18 – Reference Riccardi and Allen 21 ). Malnutrition and cachexia are poor prognostic factors and should be prevented or detected and managed early enough( Reference Irungu, Oburra and Ochola 18 , Reference Davies 22 ). Those found at risk of malnutrition should therefore be closely monitored to avert progression to frank malnutrition. Mechanisms should also be put in place to identify patients at risk of cachexia for the initiation of preventive interventions( Reference Fearon, Strasser and Anker 3 ).
The leading cancers were breast and cervical cancer in females and prostate and oesophageal cancer in males. Our findings agree with the Global Burden of Disease 2016 report that showed prostate and breast cancer as the leading types of cancer in men and women, respectively( Reference Fitzmaurice, Allen and Barber 23 ). Up to 24 % of males and close to 10 % of females presented with oesophageal cancer that has been found to contribute to some of the highest incidences of malnutrition( Reference Riccardi and Allen 21 ). This might partly explain the significant association observed between malnutrition and cancer of digestive organs in the present study.
Up to 28·2 % presented with stage III cancer disease. However, the odds of being at risk and having malnutrition were higher among patients with stage II cancer disease. Previous studies have shown that many cancer patients in Africa are diagnosed with advanced cancer and easily become malnourished( Reference De Waele, Mattens and Honore 24 , Reference Tesfamariam, Gebremichael and Mufunda 25 ). In light of the present findings on increased odds of malnutrition in early cancer and the fact that 81 % of the patients do not receive nutrition services, there is need for enhanced early screening that can be achieved by integrating nutrition services across the four levels of health care in Kenya.
Many factors can modify nutritional status in cancer patients including nausea, vomiting, decreased energy intake or oncologic treatments resulting in malnutrition( Reference Mercadante 26 , Reference Bosaeus 27 ). More than 50 % of the patients reported having poor appetite and feeling fatigued, while 35 % felt nauseated and 28 % reported vomiting. Inadequate dietary diversity was associated with low BMI. Previous studies have pointed out alterations that occur in components of energy expenditure that can contribute to malnutrition if not compensated for by increased energy intake( Reference Bosaeus 27 ). Thus, a holistic approach is required to address the physical, social, psychological and nutritional needs of cancer out-patients to reduce the consequences of cancer-associated nutritional decline( Reference Bosaeus 27 , Reference Prasad 28 ).
BMI is the most common and easily available anthropometric assessment method despite its limitation. The local diagnostic criterion is BMI < 18 kg/m2, which is similar to the ESPEN criteria. The low BMI criterion was able to identify a higher proportion of patients with malnutrition compared with the combined finding of unintentional weight loss and either a reduced age-specific BMI or a low sex-specific FFMI criteria also recommended by ESPEN. However, the observed low FFMI of 43·1 % highlights the need to incorporate body composition assessments in nutritional assessments. Body composition is not routinely measured in Kenyan public hospitals despite the morbidity risk associated with increased loss of muscle mass. Given its relevance, assessment of body composition should be supported by building the necessary capacity and infrastructure( Reference Andreoli, De Lorenzo and Cadeddu 29 – Reference Barrera and Demark-Wahnefried 36 ). On the other hand, the Fearon criteria for diagnosis of cachexia identified 14·1 % cachexia compared with 8·5 % using the local criteria. There is need therefore to evaluate the current local diagnostic criteria for cachexia while being cognizant of the local clinical practice and health system structures.
In this study, malnutrition and cachexia were significantly associated with treatment type and site of cancer. A previous study in Kenya among cervical cancer patients undergoing radiotherapy projected a 2-year survival of <20 %( Reference Maranga, Hampson and Oliver 37 ). Cancer management therefore requires a multimodal approach, and the Kenyan Government recommends establishment of ‘multidisciplinary tumour boards’ to consider all aspects of the patients’ conditions( 7 ). A multidisciplinary team is required to consider the implications beyond patients’ dietary needs to patients’ nutritional and functional state throughout the prolonged course of treatment, and is best started earlier rather than later( Reference McCreery and Costello 20 , Reference Aapro, Arends and Bozzetti 35 , Reference Kim and Sung 38 ). The role of nutrition as a therapy that complements basic treatment and improves treatment outcomes needs to be appreciated( Reference Davies 22 , Reference Kim and Sung 38 , Reference Celaya Perez and Valero Zanuy 39 ). Inclusion of nutritionists in mainstream oncology practice has the potential to improve early detection and screening of malnutrition, access to nutrition services and communication for improved patient management( Reference Davies 22 , Reference Wood 40 ). Awareness and consideration of nutritional issues among oncologists and other related health disciplines are also vital to the success of nutrition support in cancer care( Reference De Waele, Mattens and Honore 24 , Reference Barrera and Demark-Wahnefried 36 ). In settings with limited nutritionists/dietitians, provision of protocols for screening can enable task shifting that has been shown to be effective and affordable in improving access to healthcare( Reference Joshi, Alim and Kengne 41 ).
Findings on sociodemographic and behavioural factors add insights to the likely influence of social factors in the management of cancer. Disease-aggravating factors such as cigarette smoking and alcohol consumption were prevalent and significantly associated with the presence of malnutrition. Cigarette smoking was a predictor of cachexia. Public sensitisation on the ill-effects of such risk factors and raising the suspicion index among healthcare workers is important. The Global Burden of Disease 2016 report( Reference Fitzmaurice, Allen and Barber 23 ) showed that mortality due to all cancers is largely located on the African continent and expected to increase due to the epidemiological transition. Continued research and surveillance therefore remain critical. Further research is needed to understand the nutrition requirements in various care settings, and explore novel cancer preventive and control strategies( Reference Caccialanza, Cereda and Pinto 19 , Reference Kim and Sung 38 ). The emergence of population-based cancer registries in East Africa should be supported, and so should prioritisation of cancer control programmes within the health-care systems( Reference Caccialanza, Cereda and Pinto 19 , Reference Kantelhardt, Cubasch and Hanson 42 – Reference Lebret, Coloby and Descotes 44 ).
Conclusions
Malnutrition and cachexia remain a challenge among cancer out-patients in Nairobi, Kenya, yet the provision of nutritional services remains low. The use of the MUST as a screening tool at the first point of care has the potential to identify patients at risk of malnutrition and who are likely to benefit from appropriate interventions for better health outcomes. The local diagnostic criteria for cachexia should be reassessed to ensure correct identification of patients at risk of cachexia for initiation of appropriate care. There is need for inclusion of body composition assessments in Kenyan public hospitals for refined nutritional assessments that will in turn inform patient management plans. Age is a common predictor of malnutrition and cachexia in addition to site of cancer for malnutrition and cigarette smoking for cachexia. Tailored education and sensitisation campaigns should therefore be encouraged and multidisciplinary partnerships formed to provide holistic cancer care.
Limitations
The study did not measure inflammatory markers or ascertain the aetiology of malnutrition observed. The contribution of inflammation and other catabolic drivers to the development and progression of cachexia was also not assessed. This was partly due to the design of the study and the choice of out-patients in whom tests for inflammatory markers are not routinely done in the selected study facilities.
Acknowledgements
The study team acknowledges and appreciates the input of various partners who contributed to the development, planning and execution of the study. We would like to express our heartfelt appreciation to experts from the Kenya Medical Research Institute (KEMRI), Kenya Cancer Association and KNH who participated in the planning and implementation processes. Our earnest gratitude goes to the management of collaborating institutions for providing the necessary administrative, technical and logistical support. We would like to thank the following facility staff for their dedication and support during data collection: Lydia Wataka and Onesmus Kariuki of TCC and Irene Karanja and Carol Wambua of KNH. We also thank the following research assistants for their hard work and commitment to this study: Rodgers Ochieng, Melvin Obuya, Schiller Mbuka, Peter Shigholi, Dorine Njeri, Mercy Chepkirui, Paul Odhacha, Isaac Kisiangani and Fidel Muendo. We wish to thank all the study participants and caregivers for their cooperation.
This work was supported by KEMRI (grant no. IRG 176/6) and the Coca-Cola Company (grant no. E-1176). KEMRI and the Coca-Cola Company had no role in the design, analysis or writing of this article.
L. U. K., Z. N. B., Y. O., R. M. and C. F. L. M. contributed to study conceptualisation, design, data collection, analysis and manuscript writing. E. M. and M. M. contributed to the study design, data processing, data analysis and manuscript writing. A. K. participated in study conceptualisation, data analysis and manuscript writing. V. T. and C. N. participated in data collection and manuscript writing.
There were no conflicts of interest.


 Open access