


1. Introduction
Arched magnetized plasma structures are ubiquitous in the solar atmosphere. Solar prominences and coronal loops are notable examples of such structures that confine a current carrying plasma by closed magnetic fields. Magnetic loops in the solar corona have characteristically low plasma beta ($\beta \approx 10^{-3} -10^{-2}$ ), which suggests a nearly force-free state of these structures (Nakagawa Reference Nakagawa1973; Török, Kliem & Titov Reference Török, Kliem and Titov2004; Wiegelmann & Sakurai Reference Wiegelmann and Sakurai2012). A photograph of a solar prominence, a model of its structure and the laboratory arrangement to model the prominence eruption are depicted in figure 1. Solar prominences can remain stable for days to a few weeks (Hildner et al. Reference Hildner, Gosling, MacQueen, Munro, Poland and Ross1975; Chen Reference Chen1996; Lang Reference Lang2001; Cremades & Bothmer Reference Cremades and Bothmer2004). Typical length of these structures is of the order of $10^7$
 –$10^8$
 m (Chen Reference Chen2017). Some of these structures lose confinement sporadically and erupt owing to the loss of equilibrium (Abbot Reference Abbot1911; Rosner, Tucker & Vaiana Reference Rosner, Tucker and Vaiana1978; Burlaga Reference Burlaga1988; Rust Reference Rust1994). The relatively stable pre-eruption phase for these structures lasts for several thousands of Alfvén transit times (time taken by the Alfvén wave to travel from one to the other footpoint of the arched plasma). Solar eruptive events (e.g. coronal mass ejections, solar flares and jets) are among the most energetic events associated with the eruption of plasma in the solar system. It is estimated that coronal mass ejections in the forms of eruptions and flares can release $10^{30}{-}10^{33}$
 ergs of energy in the form of kinetic energy of the bulk plasma motion and/or electromagnetic radiation (Chen Reference Chen2017).
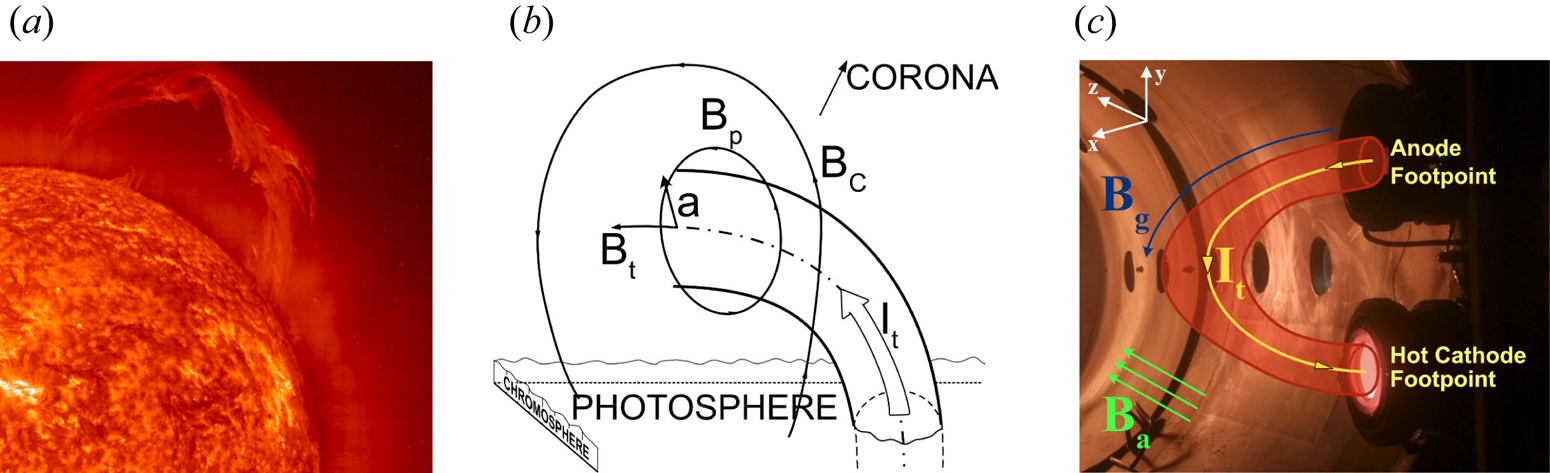
Figure 1. (a) A solar prominence observed at the extreme ultraviolet (EUV) wavelength of 304 Å by SOHO spacecraft on 28 March 2000 (Credit: NASA). (b) Schematic of a model flux rope in solar corona with overlying strapping field $\it{B_c}$ . Minor radius $a$
 and flux rope current $I_t$
 are indicated. Toroidal and poloidal components of the magnetic field are $\it{B_t}$
 and $\it{B_p}$
 , respectively (adapted from Chen Reference Chen2017). (c) Photograph of the experimental set-up depicting a current filament $I_t$
 , guiding magnetic field $\it{B_g}$
 and ambient (or overlying) magnetic field $\it{B_a}$
 . The experiment simulates the background conditions of a solar prominence shown in panel (b).
The kink instability is a prominent candidate for triggering eruptions on the Sun. Observational signatures of this instability are usually associated with helical deformations (i.e. writhe and twist) of filaments and prominences (Sakurai Reference Sakurai1976; Sturrock et al. Reference Sturrock, Weber, Wheatland and Wolfson2001; Fan Reference Fan2005; Török & Kliem Reference Török and Kliem2005). An improved understanding of the processes that lead to eruptions and affect the dynamics of arched magnetized plasmas is of utmost importance for the prediction of solar energetic events. A laboratory plasma experiment was designed at UCLA to address this important topic (Tripathi & Gekelman Reference Tripathi and Gekelman2010). The experiment facilitated in situ measurements on varieties of arched current-carrying magnetized plasma (see figure 1c). The footpoints of the arched plasma were anchored on the cathode and anode, which imposed line-tied boundary conditions at both ends of the arch. Plasma parameters in the experiment were appropriately scaled to capture the essential physics of arched plasma on the Sun (Tripathi & Gekelman Reference Tripathi and Gekelman2010). Development of writhe and/or twist of a kink-stable arched plasma, in the presence of a strong overlying magnetic field, is the main focus of this paper. Counter to our intuition, the low-$\beta$ and kink-stable arched plasma in this experiment displays a non-force-free behaviour, which will be shown in three-dimensional (3-D) measurements of the electrical current density and magnetic field.
Modelling solar prominences in a laboratory or computer simulation often involves creation of flux ropes – twisted magnetic structures arising from a significant poloidal magnetic field generated by a toroidal electrical current (see figure 1(b) for coordinates) (Low Reference Low2001; Fan Reference Fan2005; Chen Reference Chen2011; Török et al. Reference Török, Panasenco, Titov, Mikić, Reeves, Velli, Linker and De Toma2011). A kink-unstable magnetic flux rope with electrical current along an externally imposed toroidal magnetic field, $\it{B_t}$ , is expected to develop writhe owing to the dominance of a self-generated magnetic field, $\it{B_p}$
 . Quantitatively, writhe is a measure of net self-coiling of magnetic field lines and is related to its total torsion (how sharply it is twisting out of the plane of curvature) (Török et al. Reference Török, Kliem, Berger, Linton, Demoulin and van Driel-Gesztelyi2014). In the absence of an overlying magnetic field, writhe of a flux rope is dependent on the magnitudes of the electrical current and toroidal magnetic field. Therefore, it is also related to magnetic helicity through $H = F^2(T + W)$
 ; where $H$
 is the relative helicity, $F$
 is the axial magnetic flux, $W$
 is the writhe and $T$
 is the number of turns of the field line (Berger & Prior Reference Berger and Prior2006). The same formula applies to flux ropes with line-tied boundary conditions at both footpoints. Under ideal magnetohydrodynamic (MHD) assumptions (justified for solar prominences), the magnetic helicity is nearly conserved. Therefore, the twist and writhe are closely coupled to each other. The total twist, $\varPhi$
 , can be expressed as (Hood & Priest Reference Hood and Priest1981)

where $l$ is the length of the flux rope, $r$
 is the minor radius, $\it{B_z}$
 is the axial magnetic field and $\it{B_{\phi }}$
 is the azimuthal magnetic field. When the twist exceeds a critical value $\varPhi _c$
 , the system becomes kink unstable and evolves to reduce the curvature of the magnetic field lines. This process lowers the net magnetic energy of the system and effectively converts the twist into writhe (Shafranov Reference Shafranov1957; Kruskal & Tuck Reference Kruskal and Tuck1958; Freidberg Reference Freidberg1982; Priest Reference Priest1982). For line-tied magnetic arches (aspect ratio = major radius/minor radius $\approx$
 5), the critical value of the twist parameter, $\varPhi _c$
 , has been estimated to be $\approx 3.5{\rm \pi}$
 (Török et al. Reference Török, Kliem and Titov2004). Although the exact nature of the stored magnetic energy prior to solar eruptions is still a matter of debate, the free magnetic energy stored in a sheared magnetic configuration is identified to be a leading candidate in contemporary computer simulations (Linker Reference Linker, Mikić, Riley, Lionello and Odstrcil2003; Fan Reference Fan2005; Gibson et al. Reference Gibson, Fan, Török and Kliem2006). An association between the sign of the magnetic helicity and shape of filaments has been suggested by several authors (Nakagawa et al. Reference Nakagawa, Raadu, Billings and McNamara1971). It has been observed that reverse-S shaped structures dominate the Northern Hemisphere of the Sun, while forward-S shaped structures are more abundant in the Southern Hemisphere (Rust & Kumar Reference Rust and Kumar1996). The writhe and twist naturally develop in a sheared magnetic configuration, which produce sigmoidal shaped (forward-S or reverse-S) solar filaments (Török et al. Reference Török, Kliem, Berger, Linton, Demoulin and van Driel-Gesztelyi2014). We note that the total twist in a sheared magnetic configuration may not be accurately estimated using (1.1) owing to underlying assumptions of azimuthal symmetry.
Experimental studies on the arched plasmas have been conducted in the past by a number of groups. The first laboratory experiment simulating the solar arched plasmas demonstrated that an arched magnetic flux rope (AMFR) can be created by driving an electrical current along a guiding magnetic field (Bostick Reference Bostick1956). The next generation of laboratory experiments on arched plasmas were developed in the early 2000s by the Caltech group (Bellan & Hansen Reference Bellan and Hansen1998; Hansen Reference Hansen2001; Hansen, Tripathi & Bellan Reference Hansen, Tripathi and Bellan2004; Tripathi, Bellan & Yun Reference Tripathi, Bellan and Yun2007). Their findings included an explanation of sigmoidal shapes and filamentation of the current channels via a force-free state equation, and demonstration that the strapping field can inhibit the eruption of solar prominences. The Caltech group also researched the kink instability, identifying it as a poloidal flux amplification mechanism (Hsu & Bellan Reference Hsu and Bellan2003). Their work has been followed by AMFR experiments conducted at FlareLab (Arnold et al. Reference Arnold, Dreher, Grauer, Soltwisch and Stein2008; Soltwisch et al. Reference Soltwisch, Kempkes, Mackel, Stein, Tenfelde, Arnold, Dreher and Grauer2010). At Princeton, the MRX group investigated arched plasma stability in terms of kink and torus instability parameters (Myers et al. Reference Myers2015a, Reference Myers, Yamada, Ji, Yoo, Fox, Jara-Almonte, Savcheva and DeLucab), where they identified the guiding magnetic field tension force as the key mechanism to suppress eruption. The MRX group also studied the low-$\beta$ MHD forces in an arched laboratory plasma (Myers et al. Reference Myers, Yamada, Ji, Yoo, Jara-Almonte and Fox2016). The dynamics of straight magnetic flux ropes, including magnetic reconnection and kink instability, has been extensively studied in laboratory experiments (Gekelman, Maggs & Pfister Reference Gekelman, Maggs and Pfister1992; Bergerson et al. Reference Bergerson, Forest, Fiksel, Hannum, Kendrick, Sarff and Stambler2006; Furno et al. Reference Furno, Intrator, Ryutov, Abbate, Madziwa-Nussinov, Light, Dorf and Lapenta2006; Intrator et al. Reference Intrator, Sun, Lapenta, Dorf and Furno2009; Lawrence & Gekelman Reference Lawrence and Gekelman2009). In the above-mentioned laboratory research on arched magnetized plasmas, the electrical current rises to several kiloamperes within a few Alfvén transit times. As a result, the outward hoop force and strong poloidal twist dominate the arched plasma dynamics during the pre-eruption phase – unlike pre-eruptive solar arched plasmas with less than two poloidal twists from one footpoint to the other (Leroy, Bommier & Sahal-Brechot Reference Leroy, Bommier and Sahal-Brechot1983; Casini et al. Reference Casini, Ariste, Tomczyk and Lites2003). A new approach to laboratory simulations of solar AMFRs was introduced at UCLA to capture the essential features of solar AMFR eruptions (Tripathi & Gekelman Reference Tripathi and Gekelman2010, Reference Tripathi and Gekelman2013). Owing to the much lower electrical current (<200 A) and poloidal twist of the magnetic field, the UCLA set-up captures the essential features of solar arched plasmas during the pre-eruption phase. The experiments at UCLA introduce two independent plasma sources, which produce the arched magnetized plasma and the background plasma. The evolution of the arched plasma takes place in the presence of a background magnetized plasma, which plays an important role in wave excitation and energy transport. Moreover, the relative magnitude of parameters in the arched and background plasma can be varied, and the magnetic field direction can be reversed. Most importantly, the electrical current in the arched plasma can be kept below the kink-instability threshold long enough ($>50 \tau_A$
 ) to study the behaviour and evolution of an arched plasma during the pre-eruption phase. The high reproducibility of this experiment and the ability to take measurements in three spatial dimensions allows for reconstruction and visualization of the magnetic field, current density and other plasma parameters in three dimensions and in time.
The development of writhe in a kink-stable arched plasma in a sheared magnetic configuration was studied in this experiment. It is demonstrated that the occurrence of the kink instability is not a necessary requirement for the formation of writhe and twist. Dependence of the writhe of the arched plasma on the magnitude of the overlying magnetic field has been examined. In addition, the parallel and antiparallel orientations of the guiding magnetic field have been correlated with the occurrence of forward-S and reverse-S shaped arched plasmas.
2. Experimental set-up
The experimental set-up was designed with the primary goal of modelling the arched magnetized and current-carrying plasmas on the Sun. This was accomplished by driving an electrical current between two electrodes along an arched vacuum magnetic field (see figures 1(c) and 2). Footpoints of the arched plasma are anchored on electrodes.

Figure 2. Schematic of the experimental set-up depicting cross-sections of the vacuum chamber from top (a) and side (b) views. The coordinate system used throughout this paper and its origin are indicated in panels (a,b). The origin is located on the axis of the vacuum chamber, in front of the arched plasma source, as indicated in panels (a,b). The ambient (or background) plasma column is highlighted by a light pink colour. The arched plasma is shown in a dark-pink colour in both views. These plasma sources are operated in sync using two different discharge sources. The combination of the magnetic field generated by larger electromagnets outside the chamber and smaller electromagnets around footpoints of the arched plasma produces a sheared magnetic configuration and provides flexibility in simulating varieties of force-balance scenarios for the arched plasma evolution.
The experiment was performed in a cylindrical vacuum chamber (5.0 m long, 1.0 m diameter). Helium was used as a background neutral gas (pressure: 5–9 mtorr). As shown in figure 2, multiple electromagnets were placed around the vacuum chamber to produce a near uniform and up to 300 Gauss axial magnetic field inside the chamber. The axial magnetic field confined the ambient cylindrical plasma. It also provided an overlying magnetic field for the arched plasma, which impacted the eruption dynamics. The guiding magnetic field (900 G at footpoints) was produced using two smaller electromagnets that surrounded the cathode and anode (the footpoints of the arched plasma, see the side view in figure 2). The ambient plasma was produced by a lanthanum hexaboride (LaB$_6$ ) hot-cathode source ($\approx$
 20 cm diameter). A discharge was created between this emissive cathode and a molybdenum wire-mesh anode that was located 30 cm away. This plasma source was placed at one end of the vacuum chamber and connected to a discharge pulser (V$_{\text {max}}$
 , 200 V; I$_{\text {max}}$
 , 2.5 kA; repetition rate, 0.5 Hz; pulsewidth,15 ms). The cathode was indirectly heated up to $1700\,^{\circ }\textrm {C}$
 . At this temperature, it became efficient in the thermionic emission of electrons (Cooper & Gekelman Reference Cooper and Gekelman2013). The ambient plasma (0.6 m diameter, 4 m long, plasma density $n_e = 10^{12}$
 cm$^{-3}$
 , electron temperature $T_e = 4$
 eV, pulsewidth = 10–15 ms) was produced by the acceleration of primary electrons from the cathode during the discharge pulse. The arched plasma (pulsewidth = 0.2–0.8 ms) was created using another cathode/anode pair. The anode was a 15 cm diameter copper disk and the cathode was a 7.6 cm diameter indirectly heated LaB$_6$
 disk (temperature $\approx$
 1800 $^{\circ }$
 C). This anode/cathode pair was mounted on two side ports of the chamber. Typically, the arched plasma had $n_e = 5 \times 10^{13}$
 cm$^{-3}$
 , $T_e = 13$
 eV, Alfvén transit time $\tau _A = 2$ $\mathrm {\mu }$
 s and resistive diffusion time $\tau _R = 500$ $\mathrm {\mu }$
 s. The arched plasma source used a floating power supply and it operated in sync with the ambient plasma source. Separation between the footpoints of the arched plasma was varied in the range of 15–41 cm. Both electrodes resided in the $z=0$
 symmetry plane, at $x=-28$
 cm and $y=\pm 13.5\,\textrm {cm}$
 (coordinate system depicted in figure 2). Typical parameters of the arched plasma and a quiescent solar prominence are presented in table 1.
Table 1. Comparison of relative plasma parameters of a typical solar prominence (Chen Reference Chen2017) and the laboratory arched plasma.
A computer-controlled 3-D probe drive system and a multichannel digitizer were used to acquire high-resolution 3-D data from this experiment. Dual-tip Langmuir and three-axis magnetic probes were the main diagnostics tools. These probes were built using high-temperature ceramic-coated wires and other components that could withstand up to 750 $^{\circ }$ C temperature near the cathode footpoint of the arched plasma. This set-up allowed for a reliable and efficient measurement of plasma parameters ($n$
 , $T_e$
 , $\it{\boldsymbol{B}}$
 ) with a good spatio-temporal resolution (spatial resolution $\Delta x = 1.5$
 cm, temporal resolution $\Delta t = 4\times 10^{-8}$
 s for the results reported here). The experiment was highly reproducible and it operated with a 0.5 Hz repetition rate. This facilitated measurement of the key plasma parameters in three dimensions. A fast intensified charge-coupled device (CCD) camera (5 ns minimum exposure time, 1280 $\times$
 1024 resolution, forced air cooling, and 12 bit digital converter) was used to record the images of the plasma from two different perspectives (side and top-front views, as marked in figure 2).
3. Results and discussion
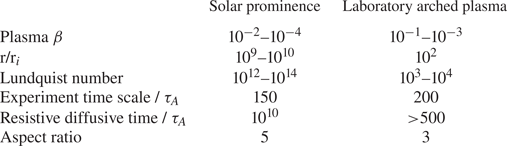
A series of experiments were conducted under different magnetic field configurations to examine the effect of the overlying magnetic field magnitude and the guiding magnetic field direction on the evolution of an arched magnetized plasma. The arched plasma current varied in the range of 50–150 A. Typical time traces of the arched plasma current and voltage are presented in figure 3. It is evident that the arched plasma current evolved on time scales much faster than the resistive diffusion time ($\tau _R \approx 500\,\mathrm {\mu }\textrm {s}$ ). During earlier stages of evolution ($t < 100\,\mathrm {\mu }\textrm {s}$
 ), the poloidal magnetic-flux in the arched plasma gradually built up, which led to dynamic and eruptive behaviour. A quasi-steady-state of the arched plasma (nearly persistence appearance with low-frequency global oscillations) was identified at later stages ($t>100\,\mathrm {\mu }\textrm {s}$
 ).
).
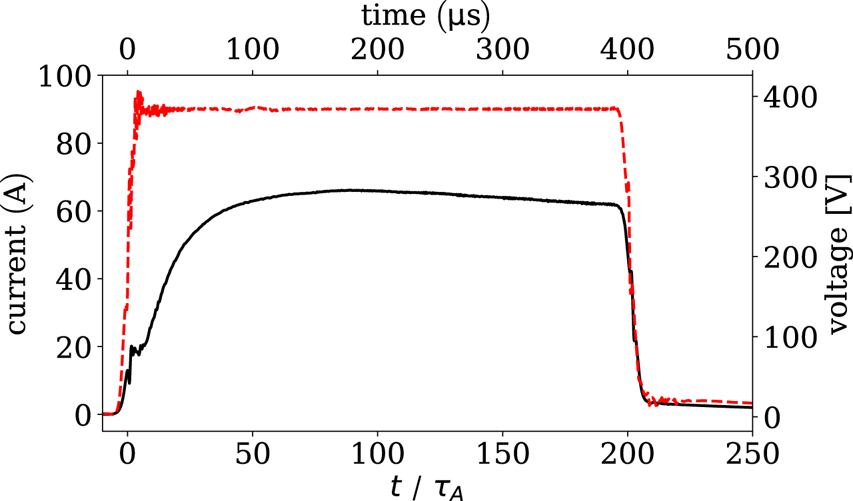
Figure 3. The discharge current (solid black line) and the discharge voltage (dashed red line) time traces of the arched plasma source in the presence of a 15 Gauss ambient magnetic field. Each trace is an average of 16 shots. The guiding magnetic field is oriented parallel to the arched plasma current. Similar trends in the discharge current evolution are observed at other magnetic configurations. During the first 100 $\mathrm {\mu }$ s of the discharge, the current gradually builds up and the arched plasma evolves. A relatively stable phase with persistent appearance of the plasma is observed after $100$ $\mathrm {\mu }$
 s.
s.
Unfiltered images of the arched plasma are presented in figure 4. These images were recorded along the $z$ -axis using the fast camera (located at $z = -3$
 m, see figure 2). The three panels in this figure were captured at three different overlying magnetic fields (0, 30 and 60 Gauss) at 300 $\mathrm {\mu }$
 s after the initiation of the arched plasma discharge, which corresponds to the final stage of the arched plasma evolution. Figure 4(a) corresponds to a case with no overlying magnetic field, where the plasma evolved to a uniform arch. Significant changes in the morphology of the arched plasma were evident at higher overlying magnetic fields, most notably the appearance of an S-shaped bright region (see figure 4c). The main role of the overlying magnetic field in affecting the dynamics of the arched plasma can be explained by highlighting the importance of Lorentz force associated with the arched plasma current ($I_t$
 ) and the overlying magnetic field ($\it{B_a}$
 ). In the solar atmosphere, this force appears owing to the interaction of a large-scale strapping field with the electrical current of a prominence or filament (Yokoyama & Shibata Reference Yokoyama and Shibata1996; Archontis et al. Reference Archontis, Moreno-Insertis, Galsgaard and Hood2005; Yuan et al. Reference Yuan, Lin, Wu and Ho2009) (see figure 1b). Relative directions of the overlying (or strapping) magnetic field and the arched plasma (or prominence) current dictate the direction of this Lorentz force. In most cases, this force is in the inward direction on the Sun and it assists in inhibiting the prominence eruption. Therefore, the Lorentz force arising from the overlying magnetic field was arranged to be in the inward direction in the experiment. In addition to altering the balance of magnetic forces, an overlying magnetic field introduced magnetic shear at the leading edge of the arched plasma, which significantly affected the morphology. Formation of the S-shaped structure in figure 4(c) was a direct result of the development of a strong magnetic shear in the arched plasma.
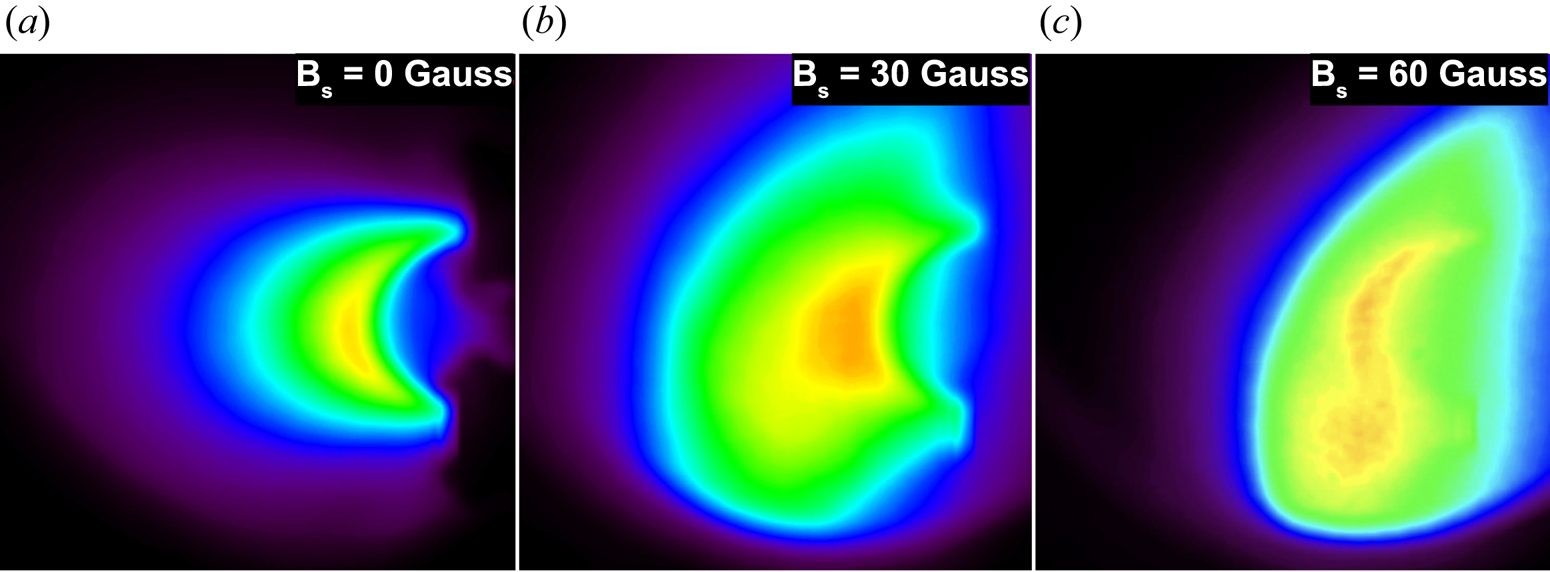
Figure 4. Unfiltered camera images of the arched plasma taken along the $z$ -axis that present the side-view perspective in figure 2. The red and yellow colours signify a higher plasma density, whereas blue and purple colours represent the lower density edge region of the arched plasma. Panels (a–c) correspond to the overlying background magnetic fields of 0, 30 and 60 Gauss, respectively, along the positive $z$
 -axis (into the page). Each frame is taken at 300 $\mathrm {\mu }$
 s after discharge. These panels represent the final stages of the arched plasma evolution. The earlier stages of the evolution are better captured in the 3-D magnetic field data (presented in figure 6). Deformation of the arched structure and formation of a sigmoid shape are observed at higher ambient magnetic fields in panels (b,c).
Images of the arched plasma are useful in the identification of global structures and key stages of the plasma dynamics. However, fine-scale internal structures can be better captured in a high-resolution 3-D measurement of the magnetic field. Therefore, the analysis of images is complemented by tracking of the 3-D magnetic field and current density structures of the arched plasma for six different magnetic field configurations. The results for the overlying magnetic field $\it{B_a}$ = 0, 7.5, 15, 30 Gauss with the guiding magnetic field nearly parallel to the initial arched plasma current are presented in figures 5 and 6. Following that, figure 7 presents measurements for the overlying magnetic field $\it{B_a}$
 = 15, 30 Gauss with the guiding magnetic field nearly antiparallel to the initial arched plasma current. The case of $\it{B_a}=0$
 Gauss is reported to serve as a baseline. The streamlines of plasma current density and total magnetic field, shown in figures 5–7, are computed by processing volumetric data ($\Delta x = 50$
 cm, $\Delta y = 40$
 cm, $\Delta z = 40$
 cm) from a three-axis magnetic-loop probe. The temporal evolution was recorded with respect to the time when the arched plasma source was turned on at $t = 0\,\mathrm {\mu }$
 s. Typical Alfvén transit and resistive diffusion times are 2 $\mathrm {\mu }$
 s and 500 $\mathrm {\mu }$
 s, respectively. Therefore, changes in the morphology of the arched plasma were minimal after the time indicated in panels (c, f, i) for all magnetic configurations in figures 6 and 7. Filtered images of the arched plasma were recorded to capture the dynamics of singly ionized helium (468 nm narrow bandpass filter). These images were collected from the top-front view (the camera positioned at $x$
 = 65 cm, $y$
 = 20 cm, $z$
 = 0 cm, as indicated in figure 2) for $\it{B_a}$
 = 0, 7.5, 15 and 30 Gauss. Each case was investigated with the guiding field oriented nearly parallel and then nearly antiparallel to the initial arched plasma current. These images were processed to identify the symmetry axis of the arched plasma. The maximum He–I emission intensity along the horizontal direction was assumed to occur on the symmetry axis. The identification of the symmetry axis was helpful in tracking the morphological evolution of the arched plasma. A selection of processed images is presented in figure 8 for the antiparallel orientation of the guiding magnetic field with respect to the arched plasma current.

Figure 5. Streamlines of the electrical current density of an arched plasma measured at 25 $\mathrm {\mu }$ s (12.5 $\tau _A$
 since the birth of the arched plasma). The overlying magnetic field is turned off in this case. Therefore, the Lorentz force associated with the overlying magnetic field is absent. The solid streamlines (with arrowheads outside the tubes) represent the plasma current density, whereas transparent ribbons (with internal arrowheads) represent the total magnetic field (including the vacuum magnetic field). Cathode and anode footpoints are marked by ‘$-$
 ’ and ‘+’ signs, respectively. Electromagnetic coils are rendered in a transparent light-grey colour. The colour scales associated with the streamlines of the magnetic field and current density are indicated on the left. It is evident that the arched plasma current does not closely follow the vacuum magnetic field lines even in the absence of the overlying magnetic field.

Figure 6. The temporal evolution of the arched plasma is captured by displaying the streamlines of current density and magnetic field at 5 $\mathrm {\mu }$ s, 25 $\mathrm {\mu }$
 s and 100 $\mathrm {\mu }$
 s ($\tau _A$
 = 2 $\mathrm {\mu }$
 s) for three different ambient magnetic fields: 7.5 G (panels a–c), 15 G (panels d–f ) and 30 G (panels g–i). The guiding magnetic field and the electric current of the arched plasma are nearly parallel to each other in the beginning. The solid streamlines (with arrowheads outside tubes) represent the plasma current density, whereas transparent ribbons (with internal arrowheads) represent the total magnetic field (including vacuum magnetic field). Cathode and anode footpoints are marked by ‘$-$
 ’ and ‘+’ signs, respectively. Electromagnetic coils are rendered in a transparent light-grey colour. All panels share the same colour scale, displayed on the left of panel (a). The angle between current density lines and the magnetic field lines at the apex increases for stronger ambient magnetic fields. The sigmoid shape of the arched plasma takes a reversed-S orientation. The morphology of the arched plasma at $\approx$
 100 $\mathrm {\mu }$
 s represents the final stage of the spatio-temporal evolution. Three movies capturing a high resolution spatio-temporal evolution ($-$
 5 to 120 $\mathrm {\mu }$
 s) of the arched plasma for all three magnetic configurations are included in the supplementary material available at https://doi.org/10.1017/S0022377821001239.
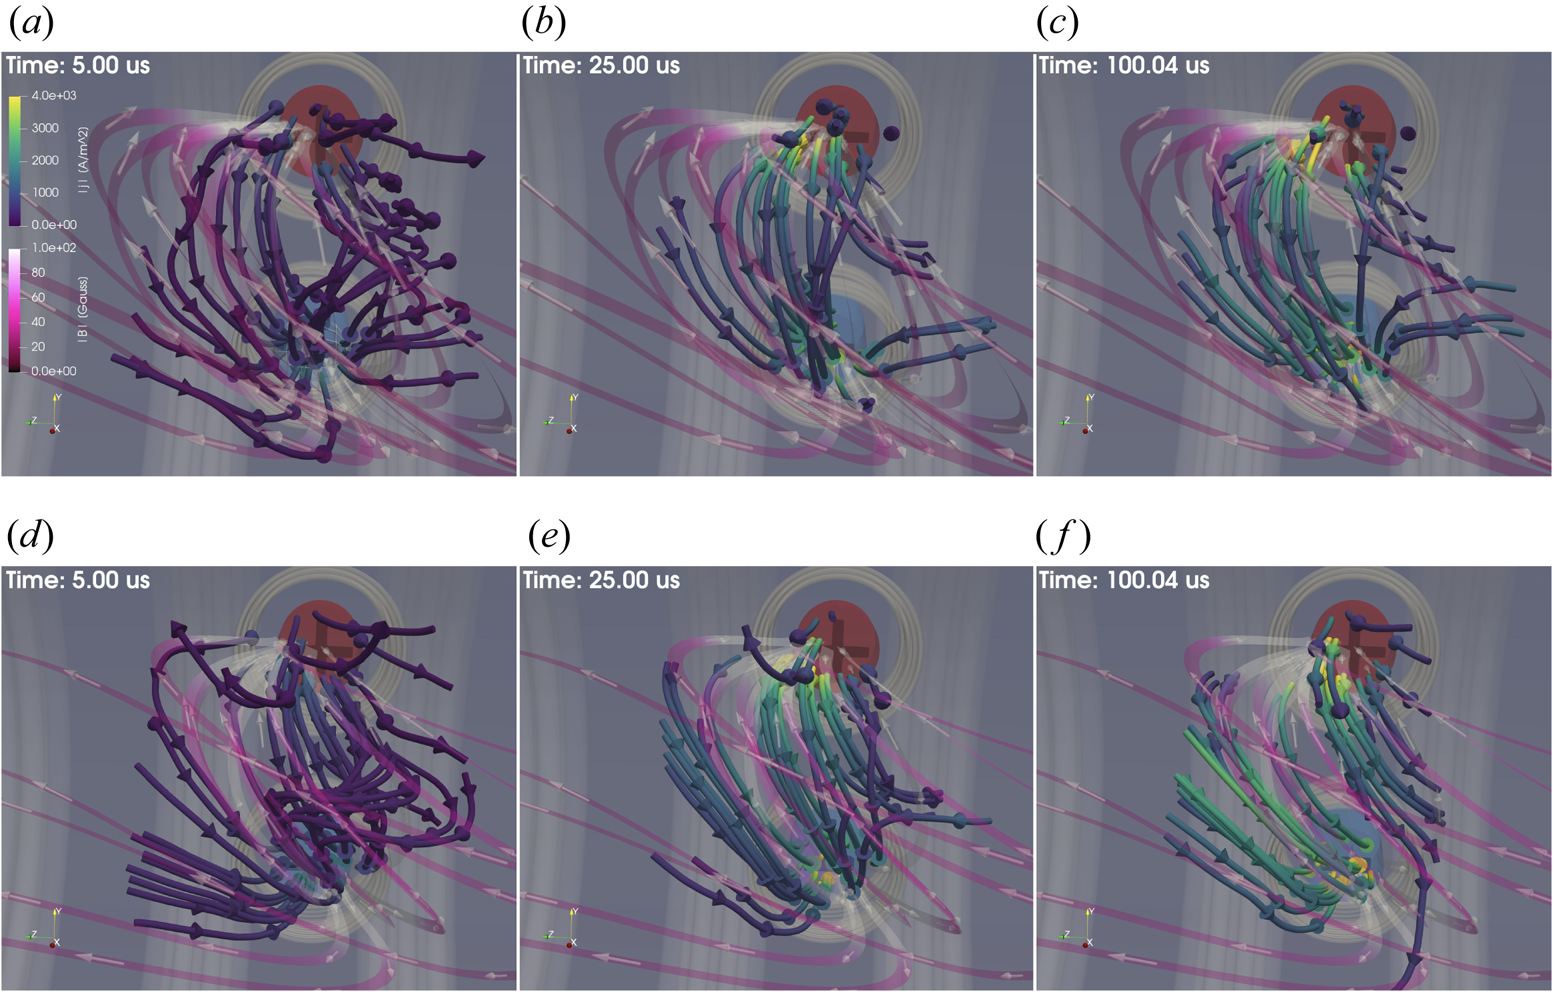
Figure 7. The temporal evolution of the arched plasma is captured by displaying the streamlines of current density and magnetic field at 5 $\mathrm {\mu }$ s, 25 $\mathrm {\mu }$
 s and 100 $\mathrm {\mu }$
 s ($\tau _A$
 = 2 $\mathrm {\mu }$
 s) for two different ambient magnetic fields: 15 G (panels a–c) and 30 G (panels d–e). The guiding magnetic field and the electric current of the arched plasma are nearly antiparallel to each other in the beginning. The solid streamlines (with arrowheads outside tubes) represent the plasma current density, whereas transparent ribbons (with internal arrowheads) represent the total magnetic field (including vacuum magnetic field). Cathode and anode footpoints are marked by ‘$-$
 ’ and ‘+’ signs, respectively. Electromagnetic coils are rendered in a transparent light-grey colour. All panels share the same colour scale, displayed on the left of panel (a). The angle between current density lines and the magnetic field lines at the apex increases for stronger ambient magnetic fields. The sigmoid shape of the arched plasma takes a forward-S orientation. The morphology of the arched plasma at $\approx$
 100 $\mathrm {\mu }$
 s represents the final stage of the spatio-temporal evolution. Two movies capturing a high-resolution spatio-temporal evolution ($-$
 5 to 120 $\mathrm {\mu }$
 s) of the arched plasma for both magnetic configurations are available in the supplementary material.
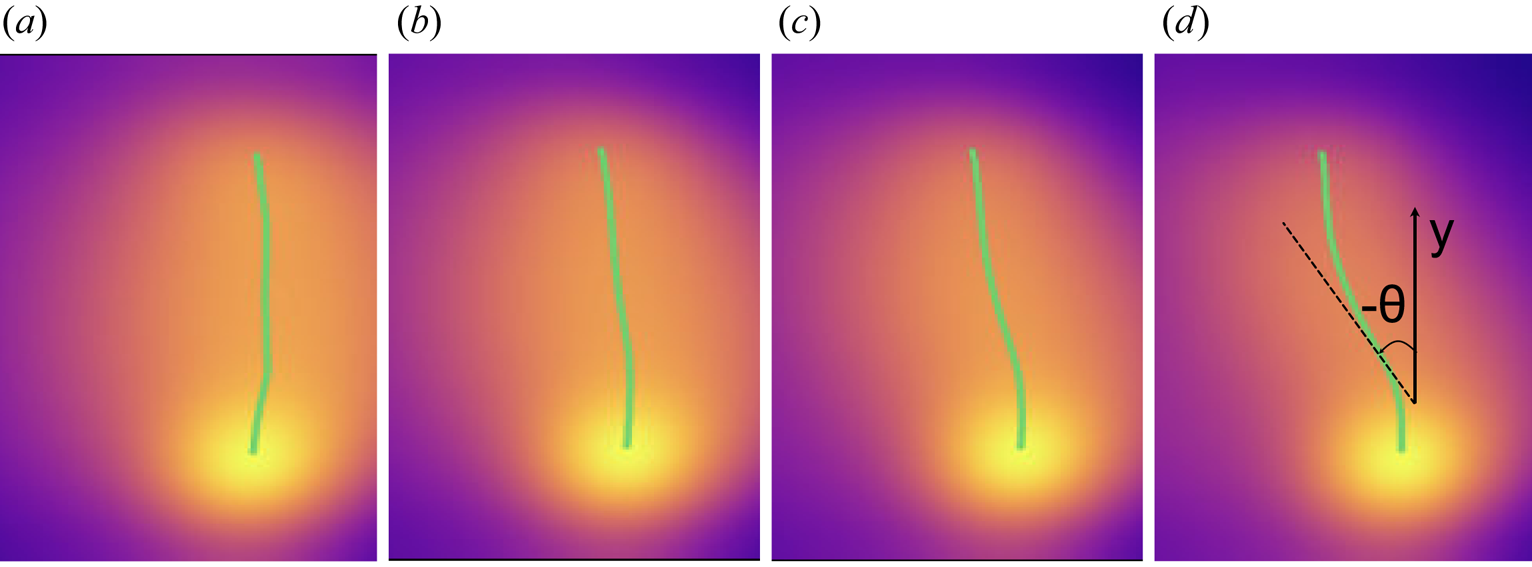
Figure 8. Fast camera images of singly ionized helium in the arched plasma (top-front view as indicated in figure 2, 468 nm narrow passband filtered) recorded at 125 $\mathrm {\mu }$ s after the discharge ($\approx$
 62.5 $\tau _A$
 ) for (a) 0 G, (b) 7.5 G, (c) 15 G and (d) 30 G overlying magnetic field configurations. The guiding magnetic field and the electrical current of the arched plasma are nearly antiparallel to each other in the beginning. The symmetry axis of the arched plasma in each frame is highlighted by the solid green line, which represents the peak intensity of the He$^+$
 emission. The magnetic shear of the arched plasma at the apex increases with the strength of the overlying magnetic field. The sheared configuration produces an arched plasma with a sigmoid (forward-S) shape that becomes more pronounced at higher magnitudes of the overlying magnetic field (see panels c,d). This trend is also observed when the guiding magnetic field and the arched plasma current are nearly parallel to each other in the beginning, except for the reverse-S shape of the arched plasma. The angle $\theta$
 defined in the text is indicated in panel (d).
The relative importance of three major magnetic forces on an arched plasma should be analysed before looking into its evolution under different scenarios of magnetic field configuration. It is reasonable to assume a half-torus shape of the arched plasma, which is subjected to guiding and overlying magnetic fields (illustrated in figure 1b). Three major magnetic forces on the arched plasma are the tension force, hoop force and strapping force (Chen Reference Chen1996). The tension force $\it{\boldsymbol{F_t}}$ is a restorative force which tends to decrease the major radius of the arched plasma. It can be expressed as
where $\it{\boldsymbol{\hat {R}}}$ is a unit vector pointing along the major radius $R$
 , $\mu _0$
 is the permeability of vacuum, $\it{\boldsymbol{B_{gv}}}$
 is the vacuum guiding magnetic field and $\it{\boldsymbol{B_g}}$
 is the total guiding magnetic field (includes contribution from plasma). The hoop force $\it{\boldsymbol{F_h}}$
 is directed along the major radius, and it assists in the outward expansion of the arch. The hoop force can be expressed as
where $I$ is the arched plasma current, $a$
 is the minor radius and $l_i$
 is the plasma self-inductance. The third major force on an arched plasma is the strapping force $\it{\boldsymbol{F_s}}$
 . This force is essentially a Lorentz force between the arched plasma current and the overlying magnetic field. Depending on the direction of the overlying magnetic field, the strapping force can be either inwards (for $\it{\boldsymbol{B_a}}$
 along the positive $z$
 -axis) or outwards (for $\it{\boldsymbol{B_a}}$
 along the negative $z$
 -axis). The strapping force (per unit length of the arched plasma) can be estimated by
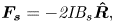
where $B_s$ is the magnitude of the strapping field. Relative magnitudes of three forces ($\it{\boldsymbol {F_h}}$
 , $\it{\boldsymbol {F_t}}$
 and $\it{\boldsymbol {F_t}}$
 ) govern the dynamics of an arched magnetized plasma in the laboratory and on the Sun. For a typical solar prominence, the relative magnitudes of hoop, tension and strapping forces are 1.0, 0.3 and 0.7, respectively (Chen Reference Chen1996). The magnetic field configurations were chosen strategically for this experiment to keep it relevant to the solar case. Therefore, it was important to keep the arched plasma current well below the current threshold for the kink instability.
In the case of $B_a$ = 0 Gauss, an outward expansion of the arch was dominated by the hoop force in the absence of an overlying magnetic field and associated Lorentz force (results presented in figure 5). The twist of the arched plasma for this configuration was observed to be minimal, as expected ($\varPhi _{\max } \approx 0.05{\rm \pi}$
 ). The arched plasma was therefore kink stable ($\varPhi < \varPhi _c$
 ). Interestingly, the arched plasma current did not closely follow the magnetic field. In the absence of an overlying magnetic field, this magnetic configuration serves as a baseline. In the following three magnetic configurations, the inward Lorentz force (strapping force) was applied using an overlying magnetic field ($B_a$
 = 7.5, 15, 30 Gauss, results presented in figure 6), while the guiding magnetic field was oriented nearly parallel to the arched plasma current. The overlying magnetic field naturally introduces magnetic shear in the arched plasma. The initial magnitude of the magnetic shear can be enhanced by application of a stronger overlying magnetic field, and its sign can be reversed by reversing the direction of the guiding magnetic field. The magnitude of the magnetic shear has a direct impact on the arched plasma evolution. Notably, the sigmoid shape (reverse-S) is prominent at stronger overlying magnetic fields. An increase in the magnitude of $B_a$
 enhances the strapping force and reduces the major radius of the arched plasma. For three different overlying magnetic fields, $B_a$
 = 7.5, 15 and 30 Gauss, the magnetic field twists $\varPhi _{\max } \approx 0.22{\rm \pi}, 0.35{\rm \pi}$
 and $0.73{\rm \pi}$
 are estimated, respectively. This confirms that the arched plasma is not kink unstable. Results in figure 6 suggest that even a kink-stable arched plasma produces a complex magnetic topology in the presence of a strong overlying magnetic field.
Finally, two magnetic configurations associated with antiparallel arched plasma current and guiding magnetic field were explored at $B_a$ = 15, 30 Gauss. Streamlines of magnetic field and electrical current density for both cases are depicted in figure 7. As expected, the sign of the magnetic shear was reversed in these cases when compared with the parallel guiding magnetic field cases presented in figure 6. The evolution of the magnetic topology of the arched plasma also differed. The sigmoid shape was again more prominent at stronger magnitudes of overlying magnetic field. However, the arched plasma took a forward-S shape in this case (as opposed to the reverse-S shape in figure 6). For both cases, the arched plasma current was well below the current threshold for the kink instability. The magnetic field twist was estimated using 3-D magnetic field data. The maximum twist of the arched plasma was $0.22{\rm \pi}$
 and $0.54{\rm \pi}$
 for $B_a$
 = 15 and 30 Gauss, respectively. The trend of increase in $\varPhi$
 at stronger ambient magnetic fields was also observed in the images (see figure 8). As discussed in § 1, the forward-S and reverse-S plasma structures are usually observed in different hemispheres of the Sun. A close association between sigmoid formation and solar eruption has been established in remote observations (Canfield, Hudson & Pevtsov Reference Canfield, Hudson and Pevtsov2000). The underlying cause for the formation of forward- and reverse-S shaped sigmoids on the Sun is still unresolved (DeVore & Antiochos Reference DeVore and Antiochos2000). Our experiments cannot rule out a correlation between kink instability and the shape of the sigmoid. However, our results confirm that kink instability is not a necessary requirement for the formation of a sigmoid on the Sun. In addition, the relative directions of the overlying and guiding magnetic fields play important roles in controlling the sign of thesigmoid.
Filtered images of singly ionized helium of the arched plasma were captured from the top-front-view (marked in figure 2b) to complement the magnetic field measurements. Cases of $B_a$ = 0, 7.5, 15 and 30 Gauss for both orientations of the guiding magnetic field were investigated. Analysis of these images agreed well with the estimates of twist from the 3-D magnetic field data (depicted in figures 5–7). The sigmoid shape was observed to be more pronounced at larger magnitudes of overlying magnetic field, and its sign changed with the reversal of the guiding magnetic field. For a guiding magnetic field oriented nearly parallel to the initial arched plasma current, a reverse-S shaped arched plasma was produced. Reversal of the guiding magnetic field (antiparallel to the arched plasma current) formed a forward-S shaped arched plasma. Selected images for all four cases of ambient magnetic field with guiding magnetic field in the antiparallel orientation are presented in figure 8. These panels represent the final stages of the arched plasma evolution ($\tau _A \ll t$
 = 125 $\mathrm {\mu }$
 s $< \tau _R$
 ). The solid green line in these panels highlights the symmetry axis of the arched plasma, where peak emission of He$^+$
 occurs in the horizontal direction. The overlying magnetic field significantly impacts the morphology of the arched plasma. The sigmoid shape of the arched plasma is visible at stronger overlying magnetic field, as evident in figure 8(d). The temporal evolutions of the sigmoid and associated twist are analysed by acquiring multiple frames of the He$^+$
 plasma at 40–200 $\mathrm {\mu }$
 s. The temporal resolution of these frames was 5 $\mathrm {\mu }$
 s. At each time step, the symmetry axis was computed and marked (as in the panels of figure 8). The angle $\theta$
 quantifies the angle between the vertical axis (connects both footpoints) and the symmetry axis at the leading edge of the arched plasma (marked in figure 8d). The forward-S shape of the arched plasma is characterized by a negative $\theta$
 , while the reverse-S shape has a positive $\theta$
 . The time evolution of $\theta$
 for parallel and antiparallel guiding magnetic fields (with respect to the arched plasma current) is presented in figure 9. The early stages of the arched plasma evolution (0–40 $\mu$
 s) were excluded from this analysis owing to the difficulty in accurately identifying the symmetry axis. This mainly arose from the lower intensity of the He$^+$
 emission in the beginning. These results are consistent with the 3-D magnetic field measurements on the observation of strong magnetic shear and sigmoid formation at stronger overlying magnetic fields. Moreover, the reversal of the sign of the sigmoid with a guiding magnetic field is also confirmed.
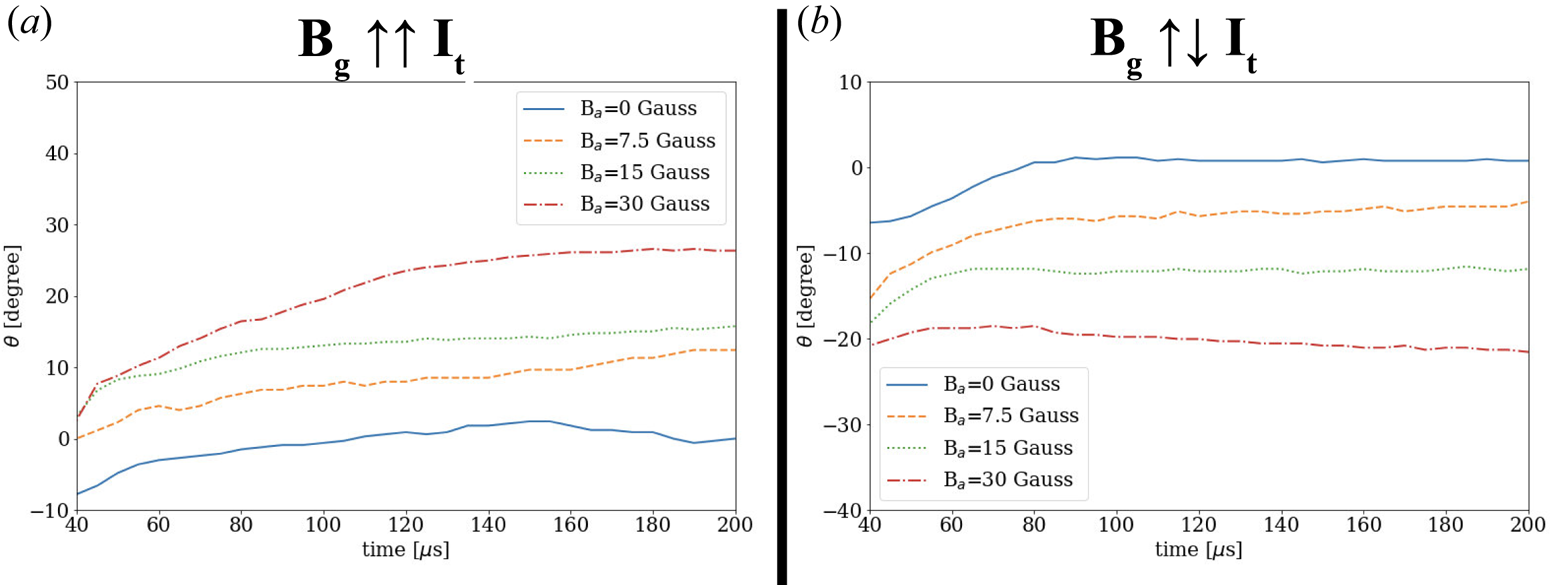
Figure 9. Temporal evolution of the shear angle $\theta$ (as indicated in figure 8d) at four different overlying magnetic fields (0, 7.5, 15 and 30 Gauss) are displayed in these panels: (a) guiding magnetic field is oriented nearly parallel to the initial arched plasma current; (b) guiding magnetic field is oriented nearly antiparallel to the initial arched plasma current. These panels display results during the later stages of the temporal evolution, mainly because the angle $\theta$
 could not be measured reliably in the beginning owing to the extremely dynamic nature of the arched plasma. There is a noticeable trend of an increase in $|\theta |$
 with the overlying magnetic field for both guiding field configurations. The negative angle $\theta$
 in the antiparallel guiding magnetic field configuration is associated with a forward-S shape, while the positive angle $\theta$
 (parallel case) corresponds to the reverse-S shape of the arched plasma.
These results indicate that the arched plasma is not in a force-free state (characterized by parallel magnetic field and electrical current). There are numerous examples of a force-free state of a low-$\beta$ plasma – especially in the solar corona. The concept of force-free magnetic fields has been widely used to model the coronal magnetic field structures (Nakagawa Reference Nakagawa1973). Although this simplified description is often useful in explaining the large-scale topological evolution of the magnetic fields, it is not always supported by observations – especially during eruptions and in the active region on the Sun (McClymont, Jiao & Mikic Reference McClymont, Jiao and Mikic1997; Chen Reference Chen2017). The observation of a non-force-free state in this laboratory experiment and active region on the Sun should not be unexpected, because the basic assumptions for the existence of a force-free state (ignorable pressure gradients, plasma flows and Hall term) are not supported by observations. Another example of non-parallel current and magnetic fields are the pressure-gradient driven diamagnetic currents in a low-$\beta$
 magnetized plasma. In our future research, we will attempt to identify the exact cause of the existence of a non-force-free state in our experiment. In this paper, the main focus is to highlight the development of sigmoid shapes in a kink-stable arched plasma. Our initial analysis suggests an eruptive behaviour of the arched plasma and formation of large-scale flux-rope structures, when sufficiently large magnetic shear is developed in the arched plasma ($t = 75{-}200$ $\mathrm {\mu }$
 s). These large-scale flux ropes are not captured in figures 6–8 and will be reported elsewhere.
4. Summary
The effect of a nearly horizontal overlying magnetic field on the evolution of an arched magnetized plasma has been studied in this laboratory plasma experiment. The experiment was designed to capture the dynamics of arched plasma eruptions on the Sun. The electrical current in the arched magnetized plasma was kept below 200 A to ensure that the relative magnitudes of hoop, tension and strapping forces for solar filaments and prominences are comparable with the experiment. The lower magnitude of the electrical current ensures that the arched plasma does not form multiple poloidal magnetic-field twists from one footpoint to the other during the pre-eruption phase (as observed on the Sun). Experimental results confirm that sigmoid plasma structures are naturally produced in a sheared magnetic configuration – even in the absence of the kink instability. The shear angle critically depends on the magnitude of the overlying magnetic field and the direction of the guiding magnetic field. This suggests that the apparent writhe of a current-carrying arched plasma has a strong dependence on the structure of the overlying magnetic field, not just on the magnitude of the electrical current. Evolution of the arched plasma in the presence of an overlying magnetic field with a variable decay index will be studied in the near future. The role of magnetic reconnection, Alfvén waves and global oscillations will also be explored using more comprehensive 3-D data of plasma parameters.
Supplementary movies
Supplementary movies are available at https://doi.org/10.1017/S0022377821001239.
Acknowledgements
Authors would like to thank W. Gekelman and S. Vincena for useful discussions and P. Pribyl, Z. Lucky, M. Drandell, T. Ly and A. S. Kohli for expert technical assistance.
Editor Cary Forest thanks the referees for their advice in evaluating this article.
Funding
This research was primarily supported by funds from National Science Foundation (Award Number: PHY-1619551). Partial support to S.T. from NASA (HERMES DRIVE Science Center, Award Number: 80NSSC20K0604) is also acknowledged. The experiment is conducted at the Basic Plasma Science Facility (BaPSF) at UCLA, which is supported by US DOE under Contract No. DE-FC02-07ER54918 and the NSF under Award No. PHY1561912.
Declaration of interests
The authors report no conflict of interest.


 Open access