


1 Introduction
Tokamak breakdown is the first process in tokamak start-up, during which the neutral gas is ionized to form plasma. Breakdown is normally achieved in conventional tokamaks via the toroidal electric field induced by the central solenoid (inductive start-up). In spherical tokamaks (STs), without the central solenoid, the main techniques for breakdown include electron Bernstein wave start-up (Shevchenko et al. Reference Shevchenko, O’Brien, Taylor and Saveliev2010), coaxial helicity injection (Ono et al. Reference Ono, Bell, Bell, Bigelow, Bitter, Blanchard, Darrow, Fredrickson, Gates and Grisham2001), merging–compression formation (Sykes et al. Reference Sykes, Akers, Appel, Arends, Carolan, Conway, Counsell, Cunningham, Dnestrovskij and Dnestrovskij2001) and other injections by plasma gun. Here we focus on the inductive start-up for conventional tokamaks. Currently, breakdown is not generally considered a challenge in tokamak design: all devices achieve successful breakdown by some means (pure ohmic heating or with other assisted heating methods), and the breakdown is just something to be done once and for all for steady state operation of tokamaks. One also has to notice that, since nearly all diagnostics and numerical tools are not designed for the low temperature and partially ionized plasma occurring during breakdown, our understanding of the breakdown phase is far from complete.
In our opinion, breakdown should be the focus of more careful investigation. One of the engineering and technological challenges faced by ITER is related to start-up (ITER Physics Expert Group on Disruptions et al.
1999; Sips et al.
Reference Sips, Giruzzi, Ide, Kessel, Luce, Snipes and Stober2015), which is in turn dependent on breakdown: ITER has to be operated under a low voltage condition, i.e. $E\leqslant 0.3~\text{V}~\text{m}^{-1}$
(ITER Physics Expert Group on Disruptions et al. (1999)), due to the limits of superconducting magnets for all major coils and a continuous vacuum vessel (Gribov et al.
Reference Gribov, Humphreys, Kajiwara, Lazarus, Lister, Ozeki, Portone, Shimada, Sips and Wesley2007). Up to now, various devices have been used to test the conditions related to ITER operation. Several tokamak devices, such as DIII-D, JET, ASDEX (Lloyd et al.
Reference Lloyd, Jackson, Taylor, Lazarus, Luce and Prater1991; Sips et al.
Reference Sips, Casper, Doyle, Giruzzi, Gribov, Hobirk, Hogeweij, Horton, Hubbard and Hutchinson2009), have already achieved low voltage start-up using only ohmic heating. It is found that if the applied electric field necessary for start-up is sufficiently low, there are some advantages for the operation: the resistive loss and impact of plasma disruption on the vacuum vessel can be reduced, and the amount of initial runaway electrons can be decreased significantly as well (Lloyd & Edlington Reference Lloyd and Edlington1986; Iyengar et al.
Reference Iyengar, Pal, Lahiri and Mukhopadhyay1998). However, the experiments have also shown that the operational conditions of tokamak start-up in the low electric field regime is confined within small margins: several parameters, such as magnetic error fields, impurity of beryllium and carbon and pre-filling gas pressure, have to be even more carefully controlled.
$E\leqslant 0.3~\text{V}~\text{m}^{-1}$
(ITER Physics Expert Group on Disruptions et al. (1999)), due to the limits of superconducting magnets for all major coils and a continuous vacuum vessel (Gribov et al.
Reference Gribov, Humphreys, Kajiwara, Lazarus, Lister, Ozeki, Portone, Shimada, Sips and Wesley2007). Up to now, various devices have been used to test the conditions related to ITER operation. Several tokamak devices, such as DIII-D, JET, ASDEX (Lloyd et al.
Reference Lloyd, Jackson, Taylor, Lazarus, Luce and Prater1991; Sips et al.
Reference Sips, Casper, Doyle, Giruzzi, Gribov, Hobirk, Hogeweij, Horton, Hubbard and Hutchinson2009), have already achieved low voltage start-up using only ohmic heating. It is found that if the applied electric field necessary for start-up is sufficiently low, there are some advantages for the operation: the resistive loss and impact of plasma disruption on the vacuum vessel can be reduced, and the amount of initial runaway electrons can be decreased significantly as well (Lloyd & Edlington Reference Lloyd and Edlington1986; Iyengar et al.
Reference Iyengar, Pal, Lahiri and Mukhopadhyay1998). However, the experiments have also shown that the operational conditions of tokamak start-up in the low electric field regime is confined within small margins: several parameters, such as magnetic error fields, impurity of beryllium and carbon and pre-filling gas pressure, have to be even more carefully controlled.
The formation of tokamak plasma is a complicated process. As it is well known, the successful start-up process is mainly decided by the applied electric field and pre-filling gas pressure (Lloyd et al. Reference Lloyd, Jackson, Taylor, Lazarus, Luce and Prater1991; Chattopadhyay et al. Reference Chattopadhyay, Pal, Ray and Gupta1996; Song et al. Reference Song, Song, Xia, Mao, Wang, Zhang and Chen2014). Wall conditions and stray magnetic fields also play a significant, even if slightly less decisive, role. Early theoretical and experimental investigations on initial discharge in a toroidal plasma can be found in Dimock et al. (Reference Dimock, Eubank, Hinnov, Johnson and Meservey1973), Sand, Waelbroeck & Waidmann (Reference Sand, Waelbroeck and Waidmann1973), Papoular (Reference Papoular1976), Strachan (Reference Strachan1976), Sometani & Fujisawa (Reference Sometani and Fujisawa1978). Later, in order to reduce the toroidal electric field, electron cyclotron resonance heating (ECRH) (Erckmann & Gasparino Reference Erckmann and Gasparino1994), ion cyclotron resonance heating (ICRH) (Steinmetz et al. Reference Steinmetz, Noterdaeme, Wagner, Wesner, Bäumler, Becker, Bosch, Brambilla, Braun and Brocken1987) and low hybrid wave heating (LHWH) (Yoshino & Seki Reference Yoshino and Seki1997; Shinya et al. Reference Shinya, Takase, Yajima, Moeller, Yamazaki, Tsujii, Yoshida, Ejiri, Togashi and Toida2017) started being employed to help initiate the discharge. Experiments (Gilgenbach et al. Reference Gilgenbach, Read, Hackett, Lucey, Granatstein, England, Loring, Wilgen, Isler and Peng1981; Holly et al. Reference Holly, Prager, Shepard and Sprott1981; Toi et al. Reference Toi, Ohkubo, Kawahata, Kawasumi, Matsuoka, Noda, Ogawa, Ogawa, Sato and Tanahashi1988; Yoshino & Seki Reference Yoshino and Seki1997; Lloyd Reference Lloyd1998) have proved that these auxiliary heating methods can lower the toroidal voltage needed to initiate start-up, reduce the volt-second consumption in start-up for more rapid burn through and even allow a large range for impurity content. ITER-like start-up scenarios have also been demonstrated in different tokamaks (Jackson et al. Reference Jackson, Casper, Luce, Humphreys, Ferron, Hyatt, Lazarus, Moyer, Petrie and Rudakov2008, Reference Jackson, Casper, Luce, Humphreys, Ferron, Hyatt, Leuer, Petrie, Turco and West2009, Reference Jackson, Politzer, Humphreys, Casper, Hyatt, Leuer, Lohr, Luce, Van Zeeland and Yu2010b ; Sips et al. Reference Sips, Casper, Doyle, Giruzzi, Gribov, Hobirk, Hogeweij, Horton, Hubbard and Hutchinson2009). Especially, ITER will also have its electron cyclotron (EC) assisted heating system. A theoretical analysis (Farina Reference Farina2017) using EC assisted pre-ionization has been done and it showed that cold electrons can easily gain energies well above the ionization energy in most conditions, which have been observed experimentally on DIII-D (Jackson et al. Reference Jackson, Austin, Degrassie, Hyatt, Lohr, Luce, Prater and West2010a ) and FTU (Granucci et al. Reference Granucci, Garavaglia, Ricci, Artaserse, Belli, Bin, Calabrò, Cavinato, Farina and Figini2015). Recently, an electron cyclotron heating (ECH) pre-ionization scheme using a trapped particle configuration has been developed with low loop voltage and low volt-second consumption (An et al. Reference An, Lee, Jo, Jung, Lee, Chung, Na, Hahm and Hwang2017; Lee et al. Reference Lee, Kim, An, Yoo, Hwang and Na2017). A study of breakdown experiments driven by radio frequency has also been done and combined with a one-point model to study the effects of magnetic structure (Yoneda et al. Reference Yoneda, Hanada, Nakamura, Idei, Yoshida, Hasegawa, Onchi, Kuroda, Kawasaki and Higashijima2017). Also, heating with a low hybrid current drive (LHCD) has been used to optimize the flux consumption. It has been confirmed that more flux can be saved than using ohmic heating only (Song et al. Reference Song, Duan, Song, Zheng, Wang, Li, Bai, Song, Wang and Sun2017). However, notwithstanding the many and significant experiments focused at understanding initial plasma behaviors, the physics behind it is not yet well understood, as proven by the fact that there are still many start-up shots which cannot be sustained.
In order to understand the key physics of start-up, a lot of simulation and analysis work (Jardin, Bell & Pomphrey Reference Jardin, Bell and Pomphrey1993; Leuer & Wesley Reference Leuer and Wesley1993; Tsutsui & Shimada Reference Tsutsui and Shimada1998; Senda et al. Reference Senda, Shoji, Tsunematsu, Matsukawa and Ushigusa1999; Belyakov et al. Reference Belyakov, Lobanov, Makarova, Mineev and Vasiliev2003; Formisano et al. Reference Formisano, Albanese, Ambrosino, de Magistris, Vries, Gribov, Ledda, Martone, Mattei and Minucci2017) has been done. The most successful model has been developed by Lloyd et al. (Reference Lloyd, Jackson, Taylor, Lazarus, Luce and Prater1991), Lloyd, Carolan & Warrick (Reference Lloyd, Carolan and Warrick1996). Lloyd’s work mostly centres on the operational parameters, such as the induced electric field, pre-filling gas pressure, the error magnetic field, which are critical factors for tokamak start-up. Later, based on the same code, Kim has developed a simulator, DYON (DYnamic 0D model of Non-fully ionized plasma) (Kim et al. Reference Kim, Fundamenski and Sips2012) which contains plasma–surface interaction effects and shows good agreement with carbon-wall JET data. Afterwards, DYON was used to simulate plasma burn through at JET with an ITER-like wall (Kim, Sips & Fundamenski Reference Kim, Sips and Fundamenski2013b ) and to make predictions on ITER operation modes (Kim, Sips & Contributors Reference Kim and Sips2013a ). Recently, a two-dimensional particle simulation code has been developed to specifically target ohmic breakdown in RZ plane which is in a cylindrical coordinate system (Yoo et al. Reference Yoo, Na, Kim, An, Jung, Hwang, Shim, Lee and Hahm2014, Reference Yoo, Lee, Kim and Na2017), in which only the space charge effect in the poloidal direction is considered.
In our previous work (Jiang et al.
Reference Jiang, Peng, Zhang and Lapenta2016), we have investigated tokamak start-up processes through particle-in-cell simulations with Monte Carlo collisions (PIC-MCC). There, we have analyzed quantities obtained from the simulations (i.e. plasma density, average electron and ion energy, electron and ion current density, $D_{\unicode[STIX]{x1D6FC}}$
emission which represents the excitation collision rate of neutrals, the ohmic heating rate) with the aim of better understanding the kinetic characteristics of tokamak discharge, as well as the key physics of start-up, especially during the breakdown phase. In that work, we mainly dealt with the development of a successful breakdown.
$D_{\unicode[STIX]{x1D6FC}}$
emission which represents the excitation collision rate of neutrals, the ohmic heating rate) with the aim of better understanding the kinetic characteristics of tokamak discharge, as well as the key physics of start-up, especially during the breakdown phase. In that work, we mainly dealt with the development of a successful breakdown.
In this work, we will further study the breakdown process, focusing on three points:
(i) The first purpose is to understand how the occurrence of the three breakdown modes (no breakdown, successful breakdown mode and runaway mode) depend on the initial parameters (voltage, pre-filling pressure), in the case when ohmic heating is mainly responsible for breakdown. We explore the parameter space to understand when each operational mode occurs.
(ii) The second purpose is to provide engineering references for general tokamak operation. The conditions of initial start-up can affect the overall behaviours of a tokamak plasma, which may lead to runaway, and even to later disruptions. Even after decades of research, the key physics of the start-up process is still unclear. Experimental attempts to understand it usually proceed by trial and error. We believe that the study on tokamak start-up should be pursued more thoroughly. This will not only greatly help to save the expenditure of volt-second consumption for later burn through and current ramping up phases by decreasing the induced electric field, but will also help to decrease the cost in relation to engineering issues, such as relaxing the requirement on the poloidal coils power supply system.
(iii) The third one is to expand our knowledge of gas breakdown and discharge. Tokamak breakdown and conventional gas breakdown have distinct conditions and properties. Gas breakdown under conventional conditions (e.g. lightings) is well understood both theoretically and experimentally. When gas breakdown happens in a tokamak, the strong magnetic fields and weak electric fields present there greatly complicate the picture. The conventional Townsend discharge theory may be not applicable to tokamak breakdown. This work will form some new insights into this old problem.
This paper is organized as follows: in § 2, we show simulation results that illustrate the role of pre-filling pressure and induced electric field in tokamak breakdown. The different breakdown modes are discussed in § 3 and the specific physical mechanisms of each is analysed. In § 4, the physics constraints on tokamak breakdown are presented. In § 5, conclusions and future work are discussed.
2 Simulation results
As the physical and numerical model has been discussed previously (Jiang et al.
Reference Jiang, Peng, Zhang and Lapenta2016), we will only recall it briefly here. The simulation is one-dimensional (we simulate the toroidal direction) and the plasma is homogeneous. Although the space is one-dimensional, the velocity phase is three-dimensional. Both drift velocity and perpendicular velocities are considered, because in tokamaks the magnetic field is strong, so the Lorenz force will push particles directionally and electrons also move in a perpendicular direction. The electric field and magnetic field are both in this direction. The electric field boundary condition is periodic and the toroidal magnetic field $B_{t}$
is fixed at 2.3 T, based on the DIII-D tokamak parameter. The collision reactions in this work include elastic scattering collisions, excitation and ionization collisions for electron–neutral collisions and charge exchange and elastic scattering collisions for ion–neutral collisions. Coulomb collisions are not included, but we have considered the ambipolar diffusion field self-consistently which results from the space charge separation.
$B_{t}$
is fixed at 2.3 T, based on the DIII-D tokamak parameter. The collision reactions in this work include elastic scattering collisions, excitation and ionization collisions for electron–neutral collisions and charge exchange and elastic scattering collisions for ion–neutral collisions. Coulomb collisions are not included, but we have considered the ambipolar diffusion field self-consistently which results from the space charge separation.
In our model, the poloidal transport and particle loss are neglected. This is because, during the breakdown phase, the parallel transport in the toroidal direction is much larger than that in the perpendicular direction. Also, the transport loss is dominant only after the electron temperature becomes high (which happens during the later burn-through phase and not during breakdown), which is also the case for the drift loss and error field loss (Hada et al.
Reference Hada, Nagasaki, Masuda, Kobayashi, Ide, Isayama and Kajiwara2015). Even during tokamak start-up by coaxial helicity injection (CHI) the average parallel velocity ( $\langle v_{\Vert }\rangle$
) driven by
$\langle v_{\Vert }\rangle$
) driven by $\boldsymbol{E}_{\Vert }$
is much larger than the
$\boldsymbol{E}_{\Vert }$
is much larger than the $\boldsymbol{E}\times \boldsymbol{B}$
drift motion (Hammond, Raman & Volpe Reference Hammond, Raman and Volpe2017). Perpendicular transport could be included by several methods even in a one-dimensional model. However, this would require us to introduce more assumptions and free parameters, such as particle confinement time and the diffusion coefficient, which will make our simulation results not fully self-consistent. The connection length
$\boldsymbol{E}\times \boldsymbol{B}$
drift motion (Hammond, Raman & Volpe Reference Hammond, Raman and Volpe2017). Perpendicular transport could be included by several methods even in a one-dimensional model. However, this would require us to introduce more assumptions and free parameters, such as particle confinement time and the diffusion coefficient, which will make our simulation results not fully self-consistent. The connection length $L$
, which is closely related to the stray field, has been assumed to be infinity. Therefore no convective particles or energy loss are included, as we have discussed in our last work (Jiang et al.
Reference Jiang, Peng, Zhang and Lapenta2016). Since the stray field varies shot by shot, this assumption can give an optimistic estimation.
$L$
, which is closely related to the stray field, has been assumed to be infinity. Therefore no convective particles or energy loss are included, as we have discussed in our last work (Jiang et al.
Reference Jiang, Peng, Zhang and Lapenta2016). Since the stray field varies shot by shot, this assumption can give an optimistic estimation.
The gas we use in our simulations is fully dissociated hydrogen, since the dissociation energy is smaller than the ionization threshold for the hydrogen atom. This assumption has been widely used and validated previously (Lloyd et al. Reference Lloyd, Carolan and Warrick1996; Kim et al. Reference Kim, Sips and Fundamenski2013b ). In our model we also neglect the impurities since we want to give the lower and upper limits of the initial parameters for plasma breakdown, considering an ideal condition. In a real tokamak, the successful breakdown parameters must be included in our limits. Also, if we want to examine a real plasma with impurities, the pure plasma must be studied first and this has been simulated in Kim et al. (Reference Kim, Sips and Fundamenski2013b ). We will consider the perpendicular transport and effects of impurities self-consistently in our future work by extending our simulation to the whole burn-through process.
The simulation box is 6.4 cm wide and uniformly divided into 32 cells. The time step is $4\times 10^{-10}$
s. Notice that in implicit PIC/MCC methods lower temporal and spatial resolution could in principle be used without affecting the stability of the simulation. However, in this particular case, we use sufficiently high resolutions (verified in previous work (yu Wang, Jiang & nian Wang Reference yu Wang, Jiang and nian Wang2010; Jiang et al.
Reference Jiang, yu Wang, hua Bi and nian Wang2011; Peng et al.
Reference Peng, Zhang, Mao, Yang, Hu and Jiang2018)) to be able to resolve the fast spatial and temporal oscillations of the ambipolar electric field. Semi-implicit, adaptive methods for kinetic plasma simulations have been developed to be able to self-consistently include higher resolution areas in low resolution domains (Innocenti et al.
Reference Innocenti, Lapenta, Markidis, Beck and Vapirev2013, Reference Innocenti, Beck, Ponweiser, Markidis and Lapenta2015) and will be used in the future for similar simulations. To make sure that the configuration we reach is stable, we run our simulations up to 25 ms, compatibly with experimental data. All the simulation results below are averaged over 1000 time steps to reduce data noise, with the exception of the ambipolar electric field, for which no averaging is done.
$4\times 10^{-10}$
s. Notice that in implicit PIC/MCC methods lower temporal and spatial resolution could in principle be used without affecting the stability of the simulation. However, in this particular case, we use sufficiently high resolutions (verified in previous work (yu Wang, Jiang & nian Wang Reference yu Wang, Jiang and nian Wang2010; Jiang et al.
Reference Jiang, yu Wang, hua Bi and nian Wang2011; Peng et al.
Reference Peng, Zhang, Mao, Yang, Hu and Jiang2018)) to be able to resolve the fast spatial and temporal oscillations of the ambipolar electric field. Semi-implicit, adaptive methods for kinetic plasma simulations have been developed to be able to self-consistently include higher resolution areas in low resolution domains (Innocenti et al.
Reference Innocenti, Lapenta, Markidis, Beck and Vapirev2013, Reference Innocenti, Beck, Ponweiser, Markidis and Lapenta2015) and will be used in the future for similar simulations. To make sure that the configuration we reach is stable, we run our simulations up to 25 ms, compatibly with experimental data. All the simulation results below are averaged over 1000 time steps to reduce data noise, with the exception of the ambipolar electric field, for which no averaging is done.
The two most important parameters in gas breakdown physics are the electric field and the pre-filling neutral pressure/density. The results are generally valid regardless the devices and short-to-short variations, as there are no free parameters at all in our model. Therefore, in this section, we will show the effects of pre-filling pressure and induced electric field on the tokamak breakdown process, respectively. The scanning range for the pre-filling pressure is $6.66\times 10^{-5}$
to
$6.66\times 10^{-5}$
to $6.66\times 10^{-2}$
Pa and the range for the induced electric field
$6.66\times 10^{-2}$
Pa and the range for the induced electric field $E_{\text{ind}}$
is 0.1 to
$E_{\text{ind}}$
is 0.1 to $2.0~\text{V}~\text{m}^{-1}$
, which corresponds to 1–20 V on DIII-D (the major radius is 1.67 m), which spans nearly all possible operational conditions for tokamaks.
$2.0~\text{V}~\text{m}^{-1}$
, which corresponds to 1–20 V on DIII-D (the major radius is 1.67 m), which spans nearly all possible operational conditions for tokamaks.
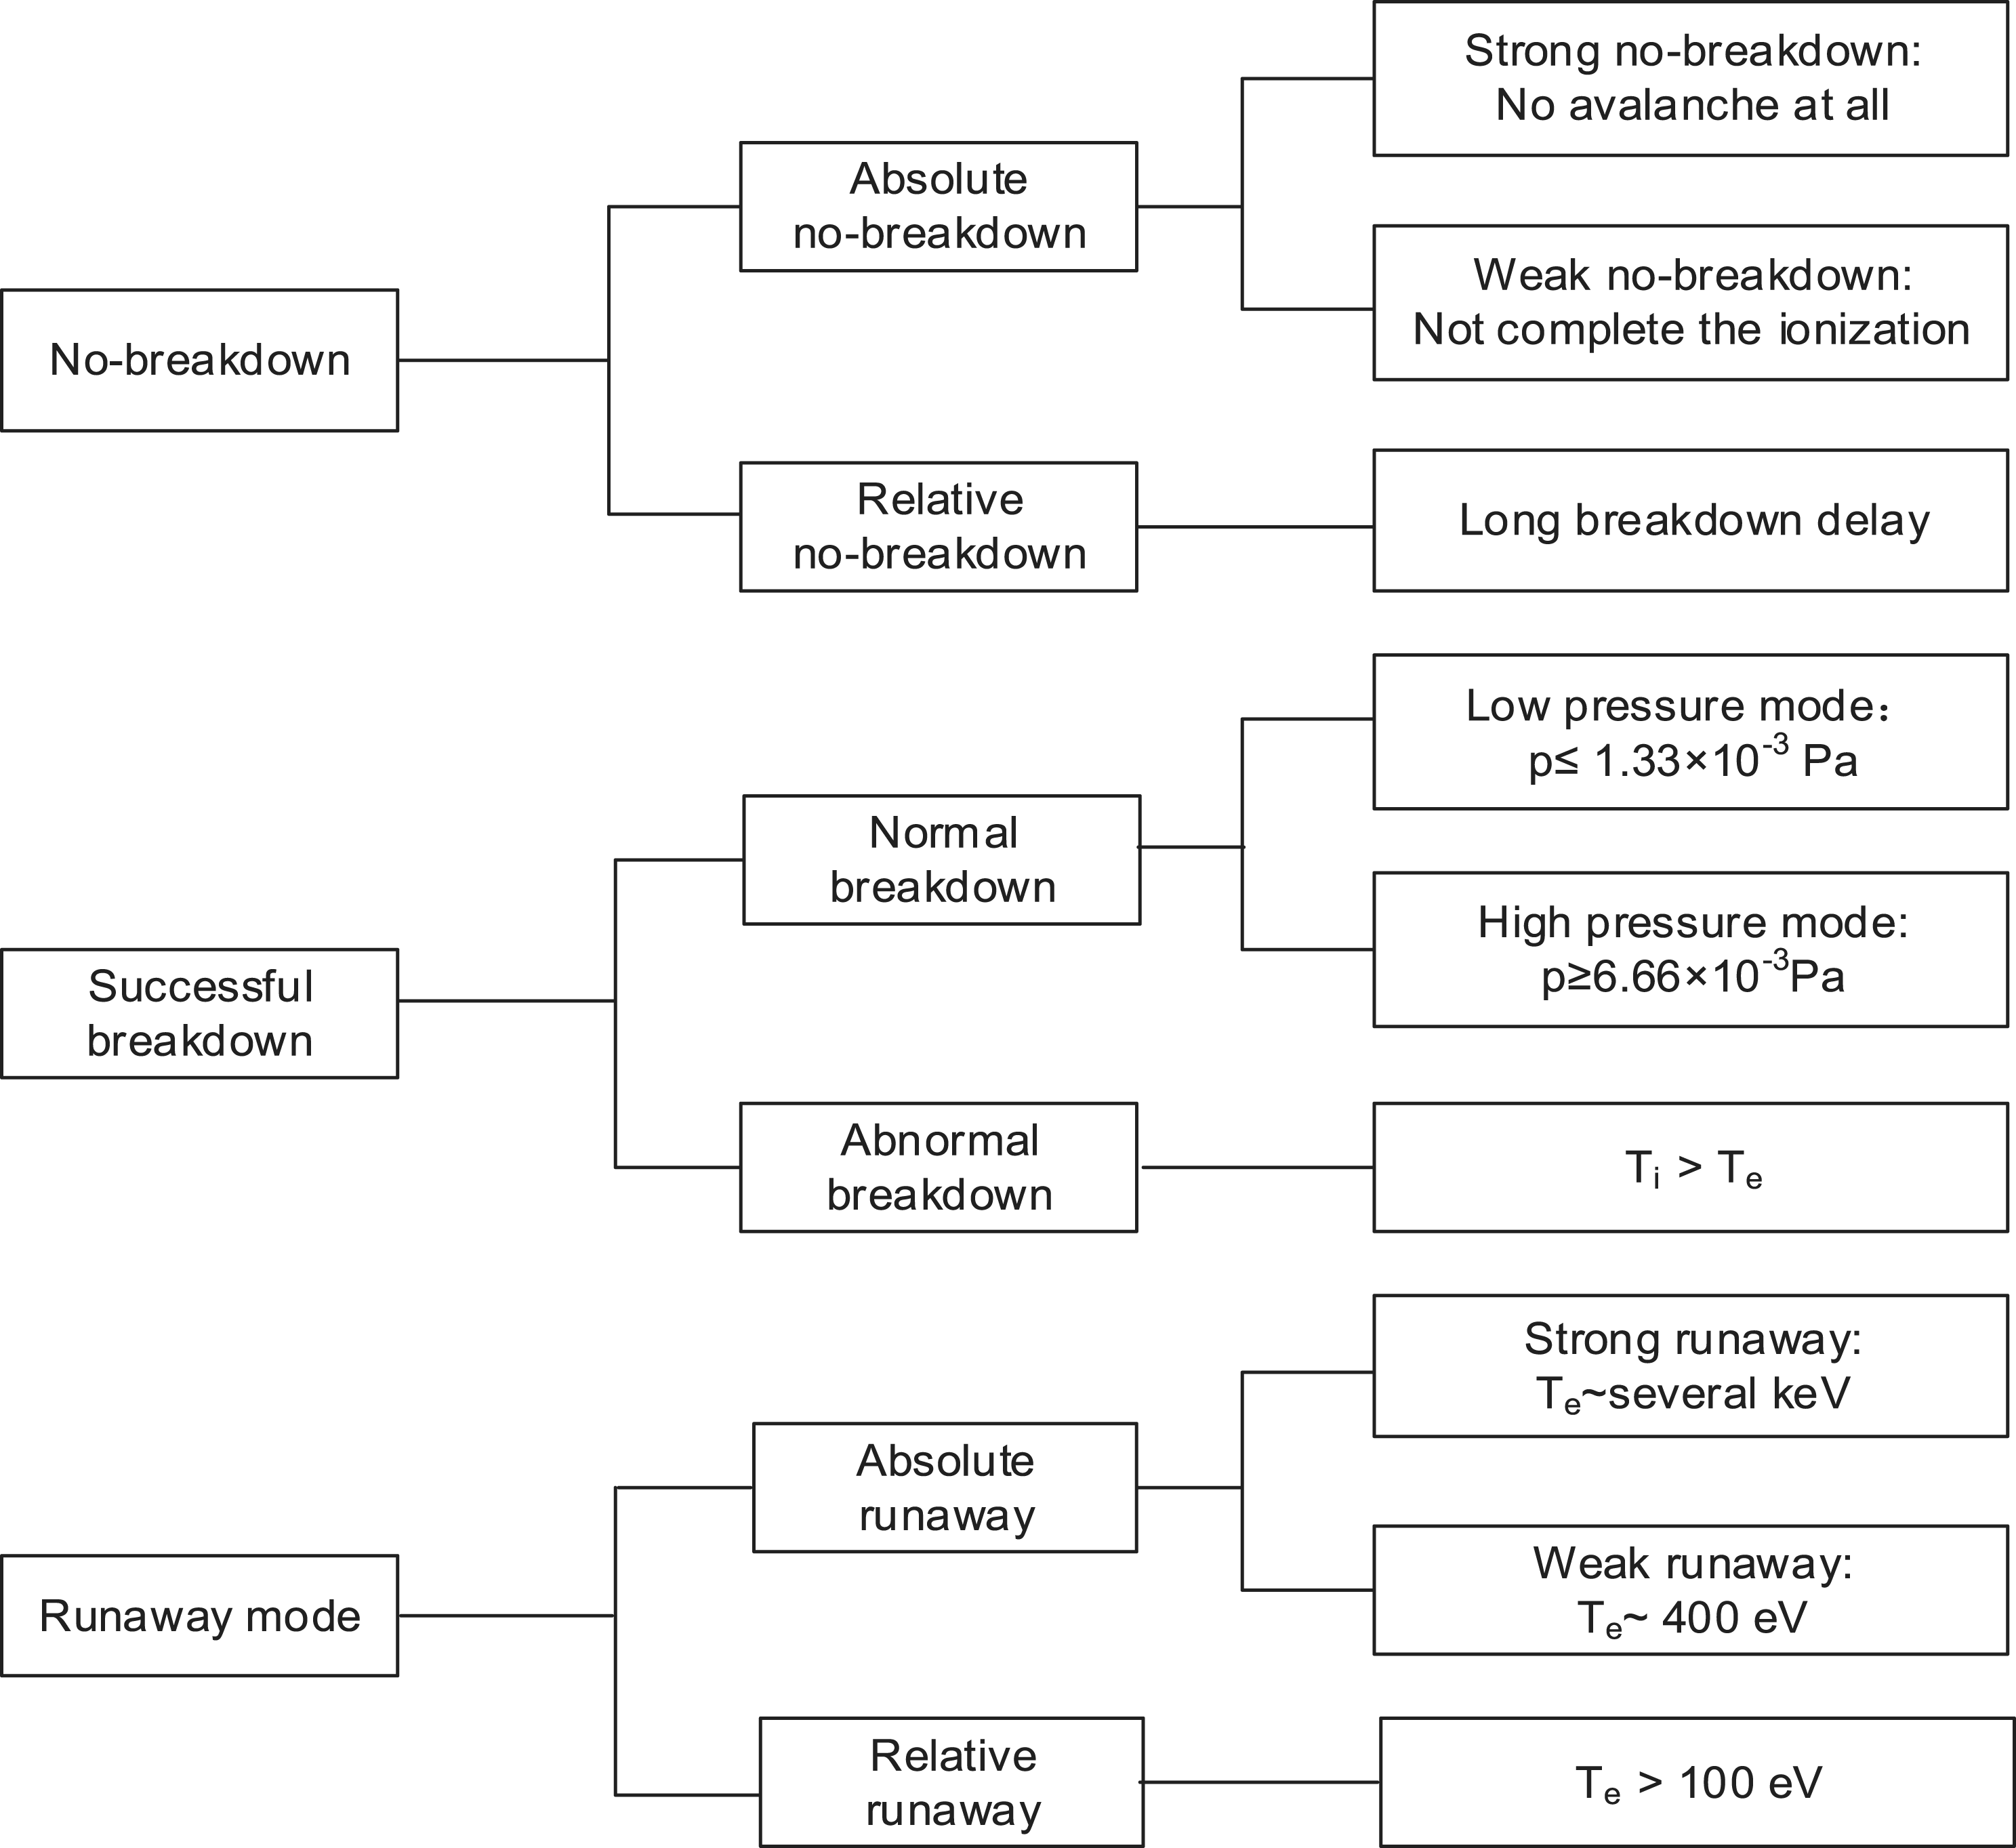
Figure 1. Sketch of the breakdown modes and respective sub-modes identified in the paper.
Before we discuss the simulation results specifically, we show a summary in figure 1 to better understand this work. Three breakdown modes are found and every mode has two sub-modes. As for the characteristics of three modes, we will discuss these in detail in § 3.
2.1 Influence of the pre-filling pressure
In figure 2(a,b) we show the time evolution of the electron and ion density with an induced electric field of $0.3~\text{V}~\text{m}^{-1}$
for different pressures; in figure 2(c,d) the induced electric field is
$0.3~\text{V}~\text{m}^{-1}$
for different pressures; in figure 2(c,d) the induced electric field is $1.0~\text{V}~\text{m}^{-1}$
. Note that here the evolution of the plasma density is a logarithmic plot.
$1.0~\text{V}~\text{m}^{-1}$
. Note that here the evolution of the plasma density is a logarithmic plot.
A breakdown is considered successful if full ionization is reached. This happens at $E=0.3~\text{V}~\text{m}^{-1}$
, with pre-filling pressures of
$E=0.3~\text{V}~\text{m}^{-1}$
, with pre-filling pressures of $6.66\times 10^{-4}$
Pa (blue dot),
$6.66\times 10^{-4}$
Pa (blue dot), $1.33\times 10^{-3}$
Pa (magenta dash dot) and
$1.33\times 10^{-3}$
Pa (magenta dash dot) and $6.66\times 10^{-3}$
Pa (olive dash dot dot). With lower pressures,
$6.66\times 10^{-3}$
Pa (olive dash dot dot). With lower pressures, $6.66\times 10^{-5}$
Pa (black solid) and
$6.66\times 10^{-5}$
Pa (black solid) and $1.33\times 10^{-4}$
Pa (red dash), full ionization is not reached. With higher pressures,
$1.33\times 10^{-4}$
Pa (red dash), full ionization is not reached. With higher pressures, $1.33\times 10^{-2}$
Pa (green short dash),
$1.33\times 10^{-2}$
Pa (green short dash), $6.66\times 10^{-2}$
Pa (cyan short dot), ionization is still in progress at the end of the simulation: breakdown, if achieved at all, happens on time scales too large for successful operation. Successful breakdown is achieved at
$6.66\times 10^{-2}$
Pa (cyan short dot), ionization is still in progress at the end of the simulation: breakdown, if achieved at all, happens on time scales too large for successful operation. Successful breakdown is achieved at $E=1~\text{V}~\text{m}^{-1}$
with all pre-filling pressures but the lower ones,
$E=1~\text{V}~\text{m}^{-1}$
with all pre-filling pressures but the lower ones, $6.66\times 10^{-5}$
Pa (black solid),
$6.66\times 10^{-5}$
Pa (black solid), $1.33\times 10^{-4}$
Pa (red dash). In these cases, electron and ion density soon goes to 0 because runaway electrons occur. From figure 2 one can see that under most pressures, both the electron and ion density increase exponentially at the start of the discharge. This indicates that the avalanche breakdown is produced similarly to Townsend discharge. In addition, the trends of the time evolution of ion and electron density are the same, keeping electrical neutrality, no matter what the induced electric field is.
$1.33\times 10^{-4}$
Pa (red dash). In these cases, electron and ion density soon goes to 0 because runaway electrons occur. From figure 2 one can see that under most pressures, both the electron and ion density increase exponentially at the start of the discharge. This indicates that the avalanche breakdown is produced similarly to Townsend discharge. In addition, the trends of the time evolution of ion and electron density are the same, keeping electrical neutrality, no matter what the induced electric field is.
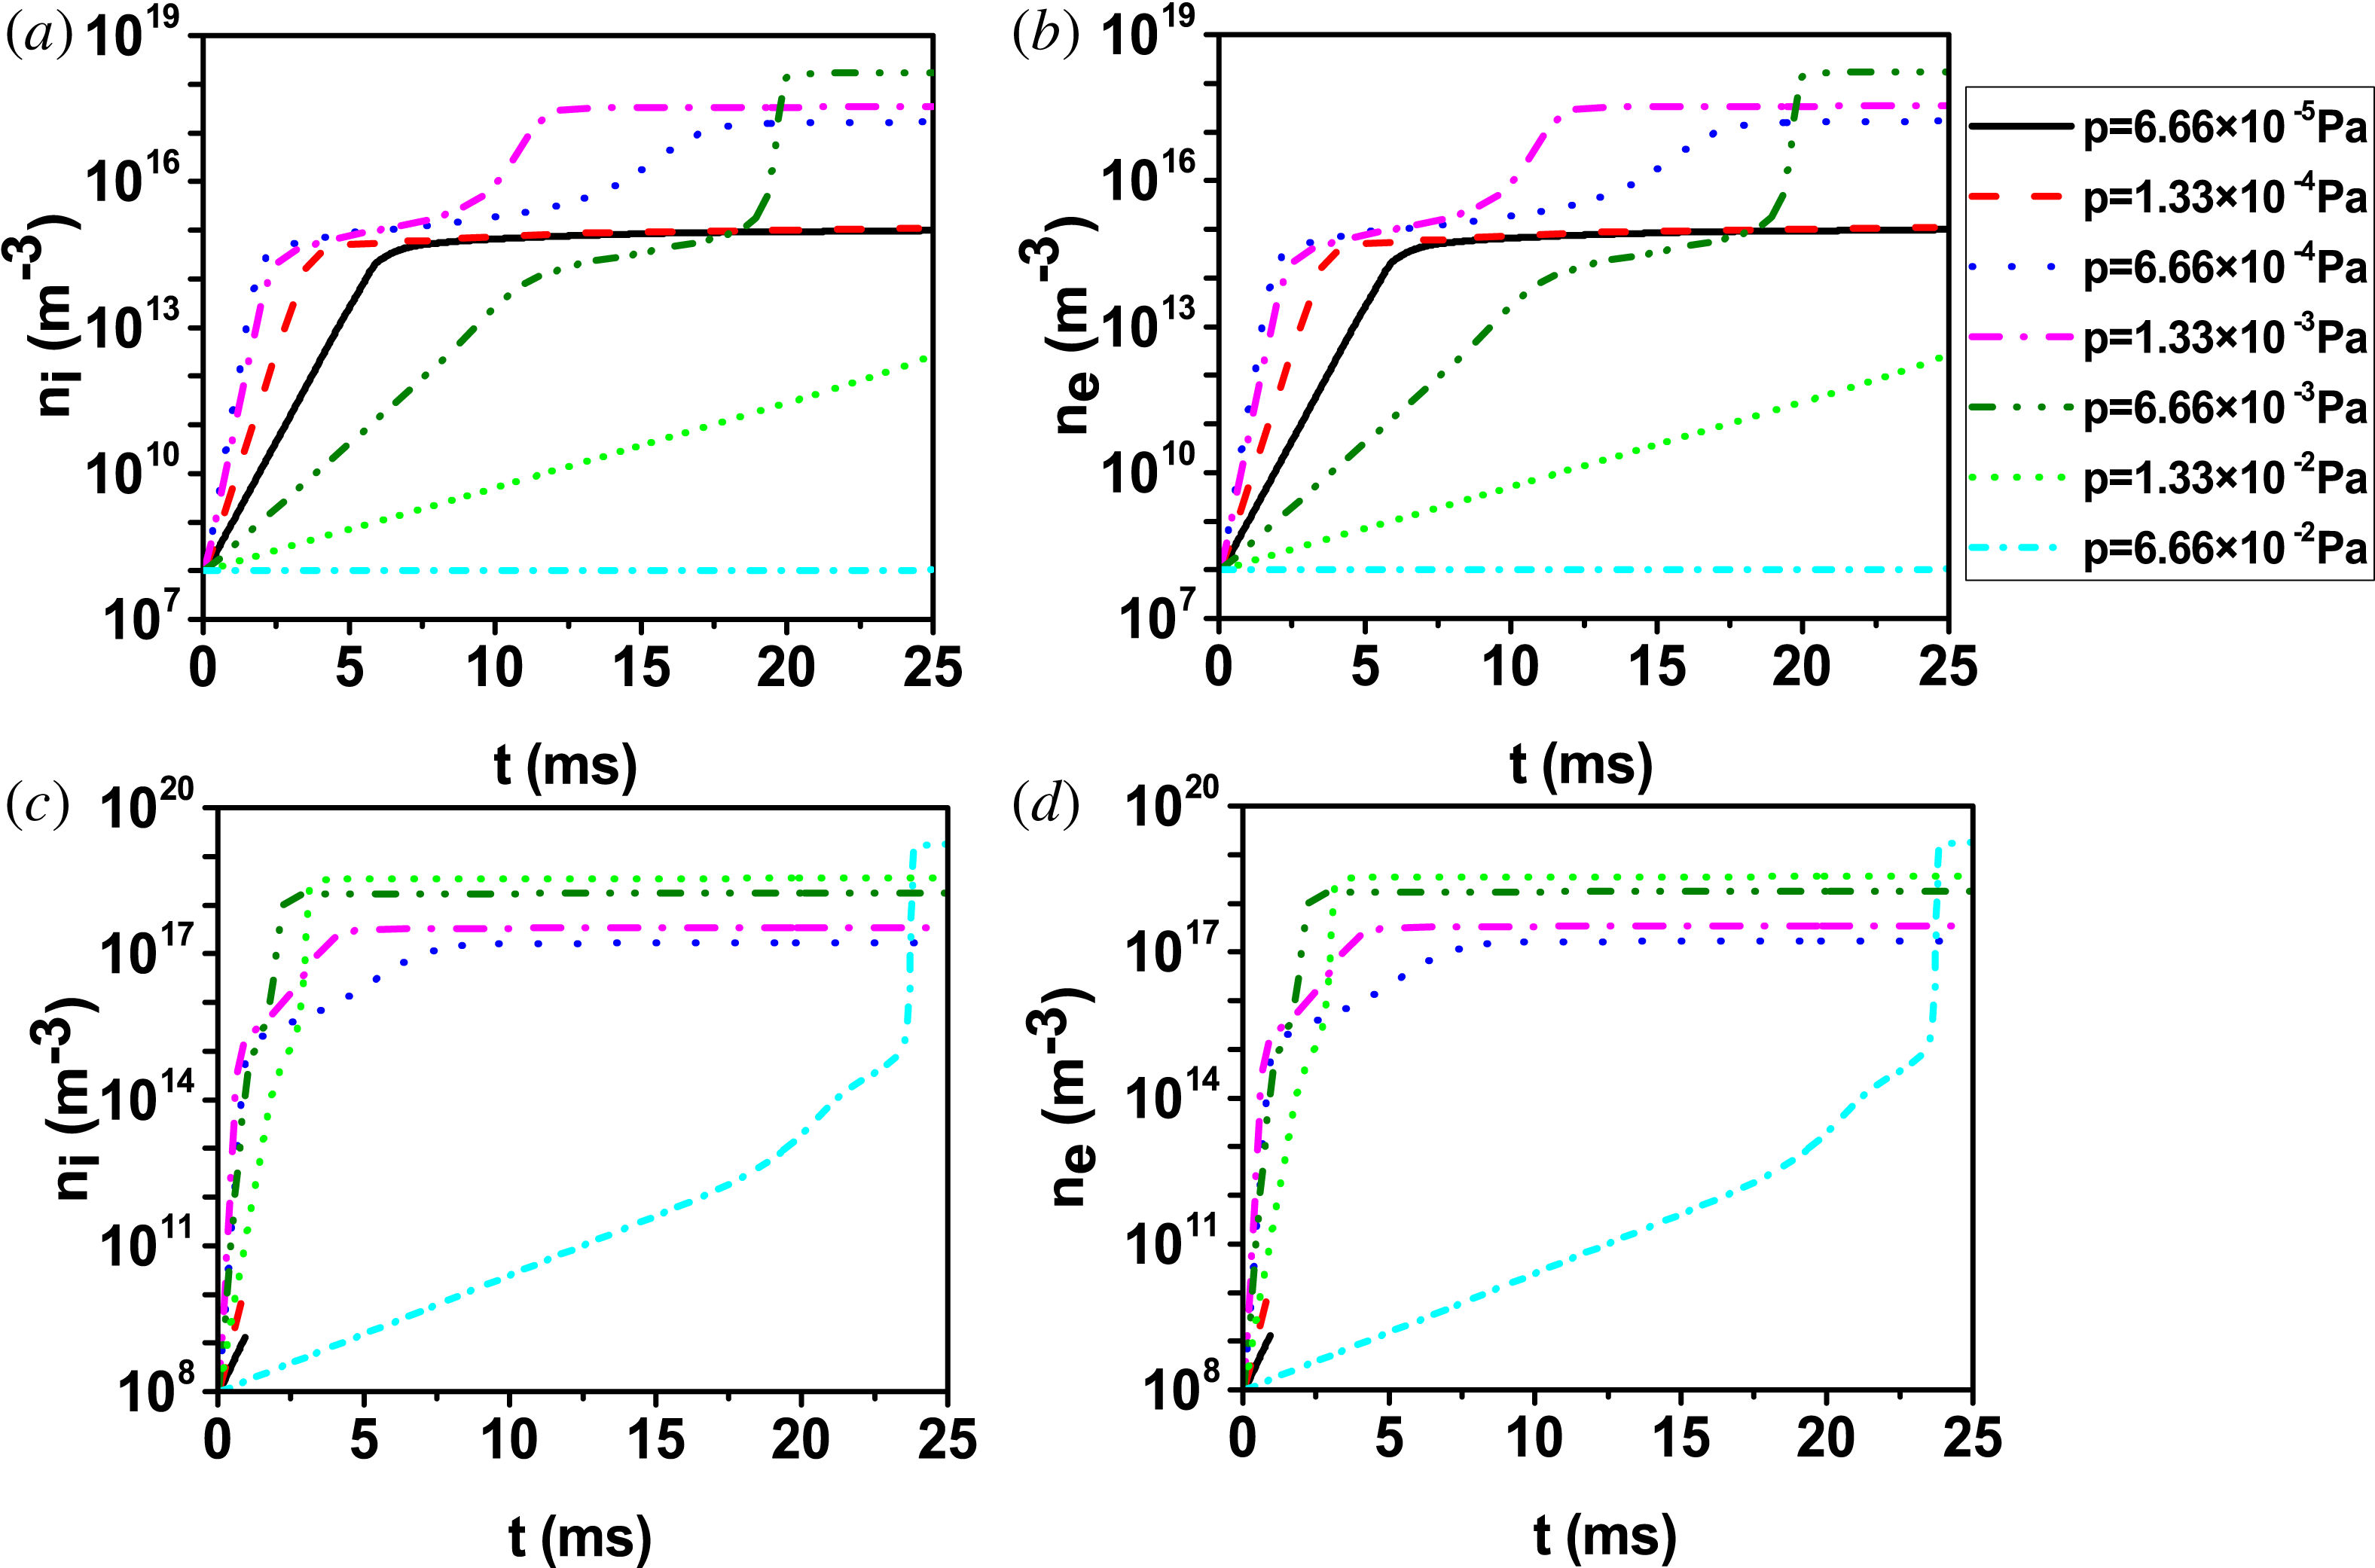
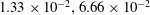
Figure 2. Time evolution of (a) ion density, (b) electron density at $E=0.3~\text{V}~\text{m}^{-1}$
and (c) ion density, (d) electron density at
$E=0.3~\text{V}~\text{m}^{-1}$
and (c) ion density, (d) electron density at $E=1.0~\text{V}~\text{m}^{-1}$
for different pre-filling pressures. The
$E=1.0~\text{V}~\text{m}^{-1}$
for different pre-filling pressures. The $y$
-axis used in the plot is logarithmic. The black solid line is terminated in (c,d) when runaway electrons (REs) are formed. The case
$y$
-axis used in the plot is logarithmic. The black solid line is terminated in (c,d) when runaway electrons (REs) are formed. The case $E=0.3~\text{V}~\text{m}^{-1}$
,
$E=0.3~\text{V}~\text{m}^{-1}$
, $p=1.33\times 10^{-3}$
Pa will be further analysed in § 3.2 as an example of successful breakdown mode. The case
$p=1.33\times 10^{-3}$
Pa will be further analysed in § 3.2 as an example of successful breakdown mode. The case $E=1~\text{V}~\text{m}^{-1}$
,
$E=1~\text{V}~\text{m}^{-1}$
, $p=6.66\times 10^{-2}$
Pa will be further analysed as an example of a relative no-breakdown mode in § 3.1.
$p=6.66\times 10^{-2}$
Pa will be further analysed as an example of a relative no-breakdown mode in § 3.1.
One can notice that full ionization is achieved through a three-stage process at $E=0.3~\text{V}~\text{m}^{-1}$
, a two-stage process at
$E=0.3~\text{V}~\text{m}^{-1}$
, a two-stage process at $E=1~\text{V}~\text{m}^{-1}$
. As we have reported in Jiang et al. (Reference Jiang, Peng, Zhang and Lapenta2016), one can distinguish three phases in a successful breakdown at low induced electric field. When the electric field is
$E=1~\text{V}~\text{m}^{-1}$
. As we have reported in Jiang et al. (Reference Jiang, Peng, Zhang and Lapenta2016), one can distinguish three phases in a successful breakdown at low induced electric field. When the electric field is $1.0~\text{V}~\text{m}^{-1}$
, in some cases (
$1.0~\text{V}~\text{m}^{-1}$
, in some cases ( $p=6.66\times 10^{-3},1.33\times 10^{-2},6.66\times 10^{-2}$
Pa) the ionization rate in the third stage is larger than in the first stage while in other cases (
$p=6.66\times 10^{-3},1.33\times 10^{-2},6.66\times 10^{-2}$
Pa) the ionization rate in the third stage is larger than in the first stage while in other cases ( $p=6.66\times 10^{-4},1.33\times 10^{-3}$
Pa) not. The reason for this will be further discussed when describing the average ion and electron energies in figure 4.
$p=6.66\times 10^{-4},1.33\times 10^{-3}$
Pa) not. The reason for this will be further discussed when describing the average ion and electron energies in figure 4.
Comparing figure 2(a,b) to figure 2(c,d), we can clearly find that the establishment of initial ionization is relatively slow under the lower induced electric field. This is because the higher the induced electric field is, the higher the energy the electrons obtain from ohmic heating is and then the more ionization collisions happen. In addition, in figure 2(c,d), the breakdown of neutrals is successful when the pre-filling pressures are $1.33\times 10^{-2}$
and
$1.33\times 10^{-2}$
and $6.66\times 10^{-2}$
Pa, respectively. Instead, the breakdown fails at these same two pressures when the induced electric field is
$6.66\times 10^{-2}$
Pa, respectively. Instead, the breakdown fails at these same two pressures when the induced electric field is $0.3~\text{V}~\text{m}^{-1}$
(see figure 2
a,b). Therefore we can see that when the pre-filling pressure is very high, the induced electric field needed to achieve the breakdown is much higher. The reason is that in a high pre-filling pressure regime, more collisions between the electrons previously generated and neutrals take place, thus reducing the energy of the electrons and making it more difficult to ionize the neutral gas. Therefore, electrons require a larger induced electric field to acquire sufficient energy to ionize the gas. Furthermore, at
$0.3~\text{V}~\text{m}^{-1}$
(see figure 2
a,b). Therefore we can see that when the pre-filling pressure is very high, the induced electric field needed to achieve the breakdown is much higher. The reason is that in a high pre-filling pressure regime, more collisions between the electrons previously generated and neutrals take place, thus reducing the energy of the electrons and making it more difficult to ionize the neutral gas. Therefore, electrons require a larger induced electric field to acquire sufficient energy to ionize the gas. Furthermore, at $1~\text{V}~\text{m}^{-1}$
, when the pre-filling pressure is
$1~\text{V}~\text{m}^{-1}$
, when the pre-filling pressure is $6.66\times 10^{-2}$
Pa, breakdown is achieved but it is delayed greatly. For this reason, high pre-filling pressure is not advisable in real tokamaks. If much more time is needed for breakdown, a lot of volt-seconds will be wasted. We can also see that the electron density quickly become 0 for the low pre-filling pressure cases (
$6.66\times 10^{-2}$
Pa, breakdown is achieved but it is delayed greatly. For this reason, high pre-filling pressure is not advisable in real tokamaks. If much more time is needed for breakdown, a lot of volt-seconds will be wasted. We can also see that the electron density quickly become 0 for the low pre-filling pressure cases ( $6.66\times 10^{-5},1.33\times 10^{-4}$
Pa) because of the generation of runaway electrons, which will be discussed in detail below. Regardless of the electric field, for the successful breakdown, the largest ionization rate during the fast avalanche stage is obtained under a moderated pre-filling pressure and at the end of breakdown the density scales with the pre-filling pressure, which is consistent with the experimental data in JET (de Vries et al.
Reference de Vries, Sips, Kim, Lomas, Maviglia, Albanese, Coffey, Joffrin, Lehnen and Manzanares2013).
$6.66\times 10^{-5},1.33\times 10^{-4}$
Pa) because of the generation of runaway electrons, which will be discussed in detail below. Regardless of the electric field, for the successful breakdown, the largest ionization rate during the fast avalanche stage is obtained under a moderated pre-filling pressure and at the end of breakdown the density scales with the pre-filling pressure, which is consistent with the experimental data in JET (de Vries et al.
Reference de Vries, Sips, Kim, Lomas, Maviglia, Albanese, Coffey, Joffrin, Lehnen and Manzanares2013).
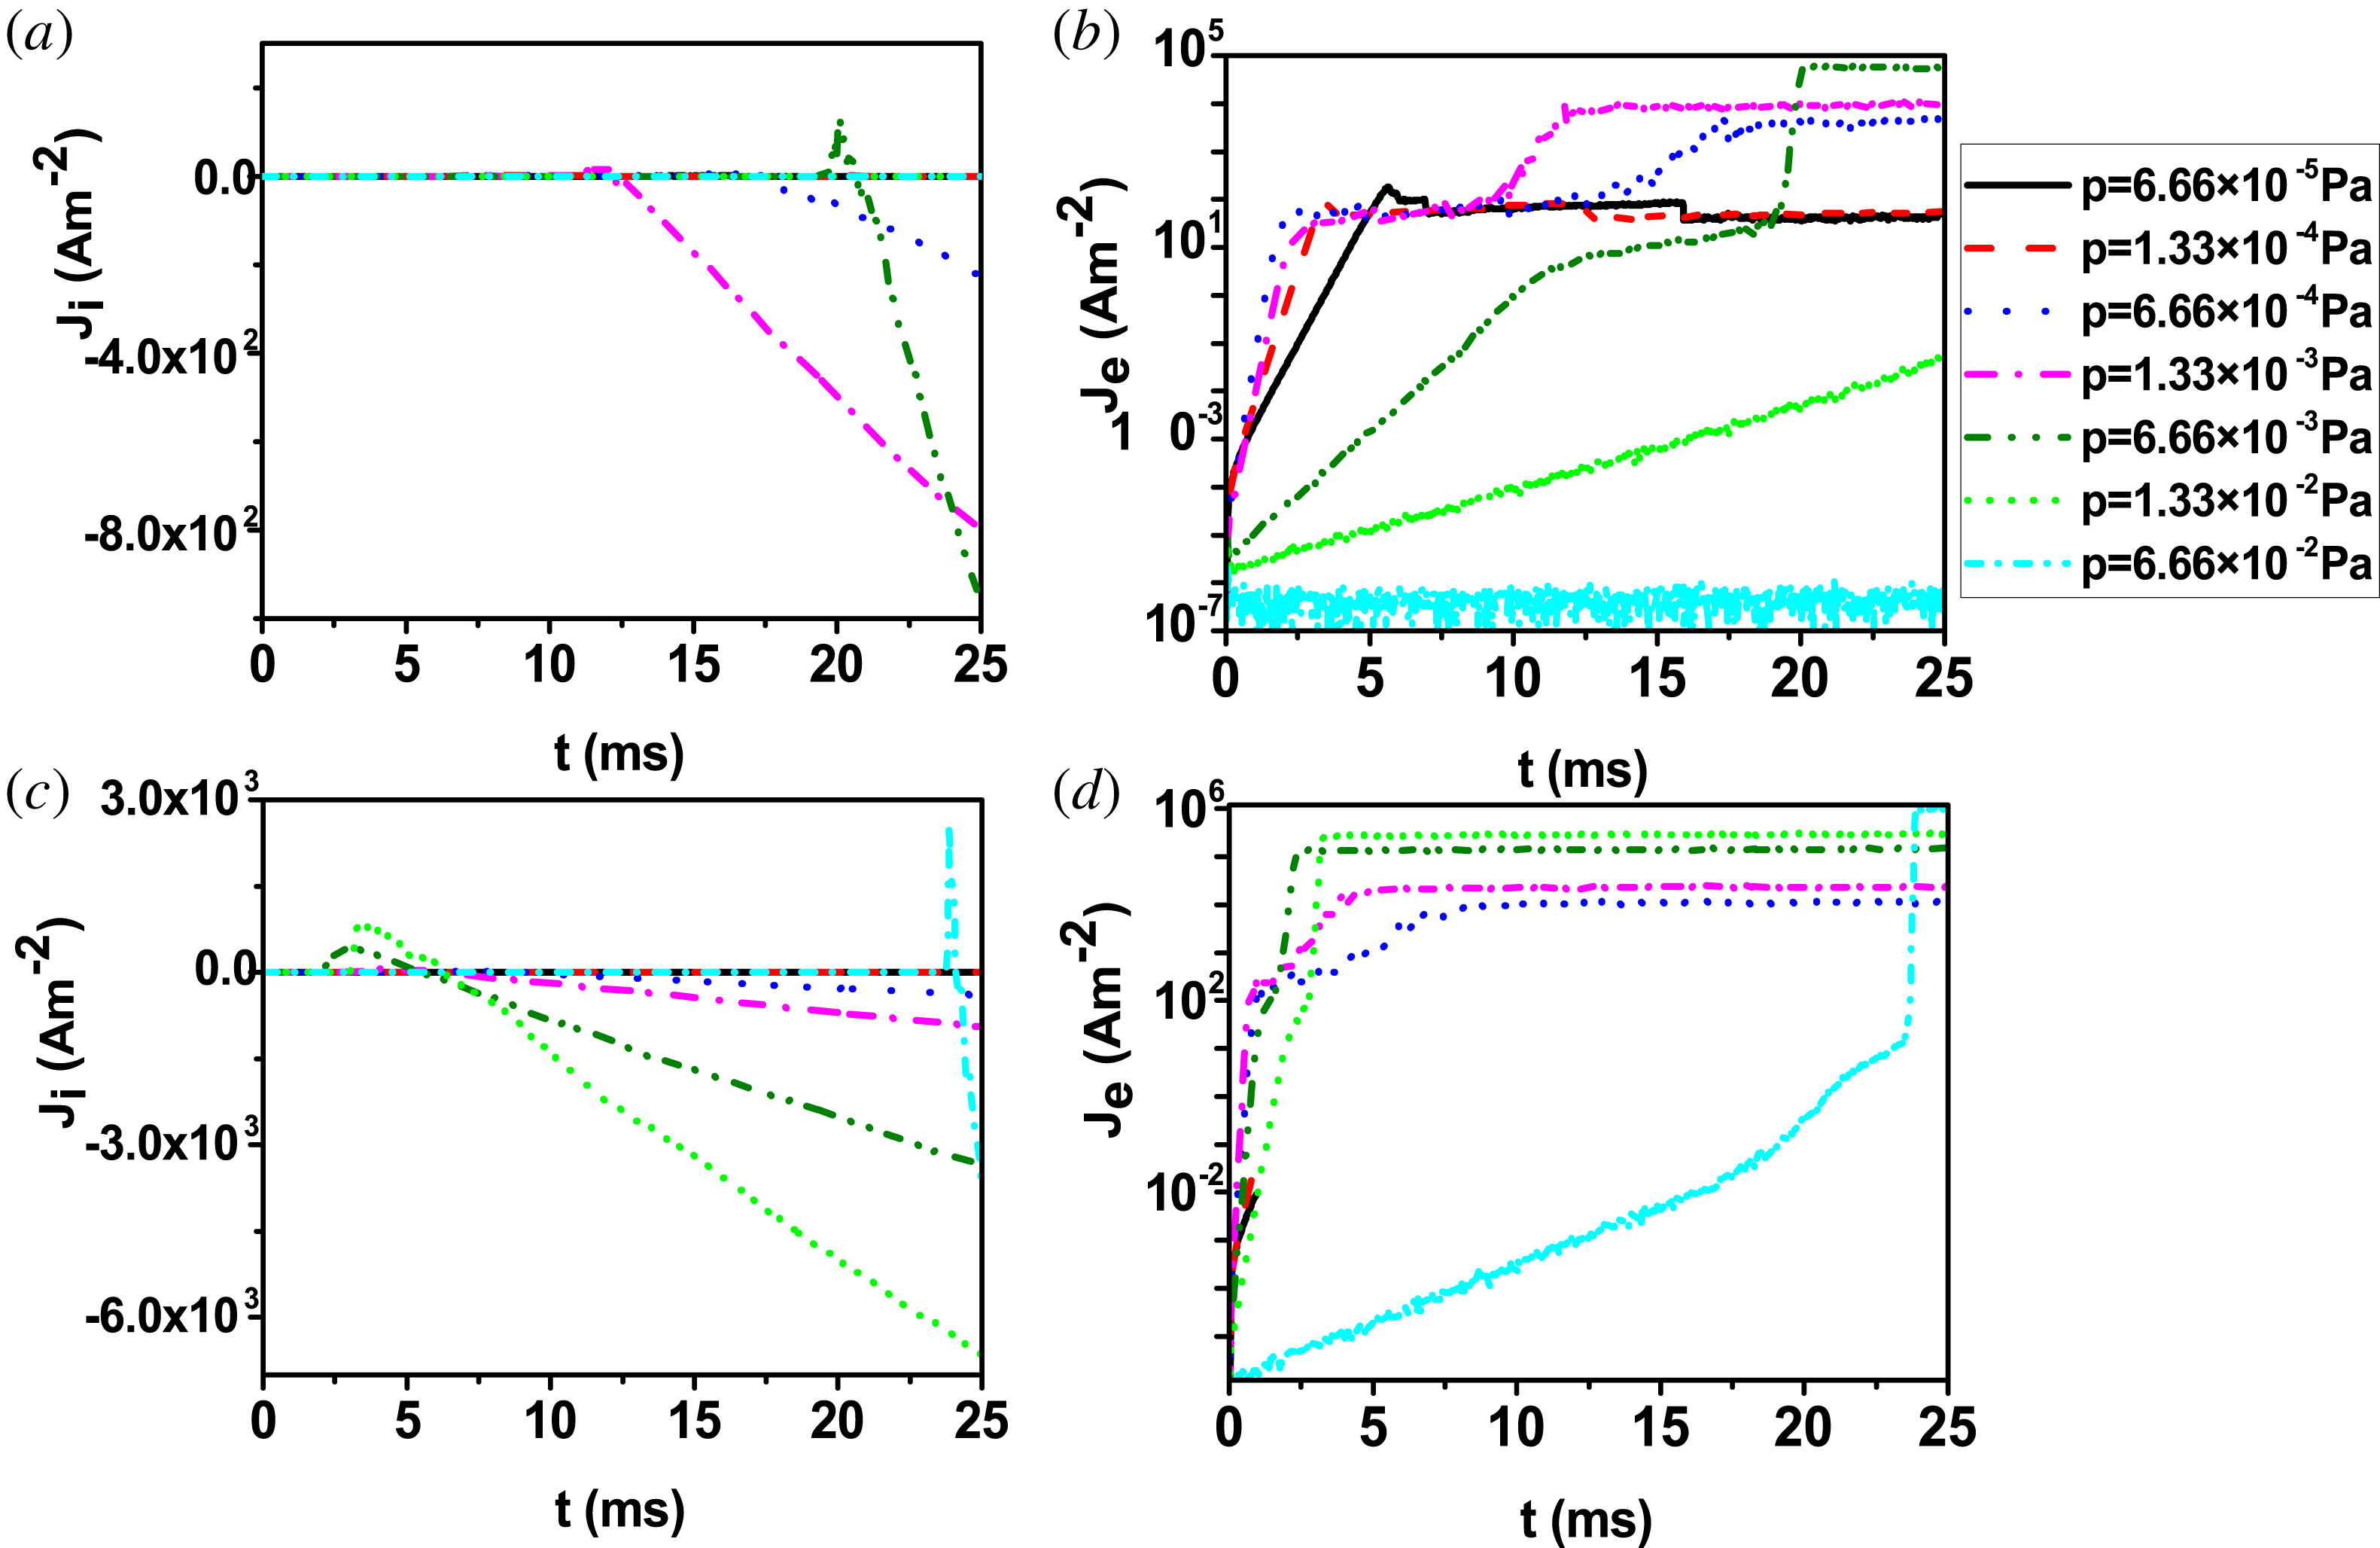
Figure 3. Time evolution of (a) ion current density, (b) electron current density at $E=0.3~\text{V}~\text{m}^{-1}$
and (c) ion current density, (d) electron current density at
$E=0.3~\text{V}~\text{m}^{-1}$
and (c) ion current density, (d) electron current density at $E=1.0~\text{V}~\text{m}^{-1}$
for different pre-filling pressures.
$E=1.0~\text{V}~\text{m}^{-1}$
for different pre-filling pressures.
Figure 3(a,b) shows the time evolution of the ion and electron current densities under an electric field of $0.3~\text{V}~\text{m}^{-1}$
for the same pre-filling pressures as figure 2. We can see that the trend of the electron current evolution is similar to that of the electron density, while that of the ion current is not. Moreover, the electron current is always positive, while the ion current changes from 0 to a positive value and then becomes negative and later increases linearly in absolute value in some cases (
$0.3~\text{V}~\text{m}^{-1}$
for the same pre-filling pressures as figure 2. We can see that the trend of the electron current evolution is similar to that of the electron density, while that of the ion current is not. Moreover, the electron current is always positive, while the ion current changes from 0 to a positive value and then becomes negative and later increases linearly in absolute value in some cases ( $6.66\times 10^{-4}$
Pa (blue dot),
$6.66\times 10^{-4}$
Pa (blue dot), $1.33\times 10^{-3}$
Pa (magenta dash dot),
$1.33\times 10^{-3}$
Pa (magenta dash dot), $6.66\times 10^{-3}$
Pa (olive dash dot dot)). This can be explained by the fact that, in the beginning, the plasma density is low, so both of ions and electrons are accelerated by the induced electric field. Ions and electrons move in different directions, so the sign of their respective currents is the same. Later, with the discharge proceeding, the plasma density increases. An ambipolar field is established, and ions are dragged to move together with electrons since electrons move much faster than ions, so the ion current density becomes negative. In addition from the current density evolution we can see that the total momentum is not conservative because the discharge is driven by external ohmic heating. The electron current density is much higher than the ion current density, which means that the current is mainly carried by the electrons, so the total momentum is negative because the electron velocity is opposite to the induced electric field. The electron current density increases very slowly once the neutral gas is nearly ionized fully which is same as the electron density trend since there is no recycling and source rate from the wall.
$6.66\times 10^{-3}$
Pa (olive dash dot dot)). This can be explained by the fact that, in the beginning, the plasma density is low, so both of ions and electrons are accelerated by the induced electric field. Ions and electrons move in different directions, so the sign of their respective currents is the same. Later, with the discharge proceeding, the plasma density increases. An ambipolar field is established, and ions are dragged to move together with electrons since electrons move much faster than ions, so the ion current density becomes negative. In addition from the current density evolution we can see that the total momentum is not conservative because the discharge is driven by external ohmic heating. The electron current density is much higher than the ion current density, which means that the current is mainly carried by the electrons, so the total momentum is negative because the electron velocity is opposite to the induced electric field. The electron current density increases very slowly once the neutral gas is nearly ionized fully which is same as the electron density trend since there is no recycling and source rate from the wall.
Notice from figure 3(a,b) that, at $E=0.3~\text{V}~\text{m}^{-1}$
, when the pressure is very high (
$E=0.3~\text{V}~\text{m}^{-1}$
, when the pressure is very high ( $1.33\times 10^{-2},6.66\times 10^{-2}$
Pa) the ion current is nearly zero and the electron current is also very small. These are the cases in which breakdown is not achieved, because the electrons are difficult to energize and hence cannot be generated sufficiently. When the electric field is
$1.33\times 10^{-2},6.66\times 10^{-2}$
Pa) the ion current is nearly zero and the electron current is also very small. These are the cases in which breakdown is not achieved, because the electrons are difficult to energize and hence cannot be generated sufficiently. When the electric field is $0.3~\text{V}~\text{m}^{-1}$
with a pressure of
$0.3~\text{V}~\text{m}^{-1}$
with a pressure of $6.66\times 10^{-3}$
Pa, the electron current density is approximately
$6.66\times 10^{-3}$
Pa, the electron current density is approximately $6\times 10^{4}~\text{A}~\text{m}^{-2}$
. This value is in good agreement with Lloyd’s theoretical calculation of
$6\times 10^{4}~\text{A}~\text{m}^{-2}$
. This value is in good agreement with Lloyd’s theoretical calculation of $66~\text{kA}~\text{m}^{-2}$
in Lloyd et al. (Reference Lloyd, Jackson, Taylor, Lazarus, Luce and Prater1991). Figure 3(c,d) shows the time evolution of the ion and electron current densities under an electric field of
$66~\text{kA}~\text{m}^{-2}$
in Lloyd et al. (Reference Lloyd, Jackson, Taylor, Lazarus, Luce and Prater1991). Figure 3(c,d) shows the time evolution of the ion and electron current densities under an electric field of $1.0~\text{V}~\text{m}^{-1}$
for the same pre-filling pressures as before. We can see that when the pre-filling pressure is the same, the current density is higher than that in the low electric field case of figure 3(a,b). This is true especially for the electron current density, because the higher electric field prompts the discharge and electrons can thus be accelerated more efficiently. Notice that, at high
$1.0~\text{V}~\text{m}^{-1}$
for the same pre-filling pressures as before. We can see that when the pre-filling pressure is the same, the current density is higher than that in the low electric field case of figure 3(a,b). This is true especially for the electron current density, because the higher electric field prompts the discharge and electrons can thus be accelerated more efficiently. Notice that, at high $E$
, in high pre-filling pressure regimes, for example,
$E$
, in high pre-filling pressure regimes, for example, $1.33\times 10^{-2}$
,
$1.33\times 10^{-2}$
, $6.66\times 10^{-2}$
Pa, the electron current densities are also high. The breakdown can be achieved successfully under such high pre-filling pressures due to the sufficiently high induced electric field.
$6.66\times 10^{-2}$
Pa, the electron current densities are also high. The breakdown can be achieved successfully under such high pre-filling pressures due to the sufficiently high induced electric field.
Figure 4. Time evolution of (a) ion energy, (b) electron energy at $E=0.3~\text{V}~\text{m}^{-1}$
and (c) ion energy, (d) electron energy at
$E=0.3~\text{V}~\text{m}^{-1}$
and (c) ion energy, (d) electron energy at $E=1.0~\text{V}~\text{m}^{-1}$
for different pre-filling pressures. The figure is a logarithmic plot. The case
$E=1.0~\text{V}~\text{m}^{-1}$
for different pre-filling pressures. The figure is a logarithmic plot. The case $E=1~\text{V}~\text{m}^{-1}$
,
$E=1~\text{V}~\text{m}^{-1}$
, $p=1.33\times 10^{-4}$
Pa, the case
$p=1.33\times 10^{-4}$
Pa, the case $E=0.3~\text{V}~\text{m}^{-1}$
,
$E=0.3~\text{V}~\text{m}^{-1}$
, $p=1.33\times 10^{-4}$
Pa and the case
$p=1.33\times 10^{-4}$
Pa and the case $E=1~\text{V}~\text{m}^{-1}$
,
$E=1~\text{V}~\text{m}^{-1}$
, $p=6.66\times 10^{-4}$
Pa will be further analysed in § 3.3 as an example of a strong runaway mode, weak runaway mode and relative runaway mode, respectively.
$p=6.66\times 10^{-4}$
Pa will be further analysed in § 3.3 as an example of a strong runaway mode, weak runaway mode and relative runaway mode, respectively.
Figure 4(a,b) presents the time evolution of the average ion and electron energy for different pressures when the electric field is $0.3~\text{V}~\text{m}^{-1}$
. From these two figures we can see that the ion energy keeps increasing for all the cases considered (with the notable exception of the case with filling pressure
$0.3~\text{V}~\text{m}^{-1}$
. From these two figures we can see that the ion energy keeps increasing for all the cases considered (with the notable exception of the case with filling pressure $6.66\times 10^{-5}$
Pa), while the electron energy rises in the beginning, then decreases and later rises again to a value less than 10 eV. It then remains constant for some time. The physical explanation for this is that ions are always heated, while electrons in the beginning are mainly accelerated by the induced electric field, so their energy rises quickly. However, as electrons are accelerated, various collisions happen, such as inelastic collisions, radiation collisions and ionization collisions, leading to electron energy loss. On the other hand, the
$6.66\times 10^{-5}$
Pa), while the electron energy rises in the beginning, then decreases and later rises again to a value less than 10 eV. It then remains constant for some time. The physical explanation for this is that ions are always heated, while electrons in the beginning are mainly accelerated by the induced electric field, so their energy rises quickly. However, as electrons are accelerated, various collisions happen, such as inelastic collisions, radiation collisions and ionization collisions, leading to electron energy loss. On the other hand, the $E_{\text{ambi}}$
takes effect as the plasma density increases, part of the electron energy is transferred to ions, so the electron energy decreases. We indicate with
$E_{\text{ambi}}$
takes effect as the plasma density increases, part of the electron energy is transferred to ions, so the electron energy decreases. We indicate with $P_{\text{equi}}$
the energy transferred from the electrons to the ions through the ambipolar electric field. The neutrals are thus fully ionized, collisions decrease, which prompts the energy to increase again. Furthermore, it can also be seen that the lower the pressure is, the higher the electron maximum energy value is, which confirms that superthermal electrons are easy to produce under a low pre-filling pressure. In fact, when the pre-filling pressures are
$P_{\text{equi}}$
the energy transferred from the electrons to the ions through the ambipolar electric field. The neutrals are thus fully ionized, collisions decrease, which prompts the energy to increase again. Furthermore, it can also be seen that the lower the pressure is, the higher the electron maximum energy value is, which confirms that superthermal electrons are easy to produce under a low pre-filling pressure. In fact, when the pre-filling pressures are $6.66\times 10^{-5}$
,
$6.66\times 10^{-5}$
, $1.33\times 10^{-4}$
Pa, runaway electrons may be generated because the average energy is high. Instead, when the pressure is very high, both the electron and ion energy are quite low because of frequent collisions such as radiation and ionization collisions. In addition, the number of electrons that need to be heated increases, so more energy is needed to heat electrons.
$1.33\times 10^{-4}$
Pa, runaway electrons may be generated because the average energy is high. Instead, when the pressure is very high, both the electron and ion energy are quite low because of frequent collisions such as radiation and ionization collisions. In addition, the number of electrons that need to be heated increases, so more energy is needed to heat electrons.
We also show the time evolution of the average ion and electron energy when the induced electric field is $1.0~\text{V}~\text{m}^{-1}$
for different pre-filling pressures in figure 4(c,d). Comparing figure 4(c,d) and figure 4(a,b), we can clearly see that the ion energy increases much faster during the first avalanche phase and that at the end of the breakdown the average energies are higher for the successful breakdown cases with an electric field of
$1.0~\text{V}~\text{m}^{-1}$
for different pre-filling pressures in figure 4(c,d). Comparing figure 4(c,d) and figure 4(a,b), we can clearly see that the ion energy increases much faster during the first avalanche phase and that at the end of the breakdown the average energies are higher for the successful breakdown cases with an electric field of $1.0~\text{V}~\text{m}^{-1}$
. One can see that with the pressure of
$1.0~\text{V}~\text{m}^{-1}$
. One can see that with the pressure of $p=6.66\times 10^{-3},1.33\times 10^{-2},6.66\times 10^{-2}$
Pa, the final average ion energy is higher than that of the electrons, while in the other two cases (
$p=6.66\times 10^{-3},1.33\times 10^{-2},6.66\times 10^{-2}$
Pa, the final average ion energy is higher than that of the electrons, while in the other two cases ( $p=6.66\times 10^{-4},1.33\times 10^{-3}$
Pa) not. We suppose that is one of reasons why the ionization rate in the third stage is larger than in the first stage. Since ion energies are mainly transferred from electrons by
$p=6.66\times 10^{-4},1.33\times 10^{-3}$
Pa) not. We suppose that is one of reasons why the ionization rate in the third stage is larger than in the first stage. Since ion energies are mainly transferred from electrons by $P_{\text{equ}}$
and the average ion energy is higher than that of the electrons, so the electron thermalization degree is higher than that in the first avalanche stage. The cooling effect on the electrons by
$P_{\text{equ}}$
and the average ion energy is higher than that of the electrons, so the electron thermalization degree is higher than that in the first avalanche stage. The cooling effect on the electrons by $E_{\text{ambi}}$
decreases because the
$E_{\text{ambi}}$
decreases because the $E_{\text{ambi}}$
is produced by the discrepancy between electron and ion velocities, then the ionization rate can surpass the first avalanche stage. The other reason is related to the pre-filling. We can see that in the three cases where the pre-filling pressure is higher, the higher neutral gas density leads to much more ionization collisions when the electrons are thermalized. Moreover, the electron energy is over several thousand eV when the pre-filling pressures are very low (
$E_{\text{ambi}}$
is produced by the discrepancy between electron and ion velocities, then the ionization rate can surpass the first avalanche stage. The other reason is related to the pre-filling. We can see that in the three cases where the pre-filling pressure is higher, the higher neutral gas density leads to much more ionization collisions when the electrons are thermalized. Moreover, the electron energy is over several thousand eV when the pre-filling pressures are very low ( $6.66\times 10^{-5}$
,
$6.66\times 10^{-5}$
, $1.33\times 10^{-4}$
Pa), which means that runaway electrons are generated.
$1.33\times 10^{-4}$
Pa), which means that runaway electrons are generated.
From figure 4 one can see in the two cases the simulations are interrupted after approximately 1 ms. This is because in our simulation we delete electrons with a velocity close to the light speed. For absolute runaway discharge, nearly all electrons are running away, which leads to simulation crash. These energy profiles are thus consistent with the evolution of plasma density in figure 2(c,d). At low pre-filling pressures, particles can be accelerated effectively because of low collision frequency. Also, this value of induced electric field is sufficient to make the electrons reach extremely high energies. As the pre-filling pressure increases ( ${>}1.33\times 10^{-4}$
Pa), the average electron energy cannot be so high because of the collisions with neutrals.
${>}1.33\times 10^{-4}$
Pa), the average electron energy cannot be so high because of the collisions with neutrals.
In short, there is a possible range for pre-filling pressure for successful breakdown, once the induced electric field is fixed. As the induced electric field increases, the range becomes broad. In addition, runaway electrons are easy to produce in low pressure cases.
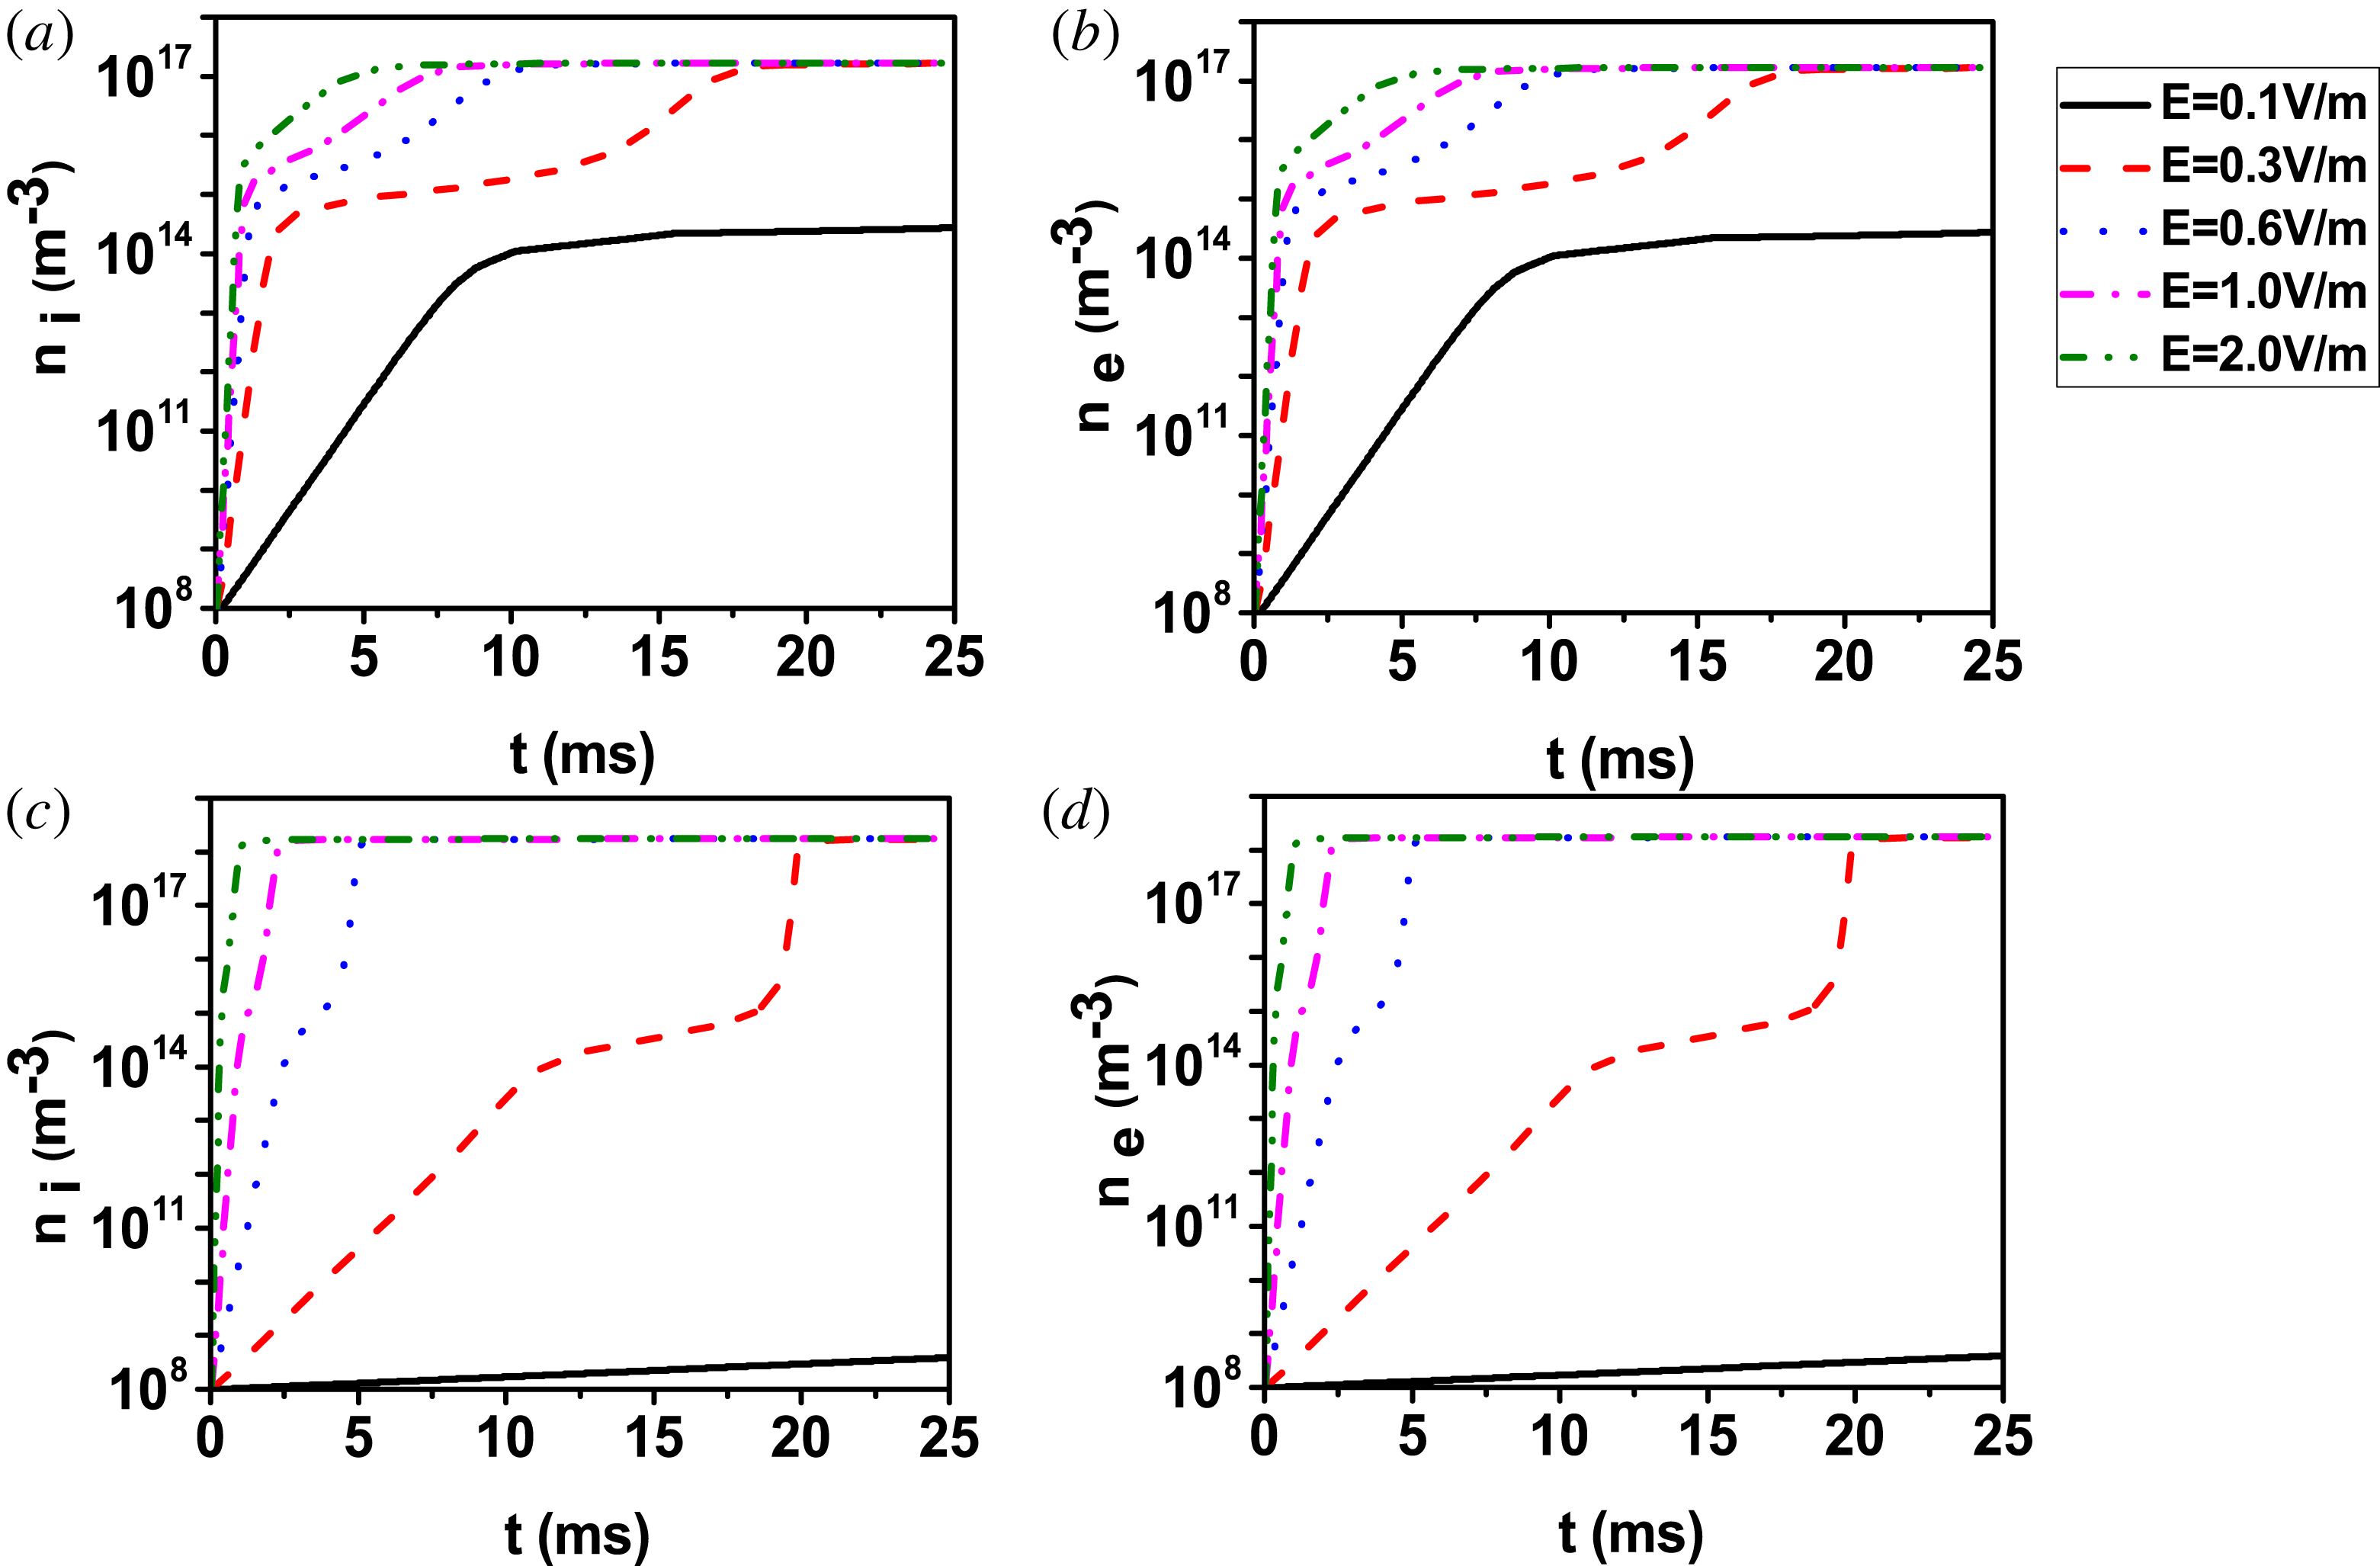
Figure 5. Time evolution of (a) ion density, (b) electron density at $p=6.66\times 10^{-4}$
Pa and (c) ion density, (d) electron density at
$p=6.66\times 10^{-4}$
Pa and (c) ion density, (d) electron density at $p=6.66\times 10^{-3}$
Pa for different electric field values. This figure is a logarithmic plot. The case
$p=6.66\times 10^{-3}$
Pa for different electric field values. This figure is a logarithmic plot. The case $E=0.1~\text{V}~\text{m}^{-1}$
,
$E=0.1~\text{V}~\text{m}^{-1}$
, $p=6.66\times 10^{-4}$
Pa and the case
$p=6.66\times 10^{-4}$
Pa and the case $E=0.1~\text{V}~\text{m}^{-1}$
,
$E=0.1~\text{V}~\text{m}^{-1}$
, $p=6.66\times 10^{-3}$
Pa will be further analysed in § 3.1 as examples of strong no-breakdown mode and weak no-breakdown mode respectively.
$p=6.66\times 10^{-3}$
Pa will be further analysed in § 3.1 as examples of strong no-breakdown mode and weak no-breakdown mode respectively.
2.2 Influence of the induced electric field
The induced electric field is also a key parameter in tokamak start-up because it determines whether the neutrals can produce an avalanche. Since low electric field values ( ${\leqslant}0.3~\text{V}~\text{m}^{-1}$
) are required in ITER start-up operation, it becomes crucial to understand how low electric field values influence the breakdown process. Here we investigate electric field values in the range 0.1–
${\leqslant}0.3~\text{V}~\text{m}^{-1}$
) are required in ITER start-up operation, it becomes crucial to understand how low electric field values influence the breakdown process. Here we investigate electric field values in the range 0.1– $2.0~\text{V}~\text{m}^{-1}$
. We show the time evolution of the ion and electron densities under the pre-filling pressure of
$2.0~\text{V}~\text{m}^{-1}$
. We show the time evolution of the ion and electron densities under the pre-filling pressure of $6.66\times 10^{-4}$
Pa for different induced electric field values in figure 5(a,b). At this pressure, all the cases illustrated but the one with induced electric field
$6.66\times 10^{-4}$
Pa for different induced electric field values in figure 5(a,b). At this pressure, all the cases illustrated but the one with induced electric field $0.1~\text{V}~\text{m}^{-1}$
(black line) result into successful breakdown and full ionization. Further analysing figure 5(a,b), we can make three observations. First, we can see that ion and electron densities increase exponentially during the first few ms of the discharge before the neutral gas is ionized fully, although the growth rates during the breakdown process are different for different electric field values. Higher growth rates are associated with higher electric field values. Second, we can see that when the induced electric field is larger than
$0.1~\text{V}~\text{m}^{-1}$
(black line) result into successful breakdown and full ionization. Further analysing figure 5(a,b), we can make three observations. First, we can see that ion and electron densities increase exponentially during the first few ms of the discharge before the neutral gas is ionized fully, although the growth rates during the breakdown process are different for different electric field values. Higher growth rates are associated with higher electric field values. Second, we can see that when the induced electric field is larger than $0.3~\text{V}~\text{m}^{-1}$
, two stages with two different density growth rates can be identified in the plots during the avalanche phase of successful breakdown cases. Instead, when the electric field is
$0.3~\text{V}~\text{m}^{-1}$
, two stages with two different density growth rates can be identified in the plots during the avalanche phase of successful breakdown cases. Instead, when the electric field is $0.3~\text{V}~\text{m}^{-1}$
, the three phases previously commented upon in § 2.1, figure 2, are identifiable. The second of the three stages is the transition between induced electric field and ambipolar electric field dominance. The lower the induced electric field is, the longer the transition lasts, which indicates that the ambipolar diffusion field
$0.3~\text{V}~\text{m}^{-1}$
, the three phases previously commented upon in § 2.1, figure 2, are identifiable. The second of the three stages is the transition between induced electric field and ambipolar electric field dominance. The lower the induced electric field is, the longer the transition lasts, which indicates that the ambipolar diffusion field $E_{\text{ambi}}$
is closely related to the induced electric field
$E_{\text{ambi}}$
is closely related to the induced electric field $E_{\text{ind}}$
. Here the
$E_{\text{ind}}$
. Here the $E_{\text{ambi}}$
is the source of
$E_{\text{ambi}}$
is the source of $P_{\text{equ}}$
, which represents the energy transferring from electrons to ions. The breakdown fails at the induced electric field of
$P_{\text{equ}}$
, which represents the energy transferring from electrons to ions. The breakdown fails at the induced electric field of $0.1~\text{V}~\text{m}^{-1}$
, since the electric field is not sufficient to obtain the avalanche. Third, the plasma density is the same when the neutrals are ionized fully for the different induced electric field cases because the pre-filling pressure (and hence the density of the neutrals) is the same at the beginning of the simulation for all the cases illustrated here.
$0.1~\text{V}~\text{m}^{-1}$
, since the electric field is not sufficient to obtain the avalanche. Third, the plasma density is the same when the neutrals are ionized fully for the different induced electric field cases because the pre-filling pressure (and hence the density of the neutrals) is the same at the beginning of the simulation for all the cases illustrated here.
Figure 5(c,d) shows the time evolution of the ion and electron density under the pre-filling pressure of $6.66\times 10^{-3}$
Pa for the same electric field values as panel (a,b). Also in this case, successful breakdown is obtained at all electric field values but the lowest,
$6.66\times 10^{-3}$
Pa for the same electric field values as panel (a,b). Also in this case, successful breakdown is obtained at all electric field values but the lowest, $E=0.1~\text{V}~\text{m}^{-1}$
. Also in panel (c,d), as already in (a,b), we see that the avalanche delay decreases as the induced electric field increases, which is a reasonable result. This is because the growth rate of the electron density is determined by the ionization rate, which is extremely sensitive to the intensity of the induced electric field. We can say that the higher the induced electric field is, the faster and easier the breakdown becomes.
$E=0.1~\text{V}~\text{m}^{-1}$
. Also in panel (c,d), as already in (a,b), we see that the avalanche delay decreases as the induced electric field increases, which is a reasonable result. This is because the growth rate of the electron density is determined by the ionization rate, which is extremely sensitive to the intensity of the induced electric field. We can say that the higher the induced electric field is, the faster and easier the breakdown becomes.
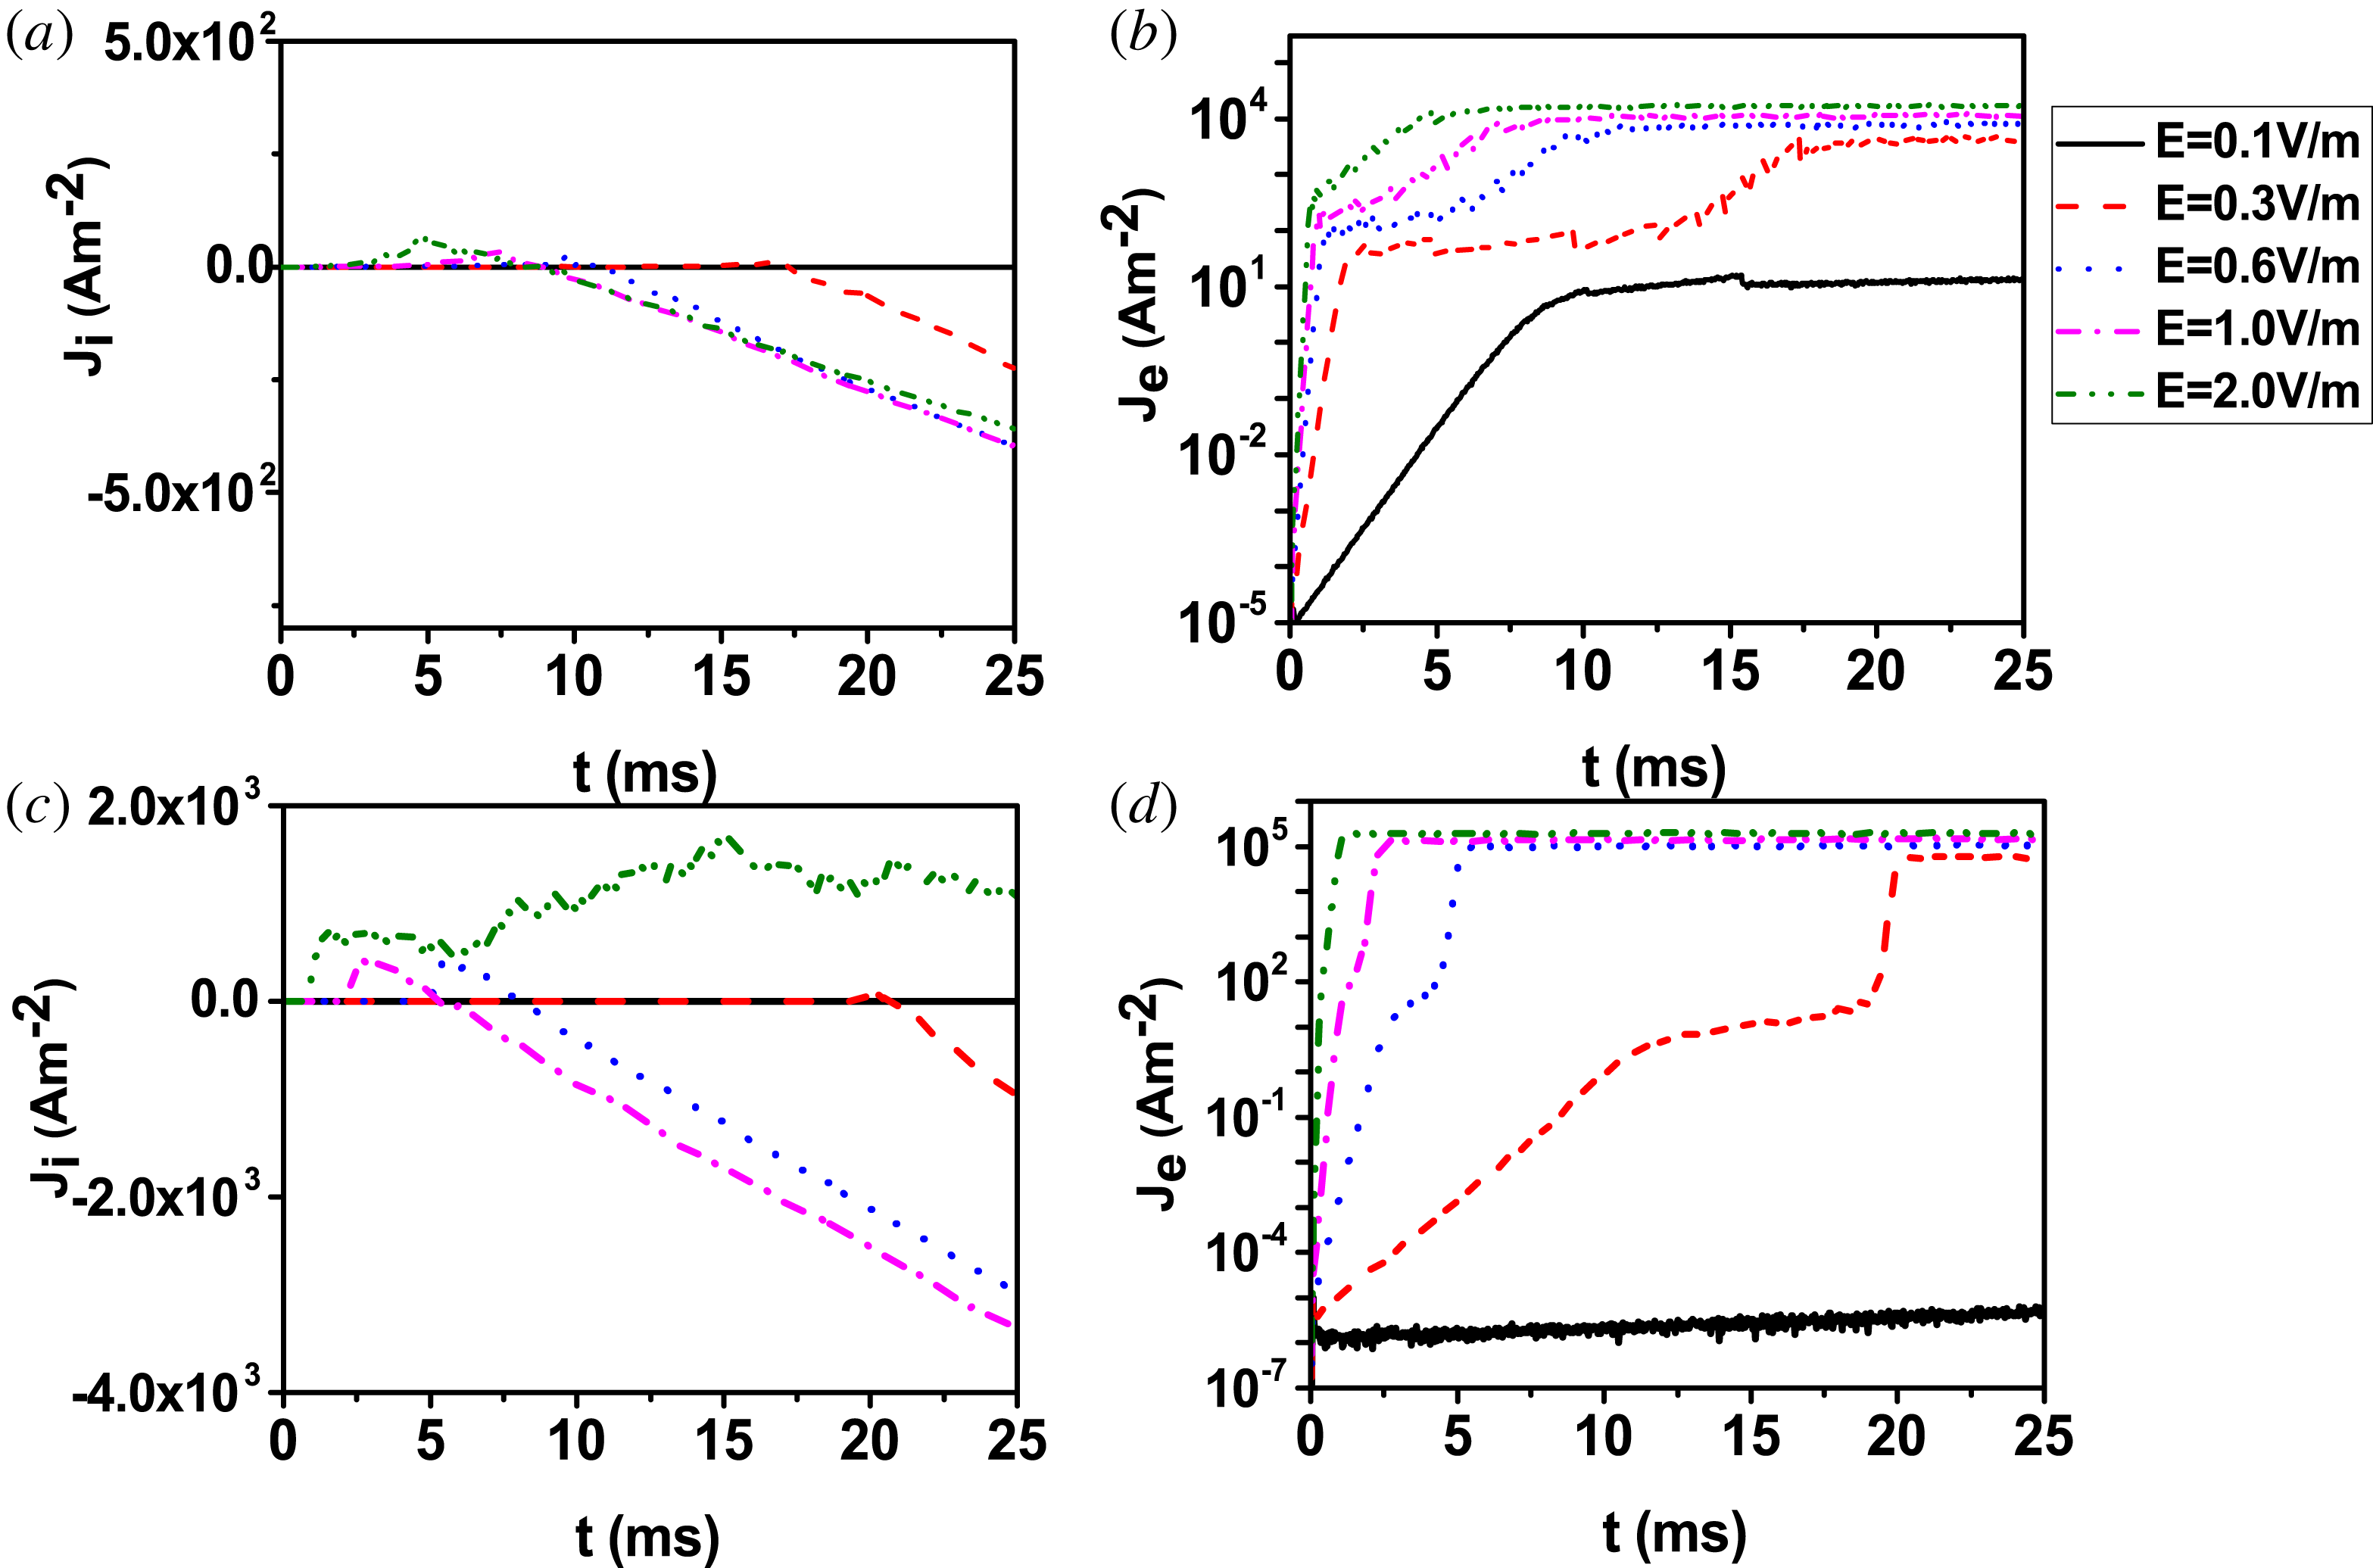
Figure 6. Time evolution of (a) ion current density, (b) electron current density at $p=6.66\times 10^{-4}$
Pa and (c) ion current density, (d) electron current density at
$p=6.66\times 10^{-4}$
Pa and (c) ion current density, (d) electron current density at $p=6.66\times 10^{-3}$
Pa for different electric fields.
$p=6.66\times 10^{-3}$
Pa for different electric fields.
Figure 6(a,b) shows the time evolution of the ion and electron current densities at the pressure of $6.66\times 10^{-4}$
Pa for the same induced electric fields used in figure 3 (
$6.66\times 10^{-4}$
Pa for the same induced electric fields used in figure 3 ( $1~\text{V}~\text{m}^{-1}$
). We can see that the ion current density changes from a positive to a negative value for all the electric field values that result in successful breakdown, following the pattern already identified and explained in § 2.1, figure 3. Figure 6(c,d) shows the time evolution of the ion and electron current densities with a pressure of
$1~\text{V}~\text{m}^{-1}$
). We can see that the ion current density changes from a positive to a negative value for all the electric field values that result in successful breakdown, following the pattern already identified and explained in § 2.1, figure 3. Figure 6(c,d) shows the time evolution of the ion and electron current densities with a pressure of $6.66\times 10^{-3}$
Pa for the same electric field values explored before. One can clearly see that with the same electric field both of the final ion and electron current densities are higher than those in figure 6(a,b) for the successful breakdown cases. This is because, with higher pressure, the plasma density is higher when the neutrals are ionized fully (see figure 5). The electron current density is approximately two orders of magnitude higher than the ion current density: the plasma current is mainly carried by electrons. Finally, we can see in figure 6(c) that when the electric field is
$6.66\times 10^{-3}$
Pa for the same electric field values explored before. One can clearly see that with the same electric field both of the final ion and electron current densities are higher than those in figure 6(a,b) for the successful breakdown cases. This is because, with higher pressure, the plasma density is higher when the neutrals are ionized fully (see figure 5). The electron current density is approximately two orders of magnitude higher than the ion current density: the plasma current is mainly carried by electrons. Finally, we can see in figure 6(c) that when the electric field is $2.0~\text{V}~\text{m}^{-1}$
, the ion current density is always positive, which is different from the other cases. The reason for this is that the external electric field dominates the whole breakdown phase, i.e. the ambipolar diffusion field is never dominant. This behaviour is consistent with the fact that, in figure 5(c), green line, the customary two phases in the ion density evolution are reduced to one: the stage where the ambipolar electric field dominates ionization never occurs.
$2.0~\text{V}~\text{m}^{-1}$
, the ion current density is always positive, which is different from the other cases. The reason for this is that the external electric field dominates the whole breakdown phase, i.e. the ambipolar diffusion field is never dominant. This behaviour is consistent with the fact that, in figure 5(c), green line, the customary two phases in the ion density evolution are reduced to one: the stage where the ambipolar electric field dominates ionization never occurs.
Figure 7. Time evolution of (a) ion energy, (b) electron energy at $p=6.66\times 10^{-4}$
Pa and (c) ion energy, (d) electron energy at
$p=6.66\times 10^{-4}$
Pa and (c) ion energy, (d) electron energy at $p=6.66\times 10^{-3}$
Pa for different electric fields. The case
$p=6.66\times 10^{-3}$
Pa for different electric fields. The case $E=2~\text{V}~\text{m}^{-1}$
,
$E=2~\text{V}~\text{m}^{-1}$
, $p=6.66\times 10^{-3}$
Pa mode will be further analysed in § 3.2 as an example of abnormally successful breakdown.
$p=6.66\times 10^{-3}$
Pa mode will be further analysed in § 3.2 as an example of abnormally successful breakdown.
Figure 7(a,b) shows the time evolution of the average ion and electron energies for different induced electric field values when the pre-filling pressure is $6.66\times 10^{-4}$
Pa. We can see that the higher the induced electric field is, the larger the maximum of the ion and electron density is. The trends of evolution of the ion and electron energies in the successful breakdown cases are similar to those in figure 4. The ion energy keeps increasing to a constant value, while the electron energy increases at the beginning and then plateaus for a short time, after which it starts decreasing and the plateauing for some time, then it increases to a value and stays constant. Then, even if the energy value keeps increasing, it stays below 10 eV. There are two reasons for this behaviour: the first one is that before full ionization, the radiation and ionization barriers consume a lot of energy. The other one is that as the discharge progresses, once the
$6.66\times 10^{-4}$
Pa. We can see that the higher the induced electric field is, the larger the maximum of the ion and electron density is. The trends of evolution of the ion and electron energies in the successful breakdown cases are similar to those in figure 4. The ion energy keeps increasing to a constant value, while the electron energy increases at the beginning and then plateaus for a short time, after which it starts decreasing and the plateauing for some time, then it increases to a value and stays constant. Then, even if the energy value keeps increasing, it stays below 10 eV. There are two reasons for this behaviour: the first one is that before full ionization, the radiation and ionization barriers consume a lot of energy. The other one is that as the discharge progresses, once the $E_{\text{ambi}}$
becomes dominant, more energy from electrons is transferred to ions, leading to an electron energy below 10 eV. When the induced electric field is
$E_{\text{ambi}}$
becomes dominant, more energy from electrons is transferred to ions, leading to an electron energy below 10 eV. When the induced electric field is $0.1~\text{V}~\text{m}^{-1}$
, both the ion and electron energies are low, which indicates that the electric field is not strong enough for neutrals to achieve successful breakdown with the pre-filling pressure of
$0.1~\text{V}~\text{m}^{-1}$
, both the ion and electron energies are low, which indicates that the electric field is not strong enough for neutrals to achieve successful breakdown with the pre-filling pressure of $6.66\times 10^{-4}$
Pa. However, when the electric field is
$6.66\times 10^{-4}$
Pa. However, when the electric field is $2.0~\text{V}~\text{m}^{-1}$
, the electron energy can reach several hundreds of eV. In practice, during the initial phase of plasma breakdown, due to the fact that the energy of the bulk plasma is low, electrons are easily accelerated by the high toroidal electric field to form the runaway. This means that such high induced electric field is not appropriate for the pre-filling pressure of
$2.0~\text{V}~\text{m}^{-1}$
, the electron energy can reach several hundreds of eV. In practice, during the initial phase of plasma breakdown, due to the fact that the energy of the bulk plasma is low, electrons are easily accelerated by the high toroidal electric field to form the runaway. This means that such high induced electric field is not appropriate for the pre-filling pressure of $6.66\times 10^{-4}$
Pa. On the other hand, high induced electric fields will increase the stray (or error) magnetic field, which will further decrease the effective connection length and then increase particle loss. In addition, we have compared our results with Lloyd’s theory. It is found that for the case of
$6.66\times 10^{-4}$
Pa. On the other hand, high induced electric fields will increase the stray (or error) magnetic field, which will further decrease the effective connection length and then increase particle loss. In addition, we have compared our results with Lloyd’s theory. It is found that for the case of $E=0.3~\text{V}~\text{m}^{-1}$
,
$E=0.3~\text{V}~\text{m}^{-1}$
, $p=6.66^{-4}$
Pa, the kinetic energy using the drift velocity calculated by Lloyd’s model is nearly 15 eV, which is consistent with the simulation results.
$p=6.66^{-4}$
Pa, the kinetic energy using the drift velocity calculated by Lloyd’s model is nearly 15 eV, which is consistent with the simulation results.
In figure 7(c,d), we show the time evolution of the ion and electron energy at $6.66\times 10^{-3}$
Pa. The evolution of ion energy is similar to that of figure 7(a), while the pattern of electron energy evolution varies for the different
$6.66\times 10^{-3}$
Pa. The evolution of ion energy is similar to that of figure 7(a), while the pattern of electron energy evolution varies for the different $E$
values. When
$E$
values. When $E$
is
$E$
is $0.3~\text{V}~\text{m}^{-1}$
,
$0.3~\text{V}~\text{m}^{-1}$
, $0.6~\text{V}~\text{m}^{-1}$
, a rather long time (with respect to the 1.0,
$0.6~\text{V}~\text{m}^{-1}$
, a rather long time (with respect to the 1.0, $2.0~\text{V}~\text{m}^{-1}$
cases) elapses before the electron energy starts decreasing. This is because, in the low electric field case, electrons need more time to be accelerated to obtain enough energy for ionization collisions. One can also notice that, when the induced electric field is
$2.0~\text{V}~\text{m}^{-1}$
cases) elapses before the electron energy starts decreasing. This is because, in the low electric field case, electrons need more time to be accelerated to obtain enough energy for ionization collisions. One can also notice that, when the induced electric field is $2.0~\text{V}~\text{m}^{-1}$
, the peak electron energy is much lower than in figure 7(b), while the ion energy is higher: no runaway electrons are produced. This is because, in this case, the higher pressure leads to many more collisions, so it is relatively not easy to produce runaway electrons. On the other hand, both ions and electrons are accelerated by the large electric field: the ambipolar diffusion field is very strong and thus electron energies are transferred much more efficiently to ions. The situation in which the average ion energy is higher than electron energy only occurs when the external induced electric field is very strong, for example
$2.0~\text{V}~\text{m}^{-1}$
, the peak electron energy is much lower than in figure 7(b), while the ion energy is higher: no runaway electrons are produced. This is because, in this case, the higher pressure leads to many more collisions, so it is relatively not easy to produce runaway electrons. On the other hand, both ions and electrons are accelerated by the large electric field: the ambipolar diffusion field is very strong and thus electron energies are transferred much more efficiently to ions. The situation in which the average ion energy is higher than electron energy only occurs when the external induced electric field is very strong, for example $2~\text{V}~\text{m}^{-1}$
, leading to strong ohmic heating of ions.
$2~\text{V}~\text{m}^{-1}$
, leading to strong ohmic heating of ions.
From figures 5 to 7, it is seen that if the induced electric field is too low, breakdown will never happen because of low ohmic heating. Contrarily, if the electric field is too high, breakdown can occur but with different plasma characteristics. So in order to get a better breakdown, the pre-filling pressure and electric field should be matched carefully.
3 Breakdown modes
3.1 No-breakdown mode
No-breakdown mode means that the plasma is not fully ionized in reasonable time and that, as a consequence, the plasma density, current and energy remain at low levels. Normally, no-breakdown mode occurs at low electric field $E$
and high pressure
$E$
and high pressure $p$
, or low
$p$
, or low $E/p$
. Two sub-modes can be further distinguished.
$E/p$
. Two sub-modes can be further distinguished.
The first one is absolute no-breakdown mode: the discharge stops at the fast electron avalanche phase (Jiang et al.
Reference Jiang, Peng, Zhang and Lapenta2016), or, in some rare cases, in the transition stage. The resulting plasma density, current and energy stay at very low levels. This mode occurs when the electric field is not high enough to fully ionize the gas. All input electrical power dissipates in gas heating and by photon emission in the collision process. In most cases, the density at the end of the simulation is smaller than $10^{14}~\text{m}^{-3}$
, which means that the electrons are only heated by the external field during the whole process: the ambipolar field does not develop. In some cases, the density can be close to
$10^{14}~\text{m}^{-3}$
, which means that the electrons are only heated by the external field during the whole process: the ambipolar field does not develop. In some cases, the density can be close to $10^{15}~\text{m}^{-3}$
, and
$10^{15}~\text{m}^{-3}$
, and $E_{\text{ambi}}\sim E_{\text{ind}}$
, but
$E_{\text{ambi}}\sim E_{\text{ind}}$
, but $E_{\text{ambi}}$
is still significantly smaller than the value that it can reach in the third phase of successful breakdown cases (
$E_{\text{ambi}}$
is still significantly smaller than the value that it can reach in the third phase of successful breakdown cases ( ${\sim}100~\text{V}~\text{m}^{-1}$
). With this set of parameters, breakdown is never possible regardless of the devices and conditions, as we have the most optimistic estimation for the parameters. A notable finding is that this mode exists at
${\sim}100~\text{V}~\text{m}^{-1}$
). With this set of parameters, breakdown is never possible regardless of the devices and conditions, as we have the most optimistic estimation for the parameters. A notable finding is that this mode exists at $E_{\text{ind}}<0.1~\text{V}~\text{m}^{-1}$
, regardless of the pressure.
$E_{\text{ind}}<0.1~\text{V}~\text{m}^{-1}$
, regardless of the pressure.
A typical case of absolute no-breakdown mode is in figure 5 with the electric field of $0.1~\text{V}~\text{m}^{-1}$
and pre-filling pressure of
$0.1~\text{V}~\text{m}^{-1}$
and pre-filling pressure of $6.66\times 10^{-3}$
Pa. As can be noted, the fast avalanche stage never finishes (strong no-breakdown). The plasma density, energy and current hardly increase. Figure 8 shows the time-averaged electron energy probability function (EEPF – first row), the electron parallel velocity distribution function (
$6.66\times 10^{-3}$
Pa. As can be noted, the fast avalanche stage never finishes (strong no-breakdown). The plasma density, energy and current hardly increase. Figure 8 shows the time-averaged electron energy probability function (EEPF – first row), the electron parallel velocity distribution function ( $V_{\Vert }DF$
– second row) and the time-averaged electric field (third row) at different times,
$V_{\Vert }DF$
– second row) and the time-averaged electric field (third row) at different times, $5=5$
ms (first column),
$5=5$
ms (first column), $t=15$
ms (second),
$t=15$
ms (second), $t=25$
ms (third) and
$t=25$
ms (third) and $t=25$
ms (fourth). The black line refers to strong no breakdown mode, the red one to weak no-breakdown mode, the blue one to relatively no-breakdown mode.
$t=25$
ms (fourth). The black line refers to strong no breakdown mode, the red one to weak no-breakdown mode, the blue one to relatively no-breakdown mode.
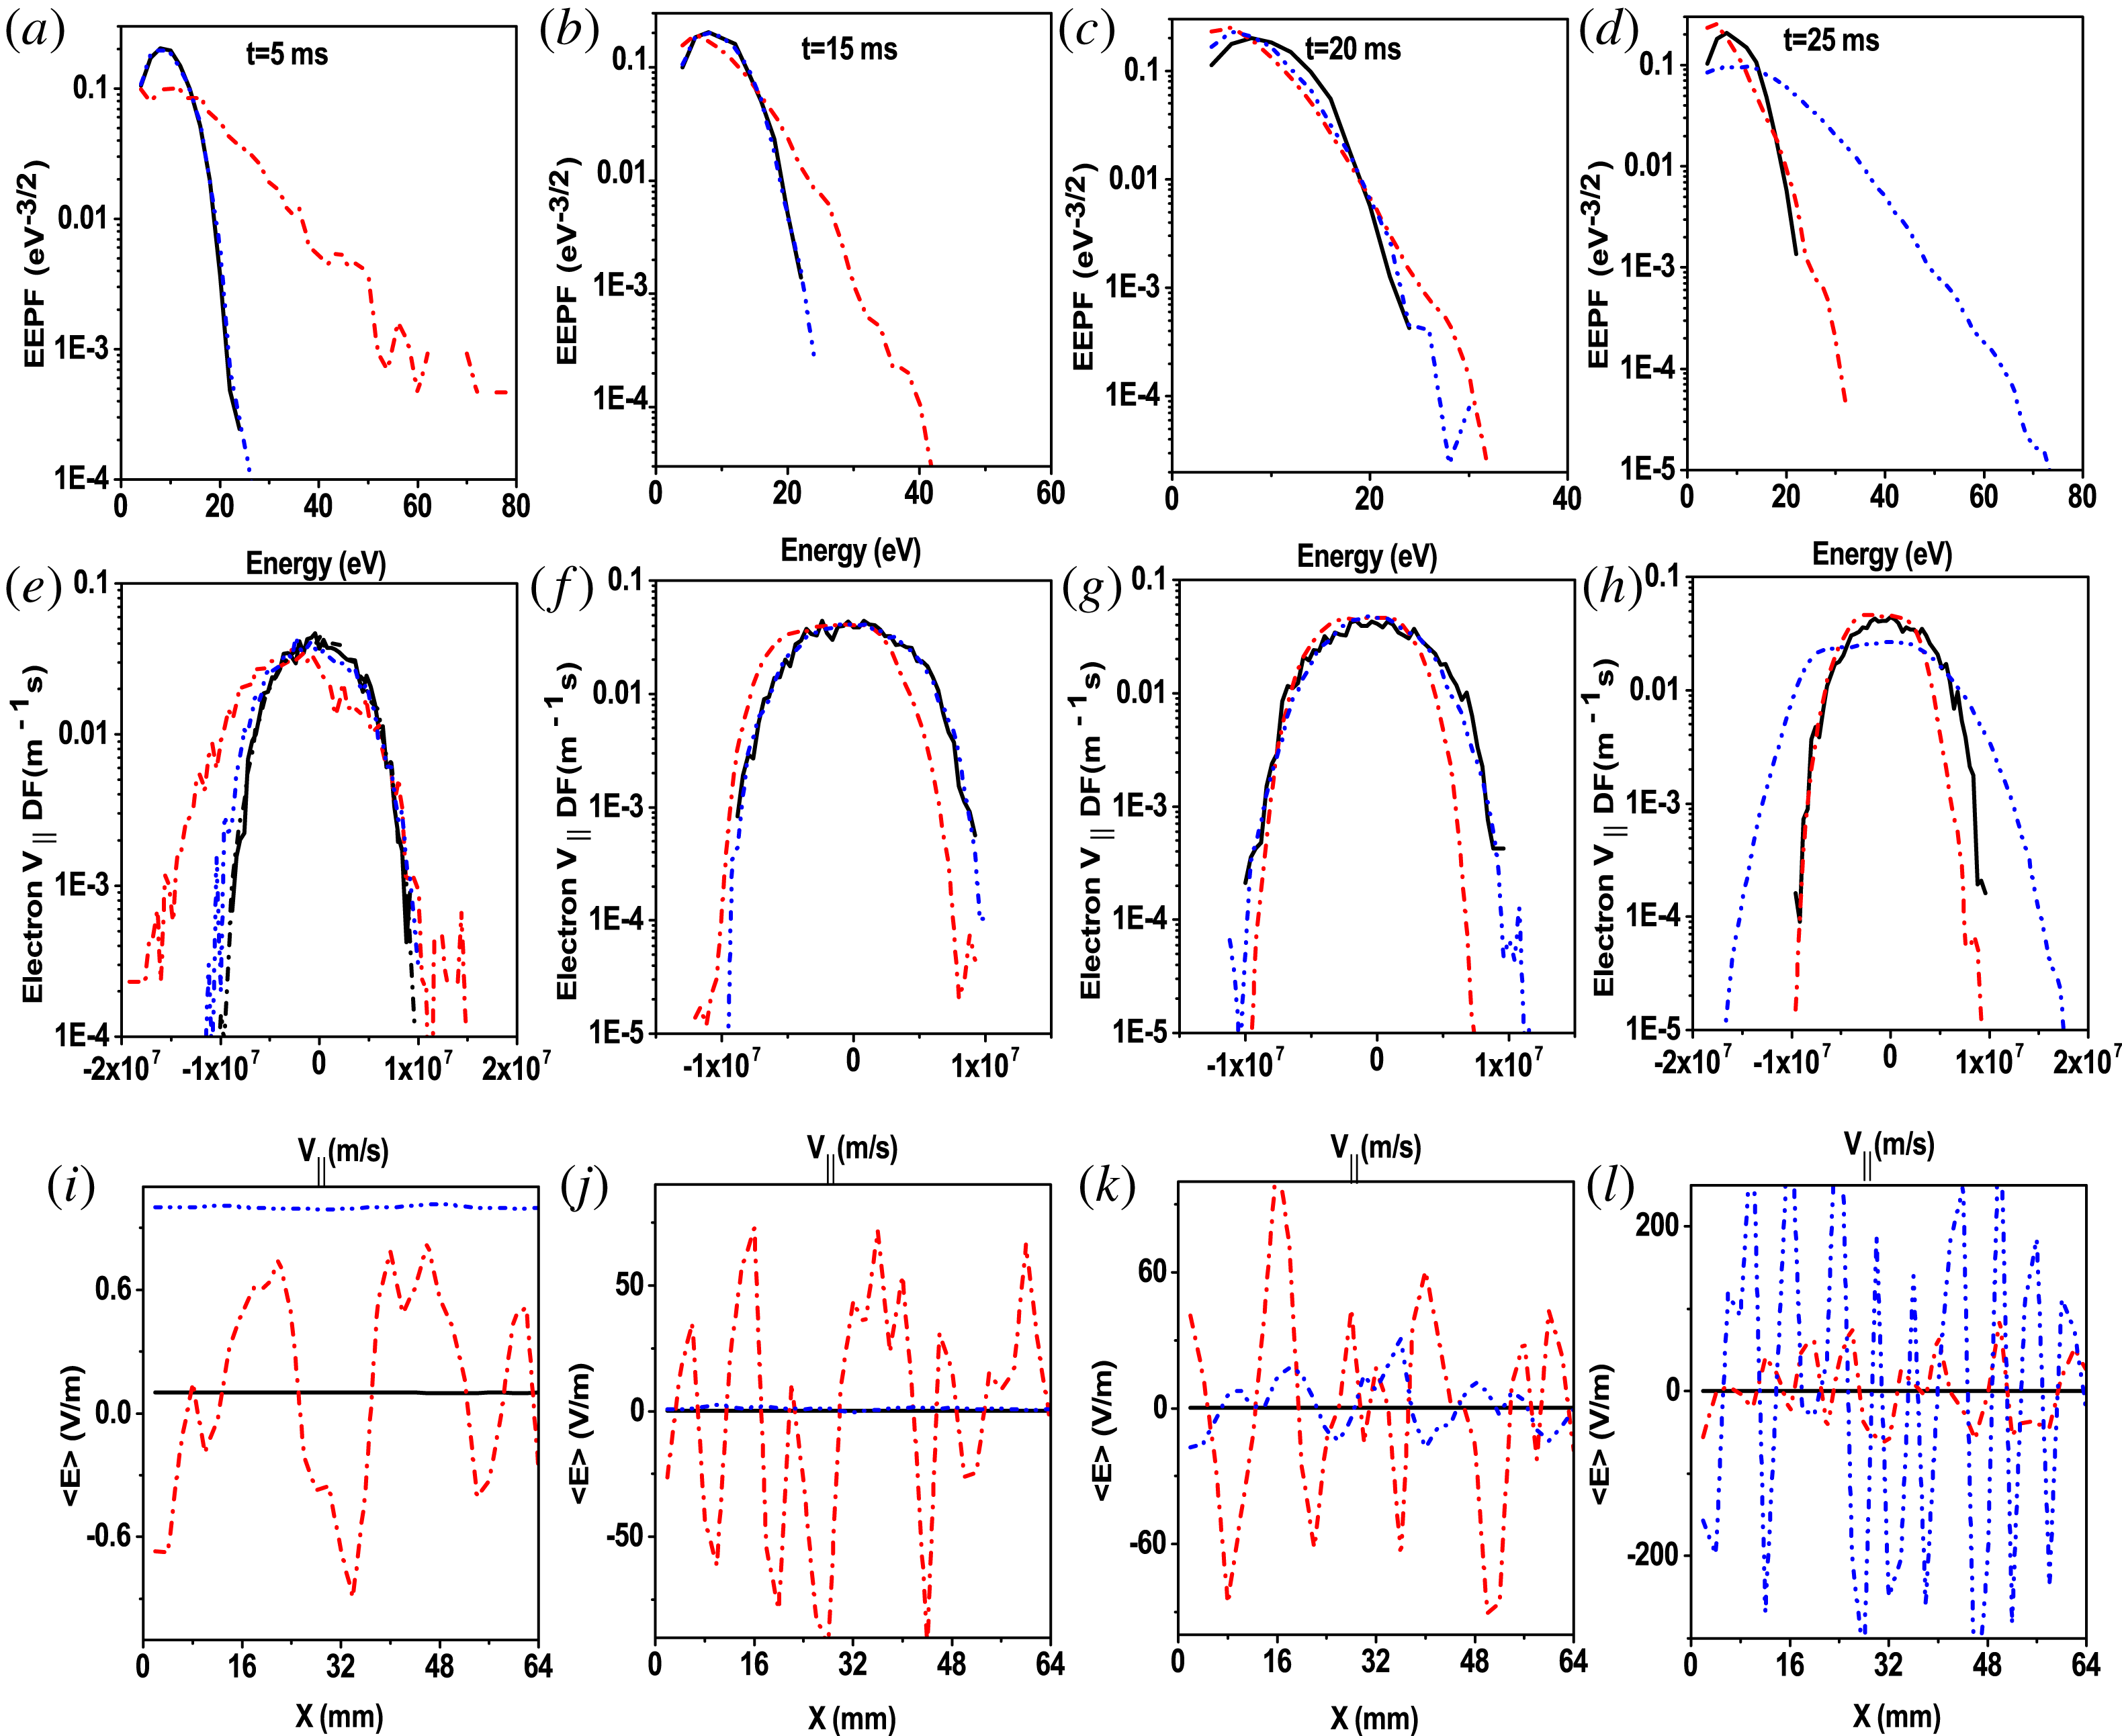
Figure 8. Time-averaged electron energy probability function (EEPF) at (a) $t=5$
ms (b)
$t=5$
ms (b) $t=15$
ms (c)
$t=15$
ms (c) $t=20$
ms (d)
$t=20$
ms (d) $t=25$
ms, electron parallel velocity distribution function (
$t=25$
ms, electron parallel velocity distribution function ( $V_{\Vert }DF$
) at (e)
$V_{\Vert }DF$
) at (e) $t=5$
ms (f)
$t=5$
ms (f) $t=15$
ms (g)
$t=15$
ms (g) $t=20$
ms (h)
$t=20$
ms (h) $t=25$
ms and time-averaged electric field at (i)
$t=25$
ms and time-averaged electric field at (i) $t=5$
ms (j)
$t=5$
ms (j) $t=15$
ms (k)
$t=15$
ms (k) $t=20$
ms (l)
$t=20$
ms (l) $t=25$
ms, for strong no-breakdown mode (black solid) with
$t=25$
ms, for strong no-breakdown mode (black solid) with $E=0.1~\text{V}~\text{m}^{-1}$
,
$E=0.1~\text{V}~\text{m}^{-1}$
, $p=6.66\times 10^{-3}$
Pa, weak no-breakdown mode (red dash dot) with
$p=6.66\times 10^{-3}$
Pa, weak no-breakdown mode (red dash dot) with $E=0.1~\text{V}~\text{m}^{-1}$
,
$E=0.1~\text{V}~\text{m}^{-1}$
, $p=6.66\times 10^{-4}$
Pa and relative no-breakdown mode (blue dash dot dot) with
$p=6.66\times 10^{-4}$
Pa and relative no-breakdown mode (blue dash dot dot) with $E=1~\text{V}~\text{m}^{-1}$
,
$E=1~\text{V}~\text{m}^{-1}$
, $p=6.66\times 10^{-2}$
Pa.
$p=6.66\times 10^{-2}$
Pa.
Looking at the EEPF evolution in the strong no-breakdown mode in figure 8, first row, black line, we can see that the discharge fails because the energy of the electrons is low and there are a few energetic electrons which can ionize neutrals: breakdown cannot occur. From the $V_{\Vert }DF$
of electrons (second row, black line), the same considerations can be obtained. From the evolution of averaged electric field (third row, black line), we can see that the averaged electric field is nearly unchanged because, at such a low electric field, electrons cannot be heated efficiently due to strong collisions and then the neutrals cannot be ionized. An important consideration can be done regarding the electric field plots. The electric field oscillations shown in the figure are not due to numerical noise, but reproduce the physical oscillations of the ambipolar diffusion field. These oscillations are caused by charge separation and the wavelength can reach the order of a millimetre. Indeed, the characteristics of the ambipolar diffusion field here are very similar to those that we have observed in previous work on low temperature plasmas where
$V_{\Vert }DF$
of electrons (second row, black line), the same considerations can be obtained. From the evolution of averaged electric field (third row, black line), we can see that the averaged electric field is nearly unchanged because, at such a low electric field, electrons cannot be heated efficiently due to strong collisions and then the neutrals cannot be ionized. An important consideration can be done regarding the electric field plots. The electric field oscillations shown in the figure are not due to numerical noise, but reproduce the physical oscillations of the ambipolar diffusion field. These oscillations are caused by charge separation and the wavelength can reach the order of a millimetre. Indeed, the characteristics of the ambipolar diffusion field here are very similar to those that we have observed in previous work on low temperature plasmas where $T_{e}\gg T_{i}$
(Jiang et al.
Reference Jiang, yu Wang, hua Bi and nian Wang2011). This field must be resolved because it can greatly influence the ion and electron energy balance, further influencing the transport both in the parallel and perpendicular directions. This requires the space step to be
$T_{e}\gg T_{i}$
(Jiang et al.
Reference Jiang, yu Wang, hua Bi and nian Wang2011). This field must be resolved because it can greatly influence the ion and electron energy balance, further influencing the transport both in the parallel and perpendicular directions. This requires the space step to be ${\sim}$
mm and time step to be
${\sim}$
mm and time step to be ${\sim}10^{-10}$
s.
${\sim}10^{-10}$
s.
We have just described a case of absolute no breakdown, where the avalanche phase is never completed (the plasma density keeps increasingly very slowly and full ionization is not reached). However, breakdown can fail also if the process stops at the transition phase. In this case, the plasma density reaches a plateau but then it does not increase anymore and full ionization is not reached. This case can be called weak no-breakdown. An example of this can be found in figure 5, with the electric field of $0.1~\text{V}~\text{m}^{-1}$
and pre-filling pressure of
$0.1~\text{V}~\text{m}^{-1}$
and pre-filling pressure of $6.66\times 10^{-4}$
Pa. On one hand, the electric field is too low for ohmic heating to heat electrons to the level needed to trigger ionization collisions. On the other hand, the pre-filling pressure is also low, which leads to a low collision frequency, so that the third avalanche stage cannot occur. The corresponding EEPFs and
$6.66\times 10^{-4}$
Pa. On one hand, the electric field is too low for ohmic heating to heat electrons to the level needed to trigger ionization collisions. On the other hand, the pre-filling pressure is also low, which leads to a low collision frequency, so that the third avalanche stage cannot occur. The corresponding EEPFs and $V_{\Vert }DF$
values are shown in figure 8, red line.
$V_{\Vert }DF$
values are shown in figure 8, red line.
After the strong and weak no-breakdown mode, we describe now the relative no-breakdown, i.e. the case where breakdown is possible, but it depends on the specific devices, as well as the specific conditions of the start-up, like wall materials, vacuum chamber conditions. Successful breakdown is marginally possible, if certain constraints on the power supply and the wall conditions are satisfied. However, a significant delay in reaching breakdown is unavoidable. In practical devices, a long delay is always not desirable for several reasons. First, a significant amount of volt-seconds will be wasted. Then, the eddy current will be more problematic due to wall heating. Second, the burn-through time will become longer and possibly more impurities will be generated, resulting in even more volt-seconds consumed by impurities. Third, the success of start-up is sensitive to wall materials and conditions: start-up failure will occur if the wall condition is bad, or if breakdown and impurities consume too much energy.
A typical case of relative no-breakdown mode is in figure 2, with an electric field of $1.0~\text{V}~\text{m}^{-1}$
and pre-filling pressure of
$1.0~\text{V}~\text{m}^{-1}$
and pre-filling pressure of $6.66\times 10^{-2}$
Pa (panel (c,d), cyan line). Although in this case the breakdown has finished, its delay is quite long, at least 24 ms. One also has to remark that our simulation conditions are ideal: in practical experiments, this case may fail to reach breakdown or clock even longer delays due to the wall materials and conditions, as discussed above. In order to better understand the plasma behaviour of this mode, the EEPF,
$6.66\times 10^{-2}$
Pa (panel (c,d), cyan line). Although in this case the breakdown has finished, its delay is quite long, at least 24 ms. One also has to remark that our simulation conditions are ideal: in practical experiments, this case may fail to reach breakdown or clock even longer delays due to the wall materials and conditions, as discussed above. In order to better understand the plasma behaviour of this mode, the EEPF, $V_{\Vert }DF$
and the averaged electric field for this case are also shown in figure 8, blue line. We can find that, at the beginning, the average energy of the electrons is low. The EEPF changes a little as the discharge proceeds, which means that large scale ionization cannot proceed to achieve fully breakdown in a short time. After 15 ms the average electron energy has increased. The reason why the energy increase is reached so late is because, under such a high pressure, collision loss will increase and electron acceleration to energy values high enough to produce gas ionization will take a longer time. Hence, the long breakdown delay. From the evolution of
$V_{\Vert }DF$
and the averaged electric field for this case are also shown in figure 8, blue line. We can find that, at the beginning, the average energy of the electrons is low. The EEPF changes a little as the discharge proceeds, which means that large scale ionization cannot proceed to achieve fully breakdown in a short time. After 15 ms the average electron energy has increased. The reason why the energy increase is reached so late is because, under such a high pressure, collision loss will increase and electron acceleration to energy values high enough to produce gas ionization will take a longer time. Hence, the long breakdown delay. From the evolution of $V_{\Vert }DF$
, we can see similar profiles. A similar trend is evident in the
$V_{\Vert }DF$
, we can see similar profiles. A similar trend is evident in the $V_{\Vert }DF$
values. One can also notice that, as the first avalanche proceeds, the ambipolar diffusion field begins to increase up to values much higher than the other two cases (recall that in this case, breakdown is achieved, even if with long time delays).
$V_{\Vert }DF$
values. One can also notice that, as the first avalanche proceeds, the ambipolar diffusion field begins to increase up to values much higher than the other two cases (recall that in this case, breakdown is achieved, even if with long time delays).
3.2 Successful breakdown mode
Breakdown is considered successful if full ionization is achieved within a reasonable time, and if the plasma density, current and energy are all within a reasonable range which will be discussed in detail in § 3.4. Here we define ‘reasonable time’ as 25 ms, in line with the running parameters of most tokamaks. Successful breakdown can be reached in two ways (sub-modes), normal and abnormal breakdown.
Normal breakdown has been discussed in detail in our last paper (Jiang et al.
Reference Jiang, Peng, Zhang and Lapenta2016). We will briefly summarize the main findings of that paper here. There are two modes: the low pressure mode and the high pressure mode. During the breakdown process, there are three discharge stages, i.e. the fast avalanche stage, transition stage and slow avalanche stage. In the fast avalanche stage, the $E_{\text{ind}}$
is dominant while the
$E_{\text{ind}}$
is dominant while the $E_{\text{ambi}}$
dominates in the slow avalanche stage. The transition stage only occurs when the electric field is low (
$E_{\text{ambi}}$
dominates in the slow avalanche stage. The transition stage only occurs when the electric field is low ( ${\leqslant}0.3~\text{V}~\text{m}^{-1}$
) because under high
${\leqslant}0.3~\text{V}~\text{m}^{-1}$
) because under high $E$
, the
$E$
, the $E_{\text{ambi}}$
increases so quickly that the lifetime of the second stage is so short that it can be neglected. During the fast and slow avalanche stages, plasma density increases much faster than in the transition stage. We have found that, unlike in conventional gas breakdown (Raizer & Allen Reference Raizer and Allen1997), plasma properties can be quite different even with the same
$E_{\text{ambi}}$
increases so quickly that the lifetime of the second stage is so short that it can be neglected. During the fast and slow avalanche stages, plasma density increases much faster than in the transition stage. We have found that, unlike in conventional gas breakdown (Raizer & Allen Reference Raizer and Allen1997), plasma properties can be quite different even with the same $E/p$
, and similarity laws are not applicable. The effects of gas pressure and electric field are only weakly coupled. In successful breakdown mode,
$E/p$
, and similarity laws are not applicable. The effects of gas pressure and electric field are only weakly coupled. In successful breakdown mode, $E_{\text{ambi}}$
will always exceed the
$E_{\text{ambi}}$
will always exceed the $E_{\text{ind}}$
in the slow avalanche stage. The electrons are cooled, while the ions are heated by
$E_{\text{ind}}$
in the slow avalanche stage. The electrons are cooled, while the ions are heated by $E_{\text{ambi}}$
or
$E_{\text{ambi}}$
or $P_{\text{equi}}$
. Ion heating is stochastic. Ions are heated and cooled randomly, but they are heated on average. After full ionization, the electrons and ions gradually reach thermal equilibrium at the same energy and same drift velocity. After that, the electron and ion current density and energy gradually increase and the current ramp-up phase begins. A typical case of the normal breakdown mode is in figure 1, for an electric field of
$P_{\text{equi}}$
. Ion heating is stochastic. Ions are heated and cooled randomly, but they are heated on average. After full ionization, the electrons and ions gradually reach thermal equilibrium at the same energy and same drift velocity. After that, the electron and ion current density and energy gradually increase and the current ramp-up phase begins. A typical case of the normal breakdown mode is in figure 1, for an electric field of $0.3~\text{V}~\text{m}^{-1}$
and pre-filling pressure of
$0.3~\text{V}~\text{m}^{-1}$
and pre-filling pressure of $1.33\times 10^{-3}$
Pa (panel (a,b), magenta line).
$1.33\times 10^{-3}$
Pa (panel (a,b), magenta line).
An interesting new finding here is that an abnormal breakdown mode may occur, at $E_{\text{ind}}=2~\text{V}~\text{m}^{-1}$
and
$E_{\text{ind}}=2~\text{V}~\text{m}^{-1}$
and $p=6.66\times 10^{-3}$
Pa, as can be see in figures 6 and 7, (c,d), olive line. In this case, unlike in the other cases of successful breakdown,
$p=6.66\times 10^{-3}$
Pa, as can be see in figures 6 and 7, (c,d), olive line. In this case, unlike in the other cases of successful breakdown, $E_{\text{ambi}}$
does not exceed the external
$E_{\text{ambi}}$
does not exceed the external $E_{\text{ind}}$
: ions are directly heated by
$E_{\text{ind}}$
: ions are directly heated by $E_{\text{ind}}$
(and not by
$E_{\text{ind}}$
(and not by $E_{\text{ambi}}$
). This implies that the ohmic heating rate for ions
$E_{\text{ambi}}$
). This implies that the ohmic heating rate for ions $P_{\text{Oh},i}$
is much larger than
$P_{\text{Oh},i}$
is much larger than $P_{\text{equi}}$
, which is unusual because generally the ohmic heating heats electrons rather than ions. Consequently, the ion energy increases much faster. Because ions are not heated randomly by
$P_{\text{equi}}$
, which is unusual because generally the ohmic heating heats electrons rather than ions. Consequently, the ion energy increases much faster. Because ions are not heated randomly by $E_{\text{ambi}}$
like in the normal breakdown mode, the heating efficiency is much higher and the ion energy can be much higher, even higher than the electron energy. Correspondingly, it requires much more total heating power. To our best knowledge, this mode has never been reported in experiments. We consider this new mode of successful breakdown worth of further study because in this mode the ion energy can increase faster, leading to faster breakdown and then saving volt-second consumption. However, we anticipate that triggering this mode in real devices could prove to be extremely challenging, because it will require high
$E_{\text{ambi}}$
like in the normal breakdown mode, the heating efficiency is much higher and the ion energy can be much higher, even higher than the electron energy. Correspondingly, it requires much more total heating power. To our best knowledge, this mode has never been reported in experiments. We consider this new mode of successful breakdown worth of further study because in this mode the ion energy can increase faster, leading to faster breakdown and then saving volt-second consumption. However, we anticipate that triggering this mode in real devices could prove to be extremely challenging, because it will require high $E_{\text{ind}}$
and input power, possibly beyond engineering limits. After plasma breakdown, the impedance of the plasma will decrease significantly, therefore it will be hard to maintain such high
$E_{\text{ind}}$
and input power, possibly beyond engineering limits. After plasma breakdown, the impedance of the plasma will decrease significantly, therefore it will be hard to maintain such high $E_{\text{ind}}$
.
$E_{\text{ind}}$
.
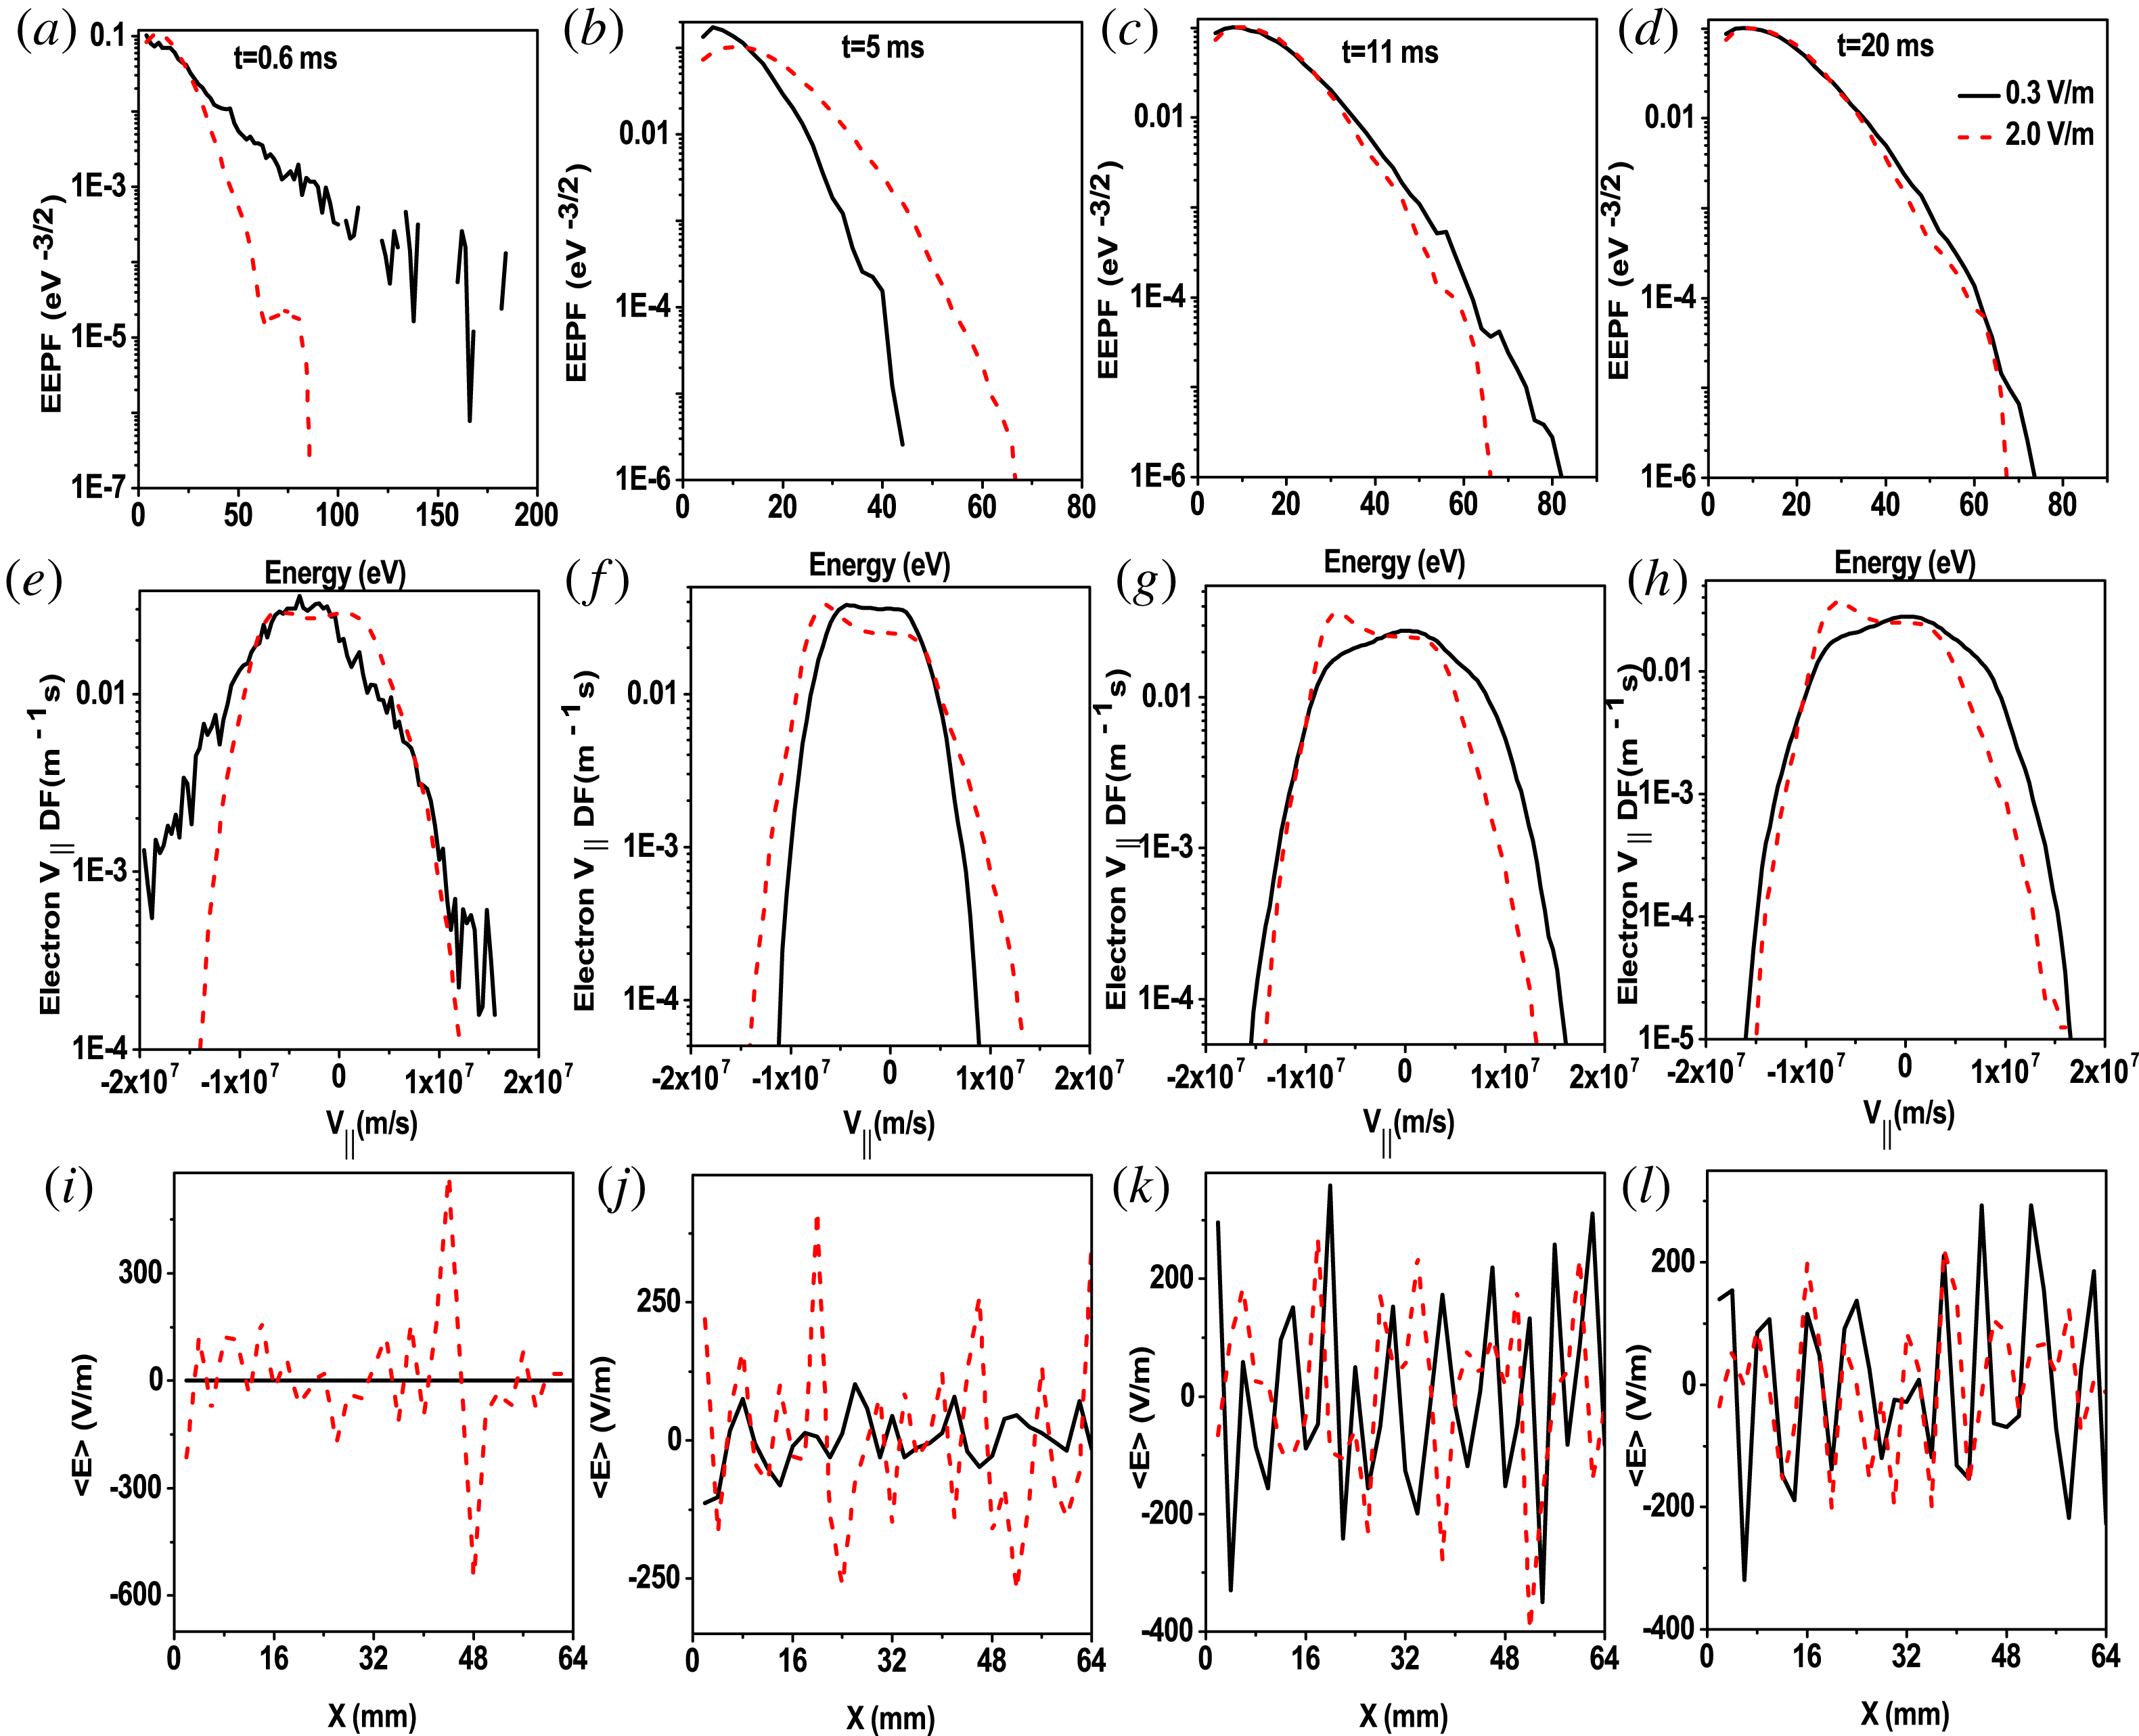
Figure 9. Time-averaged electron energy probability function (EEPF) at (a) $t=0.6$
ms (b)
$t=0.6$
ms (b) $t=5$
ms (c)
$t=5$
ms (c) $t=11$
ms (d)
$t=11$
ms (d) $t=20$
ms, electron parallel velocity distribution function (
$t=20$
ms, electron parallel velocity distribution function ( $V_{\Vert }DF$
) at (e)
$V_{\Vert }DF$
) at (e) $t=0.6$
ms (f)
$t=0.6$
ms (f) $t=5$
ms (g)
$t=5$
ms (g) $t=11$
ms (h)
$t=11$
ms (h) $t=20$
ms and time-averaged electric field at (i)
$t=20$
ms and time-averaged electric field at (i) $t=0.6$
ms (j)
$t=0.6$
ms (j) $t=5$
ms (k)
$t=5$
ms (k) $t=11$
ms (l)
$t=11$
ms (l) $t=20$
ms for different breakdown modes (normal breakdown:
$t=20$
ms for different breakdown modes (normal breakdown: $p=1.33\times 10^{-3}$
Pa and
$p=1.33\times 10^{-3}$
Pa and $E=0.3~\text{V}~\text{m}^{-1}$
(black solid), abnormal breakdown:
$E=0.3~\text{V}~\text{m}^{-1}$
(black solid), abnormal breakdown: $p=6.66\times 10^{-3}$
Pa and
$p=6.66\times 10^{-3}$
Pa and $E=2.0~\text{V}~\text{m}^{-1}$
(red dash)).
$E=2.0~\text{V}~\text{m}^{-1}$
(red dash)).
Figure 9 shows the kinetic behaviour of these two different successful breakdown modes. The black solid line represents the normal and the red dashed line denotes the abnormal breakdown mode. Normal breakdown is obtained with a pressure of $1.33\times 10^{-3}$
Pa and electric field of
$1.33\times 10^{-3}$
Pa and electric field of $0.3~\text{V}~\text{m}^{-1}$
, abnormal breakdown with a pressure of
$0.3~\text{V}~\text{m}^{-1}$
, abnormal breakdown with a pressure of $6.66\times 10^{-3}$
Pa and electric field of
$6.66\times 10^{-3}$
Pa and electric field of $2.0~\text{V}~\text{m}^{-1}$
. In figure 9(a) the EEPF with the lower electric field shows much more energetic electrons. This may be surprising, since we may expect higher
$2.0~\text{V}~\text{m}^{-1}$
. In figure 9(a) the EEPF with the lower electric field shows much more energetic electrons. This may be surprising, since we may expect higher $E$
to heat electrons more. The reason for this behaviour is that the high
$E$
to heat electrons more. The reason for this behaviour is that the high $E$
case also has larger initial pressure: ionization and radiation collisions make electrons lose energy even if they are accelerated by the larger initial
$E$
case also has larger initial pressure: ionization and radiation collisions make electrons lose energy even if they are accelerated by the larger initial $E_{\text{ind}}$
. We indicate these energy losses as
$E_{\text{ind}}$
. We indicate these energy losses as $P_{\text{rad}}$
and
$P_{\text{rad}}$
and $P_{iz}$
, respectively. As the breakdown proceeds, these two discharge modes reach a state in which the neutrals are fully ionized but the
$P_{iz}$
, respectively. As the breakdown proceeds, these two discharge modes reach a state in which the neutrals are fully ionized but the $V_{\Vert }DF$
of the electrons has a great discrepancy. For the normal breakdown (black line), at time
$V_{\Vert }DF$
of the electrons has a great discrepancy. For the normal breakdown (black line), at time $t=0.6$
ms the
$t=0.6$
ms the $V_{\Vert }DF$
has a drift velocity of
$V_{\Vert }DF$
has a drift velocity of $4\times 10^{6}~\text{m}~\text{s}^{-1}$
towards to left. The drift disappears at time
$4\times 10^{6}~\text{m}~\text{s}^{-1}$
towards to left. The drift disappears at time $t=11$
ms, because when the plasma density reaches a certain value (
$t=11$
ms, because when the plasma density reaches a certain value ( $10^{-15}~\text{m}^{-3}$
), the ambipolar diffusion field dominates and pull the drift back. For the abnormal breakdown discharge, instead, the leftwards drift with velocity of
$10^{-15}~\text{m}^{-3}$
), the ambipolar diffusion field dominates and pull the drift back. For the abnormal breakdown discharge, instead, the leftwards drift with velocity of $7.5\times 10^{6}~\text{m}~\text{s}^{-1}$
remains even when the breakdown has finished. This is because, in the abnormal mode, the induced electric field is larger than the ambipolar field during the entire discharge.
$7.5\times 10^{6}~\text{m}~\text{s}^{-1}$
remains even when the breakdown has finished. This is because, in the abnormal mode, the induced electric field is larger than the ambipolar field during the entire discharge.
3.3 Runaway mode
Runaway mode occurs when runaway electrons (REs, with energy of the order of several hundreds of eV) are produced. Generally, REs are produced during start-up or during disruptions (Esposito et al.
Reference Esposito, Martin-Solis, Poli, Mier, Sanchez and Panaccione2003; Martín-Solís et al.
Reference Martín-Solís, Esposito, Sánchez, Poli and Panaccione2006). However, the REs produced during the start-up process have attracted less attention. If the number of energetic electrons can be suppressed during the start-up process, this may decrease the damage to the vacuum vessel during disruption because energetic electrons can much more easily become runaway electrons during disruption. In this mode, the electron drift velocity and energy can be very high. In Lloyd’s work (Reference Lloyd, Carolan and Warrick1996) it is assumed that the electron velocity is constant when $E/p$
is small and once the runaway electrons are produced, this assumption is not valid because electrons can be freely accelerated. So for the runaway discharge with high
$E/p$
is small and once the runaway electrons are produced, this assumption is not valid because electrons can be freely accelerated. So for the runaway discharge with high $E/p$
, the drift velocity can be high and not a constant any more. The average electron energy can be higher than several hundreds of eV, and significant portion of the electron current is carried by high energy electrons. Runaway discharge usually happens in higher electric field and lower pressure cases, and it can be further divided into two sub-modes.
$E/p$
, the drift velocity can be high and not a constant any more. The average electron energy can be higher than several hundreds of eV, and significant portion of the electron current is carried by high energy electrons. Runaway discharge usually happens in higher electric field and lower pressure cases, and it can be further divided into two sub-modes.
The first mode is absolute runaway mode, in which REs will always be generated. In this mode, the average energy of the electrons can be as high as several hundreds, even thousands of eV, and increases endlessly until the simulation crashes. Indeed, to treat runaway electrons, we delete from the simulations the electrons with a velocity close to the light speed, when the physical model we use is no longer valid. Indeed, in absolute runaway mode, all electrons will be removed from the simulations eventually, and the electron density will become zero. In real tokamak experiments, most runaway electrons are lost to the wall due to the collisionless, damaging the plasma facing components.
The absolute runaway mode can be further classified into strong and weak modes. We define a process as a strong runaway mode if the plasma discharge does not form during the first avalanche phase as only fast electrons are generated. In this case, electrons are mainly accelerated by the external field during the discharge rather than colliding with neutrals, so electrons can easily become runaway. This mode is analogous to the dark discharge mode (Raizer & Allen Reference Raizer and Allen1997): no visible light can be observed, but high energy photons ( ${\sim}$
10 keV) with low flux may be detectable. A typical case for this mode is in figure 2 with a pressure of
${\sim}$
10 keV) with low flux may be detectable. A typical case for this mode is in figure 2 with a pressure of $1.33\times 10^{-4}$
Pa and electric field of
$1.33\times 10^{-4}$
Pa and electric field of $1.0~\text{V}~\text{m}^{-1}$
, red line in (c,d). Furthermore, we identify the weak absolute runaway mode when the discharge disruption does not occur during the fast breakdown phase. A large number of superthermal electrons with average energy that can exceed several hundreds of eV are produced. The average electron energy later decreases due to ionization and radiation collisions and the neutral gas cannot be ionized fully due to its low collision frequency. Generally, this weak runaway is triggered at low electric fields and low pressures, so the avalanche time is long, making the mode sensitive to the wall material and conditions. Superthermal electrons easily become runaway electrons. A typical case for this mode is in figure 2 with a pressure of
$1.0~\text{V}~\text{m}^{-1}$
, red line in (c,d). Furthermore, we identify the weak absolute runaway mode when the discharge disruption does not occur during the fast breakdown phase. A large number of superthermal electrons with average energy that can exceed several hundreds of eV are produced. The average electron energy later decreases due to ionization and radiation collisions and the neutral gas cannot be ionized fully due to its low collision frequency. Generally, this weak runaway is triggered at low electric fields and low pressures, so the avalanche time is long, making the mode sensitive to the wall material and conditions. Superthermal electrons easily become runaway electrons. A typical case for this mode is in figure 2 with a pressure of $1.33\times 10^{-4}$
Pa and electric field of
$1.33\times 10^{-4}$
Pa and electric field of $0.3~\text{V}~\text{m}^{-1}$
, red line in (a,b). When the absolute runaway mode is triggered, successful breakdown cannot be achieved in a real tokamak, as we have demonstrated here with numerical simulations under the conditions most favourable to successful plasma breakdown.
$0.3~\text{V}~\text{m}^{-1}$
, red line in (a,b). When the absolute runaway mode is triggered, successful breakdown cannot be achieved in a real tokamak, as we have demonstrated here with numerical simulations under the conditions most favourable to successful plasma breakdown.
The second runaway mode is relative runaway, in which a limited number of energetic and anisotropic electrons ( $v_{\Vert }>v_{\bot }$
) in velocity phase space are generated. This mode is usually triggered at high electric field and low pressure. Breakdown can complete in a certain time and the average electron energy can reach several hundreds of eV. Since the energy is high, the electrons are more prone to loss to the wall, especially by parallel transport. If the loss of those electrons is not significant, breakdown is still possible. Similar to the relative no-breakdown mode, whether successful breakdown will be achieved or not depends on the specific devices and conditions. The electrons loss is significantly affected by the stray magnetic field: the higher energy and anisotropy, the lower the tolerance of the stray magnetic field. The breakdown delay is shorter than in the case of relative no breakdown and thus the success of start-up is less sensitive to wall materials and conditions. Burn through is also faster. The wall condition requirement is less strict. As the parallel velocity can be high, the minor radius of the tokamak is also an important factor. A larger minor radius leads to longer confinement because the confinement time in the perpendicular direction is proportional to it and inversely proportional to the drift velocity: electrons with higher energy and anisotropy have a shorter confinement time for discharge. Indeed, this explains the experimental facts that carefully tuning of the stray magnetic field is only needed for low pressure operation (Song et al.
Reference Song, Song, Xia, Mao, Wang, Zhang and Chen2014).
$v_{\Vert }>v_{\bot }$
) in velocity phase space are generated. This mode is usually triggered at high electric field and low pressure. Breakdown can complete in a certain time and the average electron energy can reach several hundreds of eV. Since the energy is high, the electrons are more prone to loss to the wall, especially by parallel transport. If the loss of those electrons is not significant, breakdown is still possible. Similar to the relative no-breakdown mode, whether successful breakdown will be achieved or not depends on the specific devices and conditions. The electrons loss is significantly affected by the stray magnetic field: the higher energy and anisotropy, the lower the tolerance of the stray magnetic field. The breakdown delay is shorter than in the case of relative no breakdown and thus the success of start-up is less sensitive to wall materials and conditions. Burn through is also faster. The wall condition requirement is less strict. As the parallel velocity can be high, the minor radius of the tokamak is also an important factor. A larger minor radius leads to longer confinement because the confinement time in the perpendicular direction is proportional to it and inversely proportional to the drift velocity: electrons with higher energy and anisotropy have a shorter confinement time for discharge. Indeed, this explains the experimental facts that carefully tuning of the stray magnetic field is only needed for low pressure operation (Song et al.
Reference Song, Song, Xia, Mao, Wang, Zhang and Chen2014).
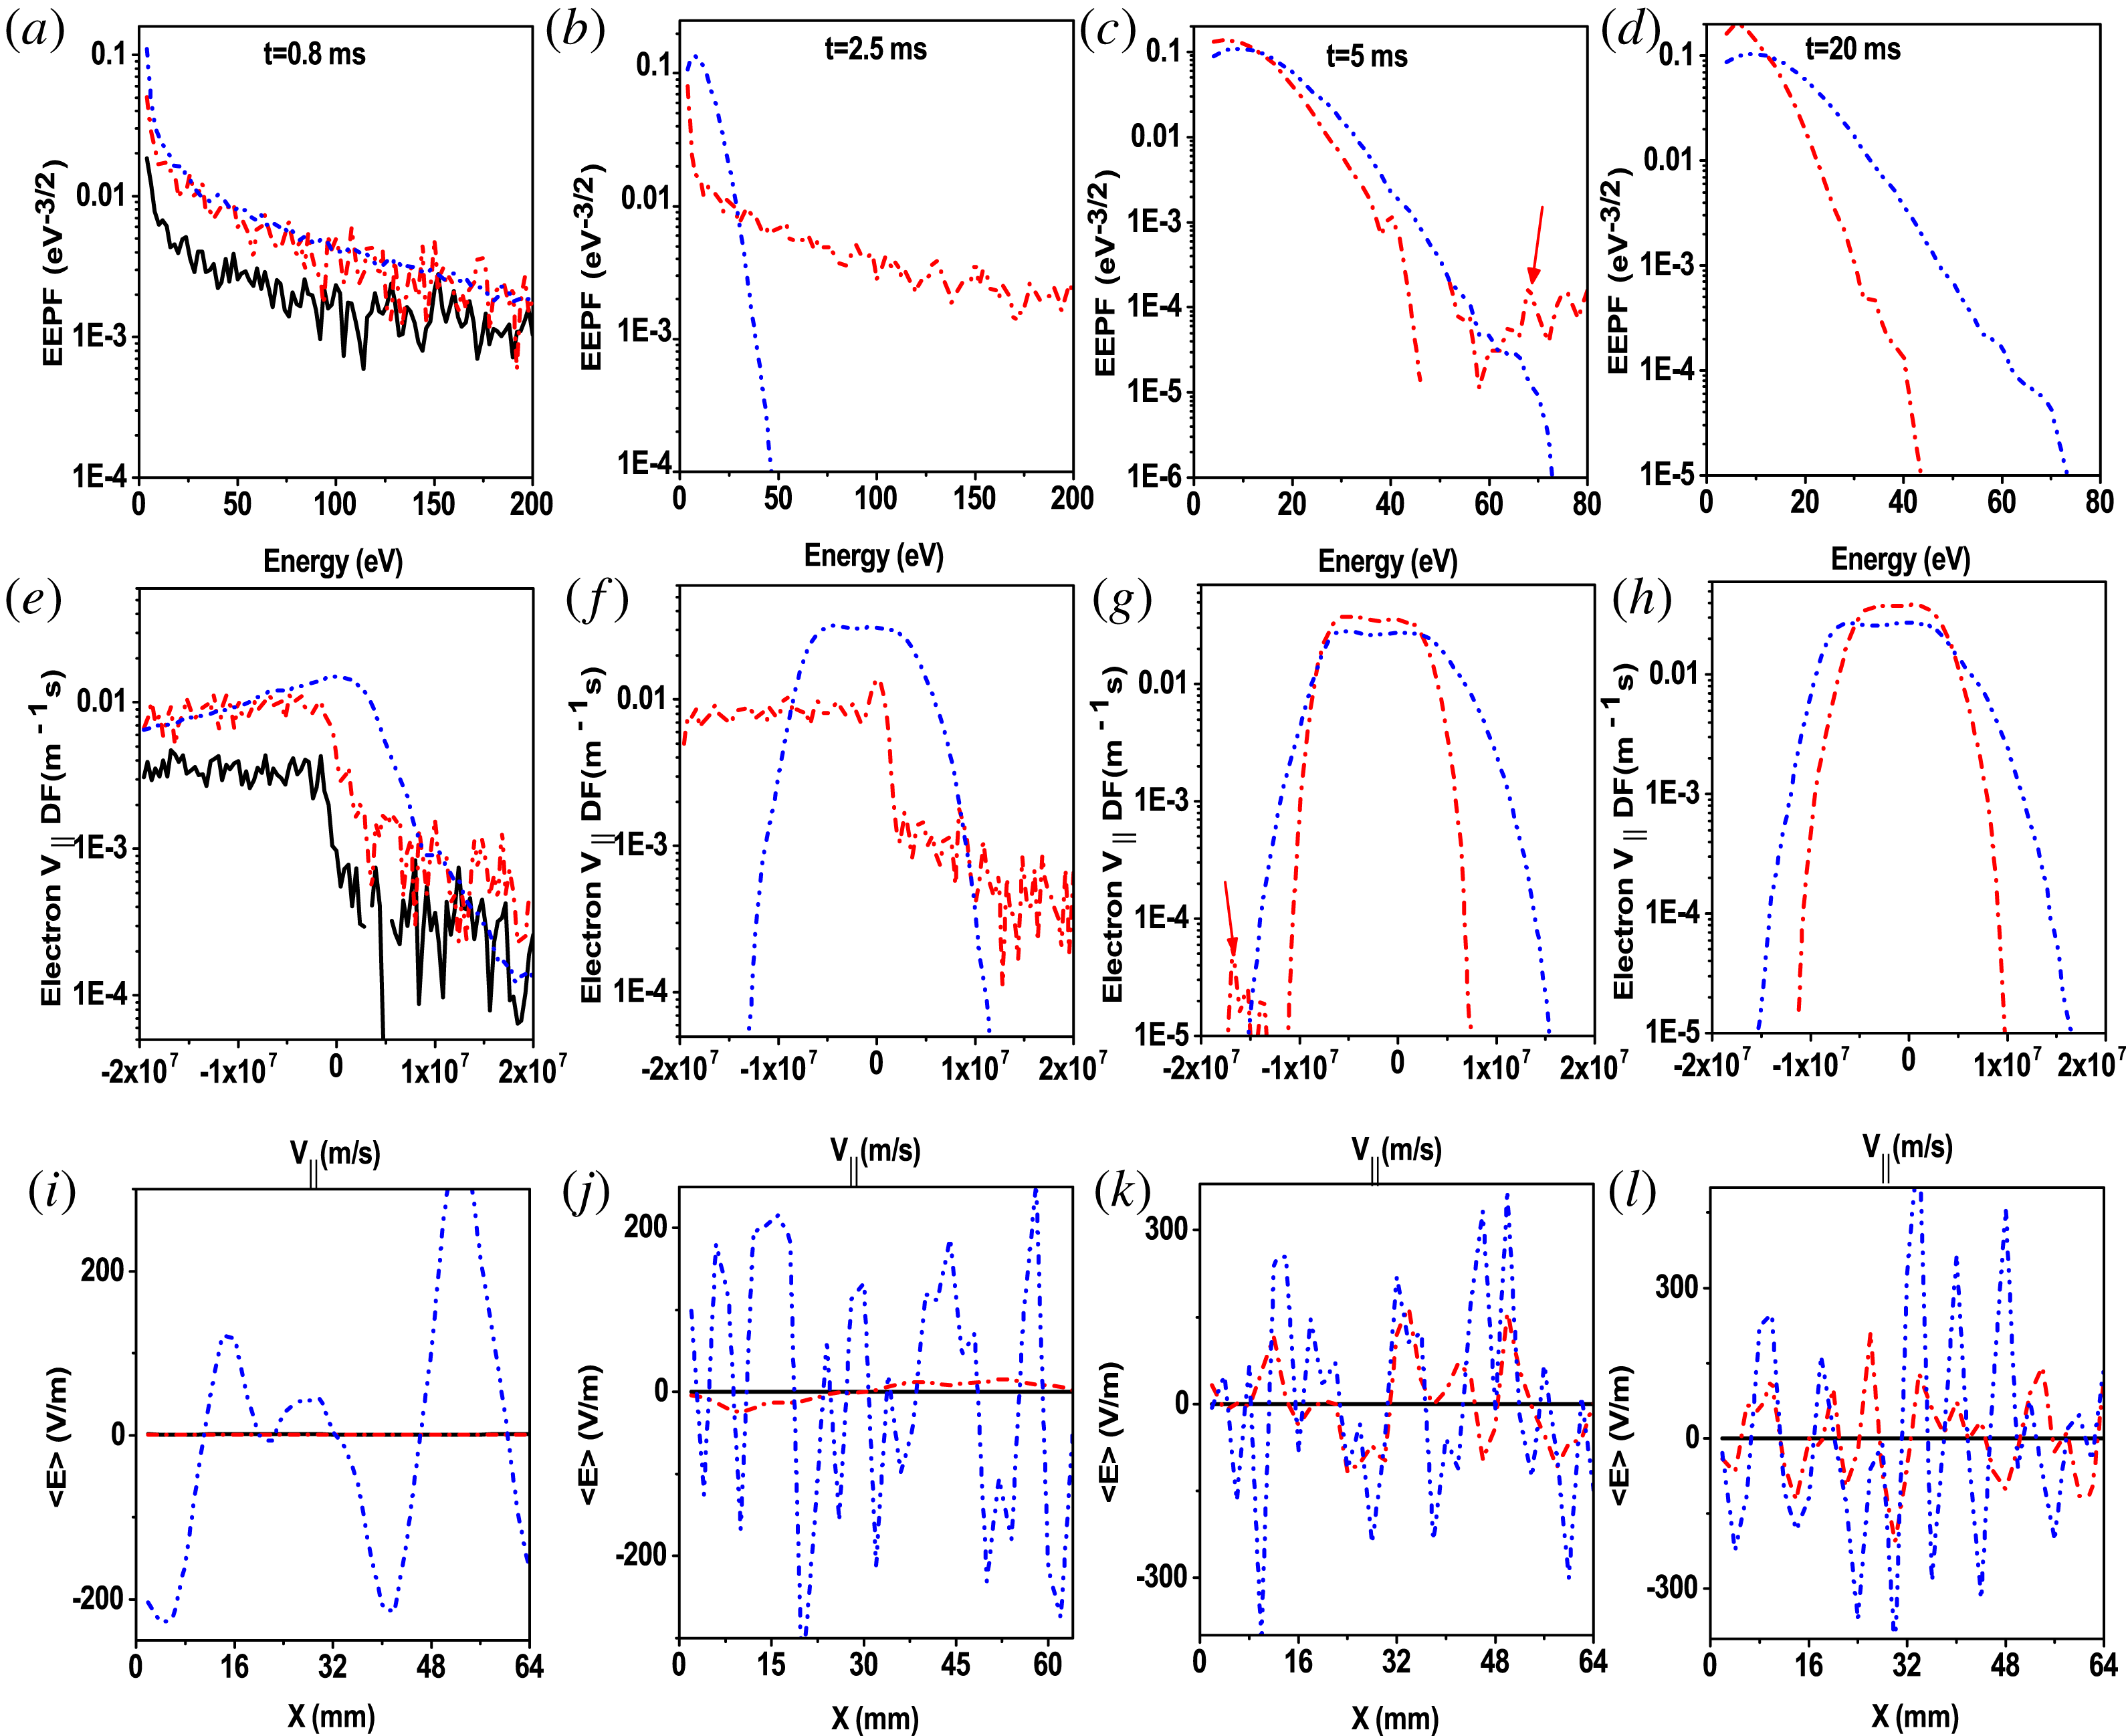
Figure 10. Time-averaged electron energy probability function (EEPF) at (a) $t=0.8$
ms (b)
$t=0.8$
ms (b) $t=2.5$
ms (c)
$t=2.5$
ms (c) $t=5$
ms (d)
$t=5$
ms (d) $t=20$
ms, electron parallel velocity distribution function (
$t=20$
ms, electron parallel velocity distribution function ( $V_{\Vert }DF$
) at (e)
$V_{\Vert }DF$
) at (e) $t=0.8$
ms (f)
$t=0.8$
ms (f) $t=2.5$
ms (g)
$t=2.5$
ms (g) $t=5$
ms (h)
$t=5$
ms (h) $t=20$
ms and time-averaged electric field at (i)
$t=20$
ms and time-averaged electric field at (i) $t=0.8$
ms (j)
$t=0.8$
ms (j) $t=2.5$
ms (k)
$t=2.5$
ms (k) $t=5$
ms (l)
$t=5$
ms (l) $t=20$
ms, for strong runaway (black solid,
$t=20$
ms, for strong runaway (black solid, $E=1.0~\text{V}~\text{m}^{-1}$
,
$E=1.0~\text{V}~\text{m}^{-1}$
, $p=1.33\times 10^{-4}$
Pa), weak runaway (red dash,
$p=1.33\times 10^{-4}$
Pa), weak runaway (red dash, $E=0.3~\text{V}~\text{m}^{-1}$
,
$E=0.3~\text{V}~\text{m}^{-1}$
, $p=1.33\times 10^{-4}$
Pa), relative runaway (blue dash dot dot,
$p=1.33\times 10^{-4}$
Pa), relative runaway (blue dash dot dot, $E=1.0~\text{V}~\text{m}^{-1}$
,
$E=1.0~\text{V}~\text{m}^{-1}$
, $p=6.66\times 10^{-4}$
Pa). The strong runaway simulation is interrupted after 1 ms.
$p=6.66\times 10^{-4}$
Pa). The strong runaway simulation is interrupted after 1 ms.
The EEPF, $V_{\Vert }DF$
and time-averaged electric field during absolute and relative runaway modes are shown in figure 10. Notice that strong runaway simulation results are shown only at time
$V_{\Vert }DF$
and time-averaged electric field during absolute and relative runaway modes are shown in figure 10. Notice that strong runaway simulation results are shown only at time $t=0.8$
ms. In the initial discharge (
$t=0.8$
ms. In the initial discharge ( $t=0.8$
ms), the EEPF shows that electrons are mainly accelerated by the external electric field and there is a large number of superthermal electrons. However, with the discharge, electrons are accelerated to become runaway electrons due to the strong ohmic heating, as well as the low collision frequency originating from the low pre-filling pressure, so all electrons are lost, leading to the collapse of the simulation. In the other two cases, as the discharge proceeds, various radiation and ionization collisions occur since the electron energy is over the collision threshold. Accordingly, electron energy decreases due to collisions, as shown by the EEPFs from figure 10(b,c) for weak runaway mode (red line) and from figure 10(a,b) for relative runaway mode (blue line). Note in figure 10(c) a bulge, pointed at by the red arrow, shows that there is a high energy tail which can easily produce runaway electron, which is the same in figure 10(g).
$t=0.8$
ms), the EEPF shows that electrons are mainly accelerated by the external electric field and there is a large number of superthermal electrons. However, with the discharge, electrons are accelerated to become runaway electrons due to the strong ohmic heating, as well as the low collision frequency originating from the low pre-filling pressure, so all electrons are lost, leading to the collapse of the simulation. In the other two cases, as the discharge proceeds, various radiation and ionization collisions occur since the electron energy is over the collision threshold. Accordingly, electron energy decreases due to collisions, as shown by the EEPFs from figure 10(b,c) for weak runaway mode (red line) and from figure 10(a,b) for relative runaway mode (blue line). Note in figure 10(c) a bulge, pointed at by the red arrow, shows that there is a high energy tail which can easily produce runaway electron, which is the same in figure 10(g).
The electron $V_{\Vert }DF$
values in figure 10(e,f) are in agreement with the EEPF in figure 10(a,b). At the beginning the external electric field dominates (see figure 10
i,j), so the
$V_{\Vert }DF$
values in figure 10(e,f) are in agreement with the EEPF in figure 10(a,b). At the beginning the external electric field dominates (see figure 10
i,j), so the $V_{\Vert }DF$
values are mainly centred on the left. Then, as the plasma density increases, the ambipolar diffusion field begins to take effect, it drag ions to be accelerated and the peak of
$V_{\Vert }DF$
values are mainly centred on the left. Then, as the plasma density increases, the ambipolar diffusion field begins to take effect, it drag ions to be accelerated and the peak of $V_{\Vert }DF$
is dragged rightwards. In figure 10(g) the peak that the red arrow points at represents the electron drift and the corresponding drift velocity is approximately
$V_{\Vert }DF$
is dragged rightwards. In figure 10(g) the peak that the red arrow points at represents the electron drift and the corresponding drift velocity is approximately $7\times 10^{6}~\text{m}~\text{s}^{-1}$
, which can easily develop into a runaway current. Generally, in normal breakdown discharges, the drift velocity is much smaller (see the black line in figure 9(g) with
$7\times 10^{6}~\text{m}~\text{s}^{-1}$
, which can easily develop into a runaway current. Generally, in normal breakdown discharges, the drift velocity is much smaller (see the black line in figure 9(g) with $E=0.3~\text{V}~\text{m}^{-1}$
,
$E=0.3~\text{V}~\text{m}^{-1}$
, $p=1.33\times 10^{-3}$
Pa). The average electric field in figure 10(i) also illustrates that at the beginning the external electric field is dominant and as the discharge proceeds, the ambipolar diffusion field increases fast and finally surpasses the
$p=1.33\times 10^{-3}$
Pa). The average electric field in figure 10(i) also illustrates that at the beginning the external electric field is dominant and as the discharge proceeds, the ambipolar diffusion field increases fast and finally surpasses the $E_{\text{ind}}$
.
$E_{\text{ind}}$
.
3.4 Mechanism of different breakdown modes
A comparison of different breakdown modes is shown in table 1. The values of the electron density, averaged electron energy, ohmic heating rate in the different cases are provided. The considerations on the energy balance mechanism refer to the end of the simulation. Notice that, with respect to the sketch of figure 1, only the sub-modes relative to ‘absolute’ behaviour are investigated in the table. ‘Relative’ no-breakdown and ‘relative’ runaway scenarios are neglected for the sake of clarity.
Table 1. Plasma parameters under different discharge modes.
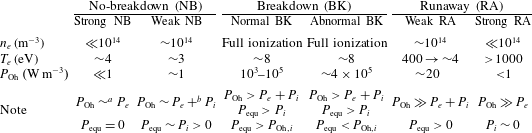
a $P_{e}$
refers to electron collision loss
$P_{e}$
refers to electron collision loss $P_{iz}+P_{\text{rad}}$
.
$P_{iz}+P_{\text{rad}}$
.
b $P_{i}$
refers to ion collision loss
$P_{i}$
refers to ion collision loss $P_{\text{cx}}+P_{\text{ela}}$
which represent charge exchange collision loss and elastic collision loss for ion-neutral, respectively.
$P_{\text{cx}}+P_{\text{ela}}$
which represent charge exchange collision loss and elastic collision loss for ion-neutral, respectively.
One can see that in the no-breakdown mode the plasma density is low in both the strong and weak no-breakdown modes, and never over $10^{15}~\text{m}^{-3}$
. The average electron energy is also low, only several eV. This is lower than the ionization threshold, so the electron density cannot increase to high values and the breakdown fails. Correspondingly, the ohmic heating will not be high. On the other hand, no-breakdown often happens in two cases: low electric field and high pressure. Low electric field leads to a low ohmic heating rate. High pressure leads to a larger energy loss with respect to the successful breakdown and runaway cases. This is due to the fact that the heating provided by ohmic mechanisms is dissipated by various types of collisions, either electron collisions with the gas or electron and ion collisions with neutral gas. In successful breakdown modes, the neutral gas is ionized fully due to ohmic heating rates far larger than those in no-breakdown modes. At the end of breakdown the average electron energy can be 8 eV, which compares well with theoretical predictions (Papoular Reference Papoular1976). In runaway modes, the avalanche cannot be finished. It either stops at the first stage or the transition stage, so the electron density will not be high (
$10^{15}~\text{m}^{-3}$
. The average electron energy is also low, only several eV. This is lower than the ionization threshold, so the electron density cannot increase to high values and the breakdown fails. Correspondingly, the ohmic heating will not be high. On the other hand, no-breakdown often happens in two cases: low electric field and high pressure. Low electric field leads to a low ohmic heating rate. High pressure leads to a larger energy loss with respect to the successful breakdown and runaway cases. This is due to the fact that the heating provided by ohmic mechanisms is dissipated by various types of collisions, either electron collisions with the gas or electron and ion collisions with neutral gas. In successful breakdown modes, the neutral gas is ionized fully due to ohmic heating rates far larger than those in no-breakdown modes. At the end of breakdown the average electron energy can be 8 eV, which compares well with theoretical predictions (Papoular Reference Papoular1976). In runaway modes, the avalanche cannot be finished. It either stops at the first stage or the transition stage, so the electron density will not be high ( ${<}10^{15}~\text{m}^{-3}$
). However, for strong runaway discharge, the average electron energy can be thousands of eV. For the weak runaway mode, it can be several hundreds of eV, so some electrons will run away and some will collide with the neutral gas. Finally, the average electron energy decreases greatly, to only several eV.
${<}10^{15}~\text{m}^{-3}$
). However, for strong runaway discharge, the average electron energy can be thousands of eV. For the weak runaway mode, it can be several hundreds of eV, so some electrons will run away and some will collide with the neutral gas. Finally, the average electron energy decreases greatly, to only several eV.
Understanding the several competing physical mechanisms at work during breakdown will result in a deeper understanding of tokamak start-up processes. Here, we review the mechanisms that we have identified in this and in previous works.
The heating power from the toroidal electric field, that we indicate as $P_{\text{Oh}}$
, mostly results in electron, rather than ion, heating due to their much smaller mass. Electrons gain energy as a whole from the applied electric field. Electrons lose energy from the ambipolar field,
$P_{\text{Oh}}$
, mostly results in electron, rather than ion, heating due to their much smaller mass. Electrons gain energy as a whole from the applied electric field. Electrons lose energy from the ambipolar field, $P_{\text{equ}}$
, (or from Coulomb collisions in some studies) and from collisions with the gas. We indicate energy losses from collisions as
$P_{\text{equ}}$
, (or from Coulomb collisions in some studies) and from collisions with the gas. We indicate energy losses from collisions as $P_{e}$
and
$P_{e}$
and $P_{i}$
for electrons and ions respectively. Collisions change the direction of the velocity, heat the particles, trigger ionization, but also dissipate part of the energy. Also the magnetic field changes the velocity direction, but the energy is conserved. The ions can be heated either by the applied electric field or by the ambipolar field (Jiang et al.
Reference Jiang, Peng, Zhang and Lapenta2016). In most cases, the ions can gain some energy directly from
$P_{i}$
for electrons and ions respectively. Collisions change the direction of the velocity, heat the particles, trigger ionization, but also dissipate part of the energy. Also the magnetic field changes the velocity direction, but the energy is conserved. The ions can be heated either by the applied electric field or by the ambipolar field (Jiang et al.
Reference Jiang, Peng, Zhang and Lapenta2016). In most cases, the ions can gain some energy directly from $E_{\text{ind}}$
at early times, when the density is low. However, when the density is high, ions are effectively heated by
$E_{\text{ind}}$
at early times, when the density is low. However, when the density is high, ions are effectively heated by $E_{\text{ambi}}$
.
$E_{\text{ambi}}$
.
No breakdown modes occur when all the input energy from the toroidal electric field is dissipated by collisional processes. The energy dissipation mechanism for electrons are excitation and ionization collisions, while for ions they are charge exchange and elastic collisions. The plasma density, current and energy increase only when the input electric energy is larger than the energy loss by collisions. Otherwise, full ionization is not achieved. These considerations help us shed new light on the cases when no breakdown is achieved: (i) if all the input energy is dissipated by electron collisions, $P_{\text{Oh}}\sim P_{e}$
in table 1, the system is in strong no-breakdown mode; (ii) if all the input energy is dissipated by both electron and ion collisions, the system is in weak no-breakdown mode,
$P_{\text{Oh}}\sim P_{e}$
in table 1, the system is in strong no-breakdown mode; (ii) if all the input energy is dissipated by both electron and ion collisions, the system is in weak no-breakdown mode, $P_{\text{Oh}}\sim P_{e}+P_{i}$
; (iii) if a significant amount, but not all of the energy is dissipated by electron and ion collisions we are in relative no-breakdown mode. In this case, the long delays mentioned in § 3.1 will appear and the plasma density and energy will increase slowly. Note that in this case other dissipation methods not included in this work, such as particle convection and impurities, will play a role in energy dissipation.
$P_{\text{Oh}}\sim P_{e}+P_{i}$
; (iii) if a significant amount, but not all of the energy is dissipated by electron and ion collisions we are in relative no-breakdown mode. In this case, the long delays mentioned in § 3.1 will appear and the plasma density and energy will increase slowly. Note that in this case other dissipation methods not included in this work, such as particle convection and impurities, will play a role in energy dissipation.
Runaway mode occurs when the collisional drag force is much smaller than the electric field, and/or the electron thermalization by the collisions is not complete. REs can be generated in these cases, which should be avoided because they disrupt tokamak devices. Significant work has been done to prevent REs in ITER (Putvinski et al.
Reference Putvinski, Barabaschi, Fujisawa, Putvinskaya, Rosenbluth and Wesley1997; Boozer Reference Boozer2015, Reference Boozer2017). The Dreicer generation (Connor & Hastie Reference Connor and Hastie1975), hot tails (Smith & Verwichte Reference Smith and Verwichte2008; Zeng et al.
Reference Zeng, Chen, Dong, Koslowski, Liang, Zhang, Zhuang, Huang and Gao2017) and avalanche mechanisms (Jayakumar, Fleischmann & Zweben Reference Jayakumar, Fleischmann and Zweben1993; Rosenbluth & Putvinski Reference Rosenbluth and Putvinski1997) are three main runaway generation processes. The Dreicer mechanism plays a major role when the collisional drag force on an energetic electron is less than the driving force by the toroidal electric field. Before tokamak disruption, the plasma is fully ionized, therefore the collisional drag force is from the Coulomb collisions. However, during the tokamak breakdown, the plasma is partially ionized. The drag force has two origins: electron/ion collisions and Coulomb collisions. Therefore, we can distinguish runaway modes as follows: (i) if the drag force from electron collisions with the neutrals is much smaller than the electric field force ( $P_{\text{Oh}}\geqslant P_{e}$
) and the drag force from the ion collisions with the neutrals is close to 0 (
$P_{\text{Oh}}\geqslant P_{e}$
) and the drag force from the ion collisions with the neutrals is close to 0 ( $P_{i}\sim 0$
), the discharge is in strong absolute runaway mode; if the sum of electron/ion collisions with neutrals and Coulomb collisions is small (
$P_{i}\sim 0$
), the discharge is in strong absolute runaway mode; if the sum of electron/ion collisions with neutrals and Coulomb collisions is small ( $P_{\text{Oh}}\geqslant P_{e}+P_{i}$
) and the ambipolar field takes effect (
$P_{\text{Oh}}\geqslant P_{e}+P_{i}$
) and the ambipolar field takes effect ( $P_{\text{equ}}>0$
), the discharge is in weak runaway mode. (ii) If the thermalization of the electrons by the collisions is incomplete, the discharge is in relative runaway mode. Note here other factors, like the drifting motion and stray field, will also contribute, but are not included here.
$P_{\text{equ}}>0$
), the discharge is in weak runaway mode. (ii) If the thermalization of the electrons by the collisions is incomplete, the discharge is in relative runaway mode. Note here other factors, like the drifting motion and stray field, will also contribute, but are not included here.
Successful breakdown requires two conditions: (i) the input energy should be larger than the collisional dissipation ( $P_{\text{Oh}}>P_{e}+P_{i}$
), so that the plasma density, current and energy can increase. This sets a lower limit for the electric field and an upper limit for the pressure. (ii) The collisional drag force should not be too small, so that electrons can be effectively thermalized but not run away. This sets an upper limit for the electric field and a lower limit for the pressure. If
$P_{\text{Oh}}>P_{e}+P_{i}$
), so that the plasma density, current and energy can increase. This sets a lower limit for the electric field and an upper limit for the pressure. (ii) The collisional drag force should not be too small, so that electrons can be effectively thermalized but not run away. This sets an upper limit for the electric field and a lower limit for the pressure. If $E_{\text{ind}}$
is so high that
$E_{\text{ind}}$
is so high that $E_{\text{ambi}}$
cannot exceed it (
$E_{\text{ambi}}$
cannot exceed it ( $P_{\text{equ}}<P_{\text{Oh},i}$
), the discharge is in abnormal breakdown mode.
$P_{\text{equ}}<P_{\text{Oh},i}$
), the discharge is in abnormal breakdown mode.
Our conclusions are validated by experimental evidence. For example, experiments (Song et al.
Reference Song, Song, Xia, Mao, Wang, Zhang and Chen2014) of tokamak start-up on HL-2A show that both high and low pre-filling pressures will cause the failure of discharge. Also, when the pre-filling pressure is low ( $p\leqslant 6.66\times 10^{-4}$
Pa), runaway electrons will be generated, as we showed in § 3.3 when discussing the runaway mode. Furthermore, the breakdown will be delayed both under high and low pressure conditions, which means a prompt discharge can be obtained only within an appropriate pre-filling pressure range. What is more, when the electric field is low, the build-up of initial ionization is quite slow, which will cost significant volt-seconds. It is now clear that, for successful breakdown, the appropriate values of induced electric field and pre-filling pressure should be selected. We notice that theoretical work (Hutchinson & Strachan Reference Hutchinson and Strachan1974) and experiments (Gusev et al.
Reference Gusev, Burtseva, Dech, Gavrilov, Golant, Krikunov, Levin, Minaev, Mineev and Minyaev2001) have verified that breakdown can be optimized by using proper stray magnetic field compensation which will be considered in our future work.
$p\leqslant 6.66\times 10^{-4}$
Pa), runaway electrons will be generated, as we showed in § 3.3 when discussing the runaway mode. Furthermore, the breakdown will be delayed both under high and low pressure conditions, which means a prompt discharge can be obtained only within an appropriate pre-filling pressure range. What is more, when the electric field is low, the build-up of initial ionization is quite slow, which will cost significant volt-seconds. It is now clear that, for successful breakdown, the appropriate values of induced electric field and pre-filling pressure should be selected. We notice that theoretical work (Hutchinson & Strachan Reference Hutchinson and Strachan1974) and experiments (Gusev et al.
Reference Gusev, Burtseva, Dech, Gavrilov, Golant, Krikunov, Levin, Minaev, Mineev and Minyaev2001) have verified that breakdown can be optimized by using proper stray magnetic field compensation which will be considered in our future work.
4 Physical constraints of tokamak breakdown
4.1 Electric field and pressure limits
It is interesting to analyse when successful breakdown is achieved under different operational parameters. Following Lloyd’s work, we have performed a thorough scan of the parameters and we show in figure 11 when no-breakdown (black squares), successful breakdown(red circles) and runaway (blue diamonds) are obtained as a function of the induced electric field and pre-filling pressure. Note that here both the relative no-breakdown and runaway modes will still be plotted as red circles according to the criterion we have discussed above, as there are continuous transitions between different modes. Since these breakdown patterns have been discussed in detail above, here we mainly discuss the parameter spaces, which represent the fundamental physics constraints of Tokamak operations.
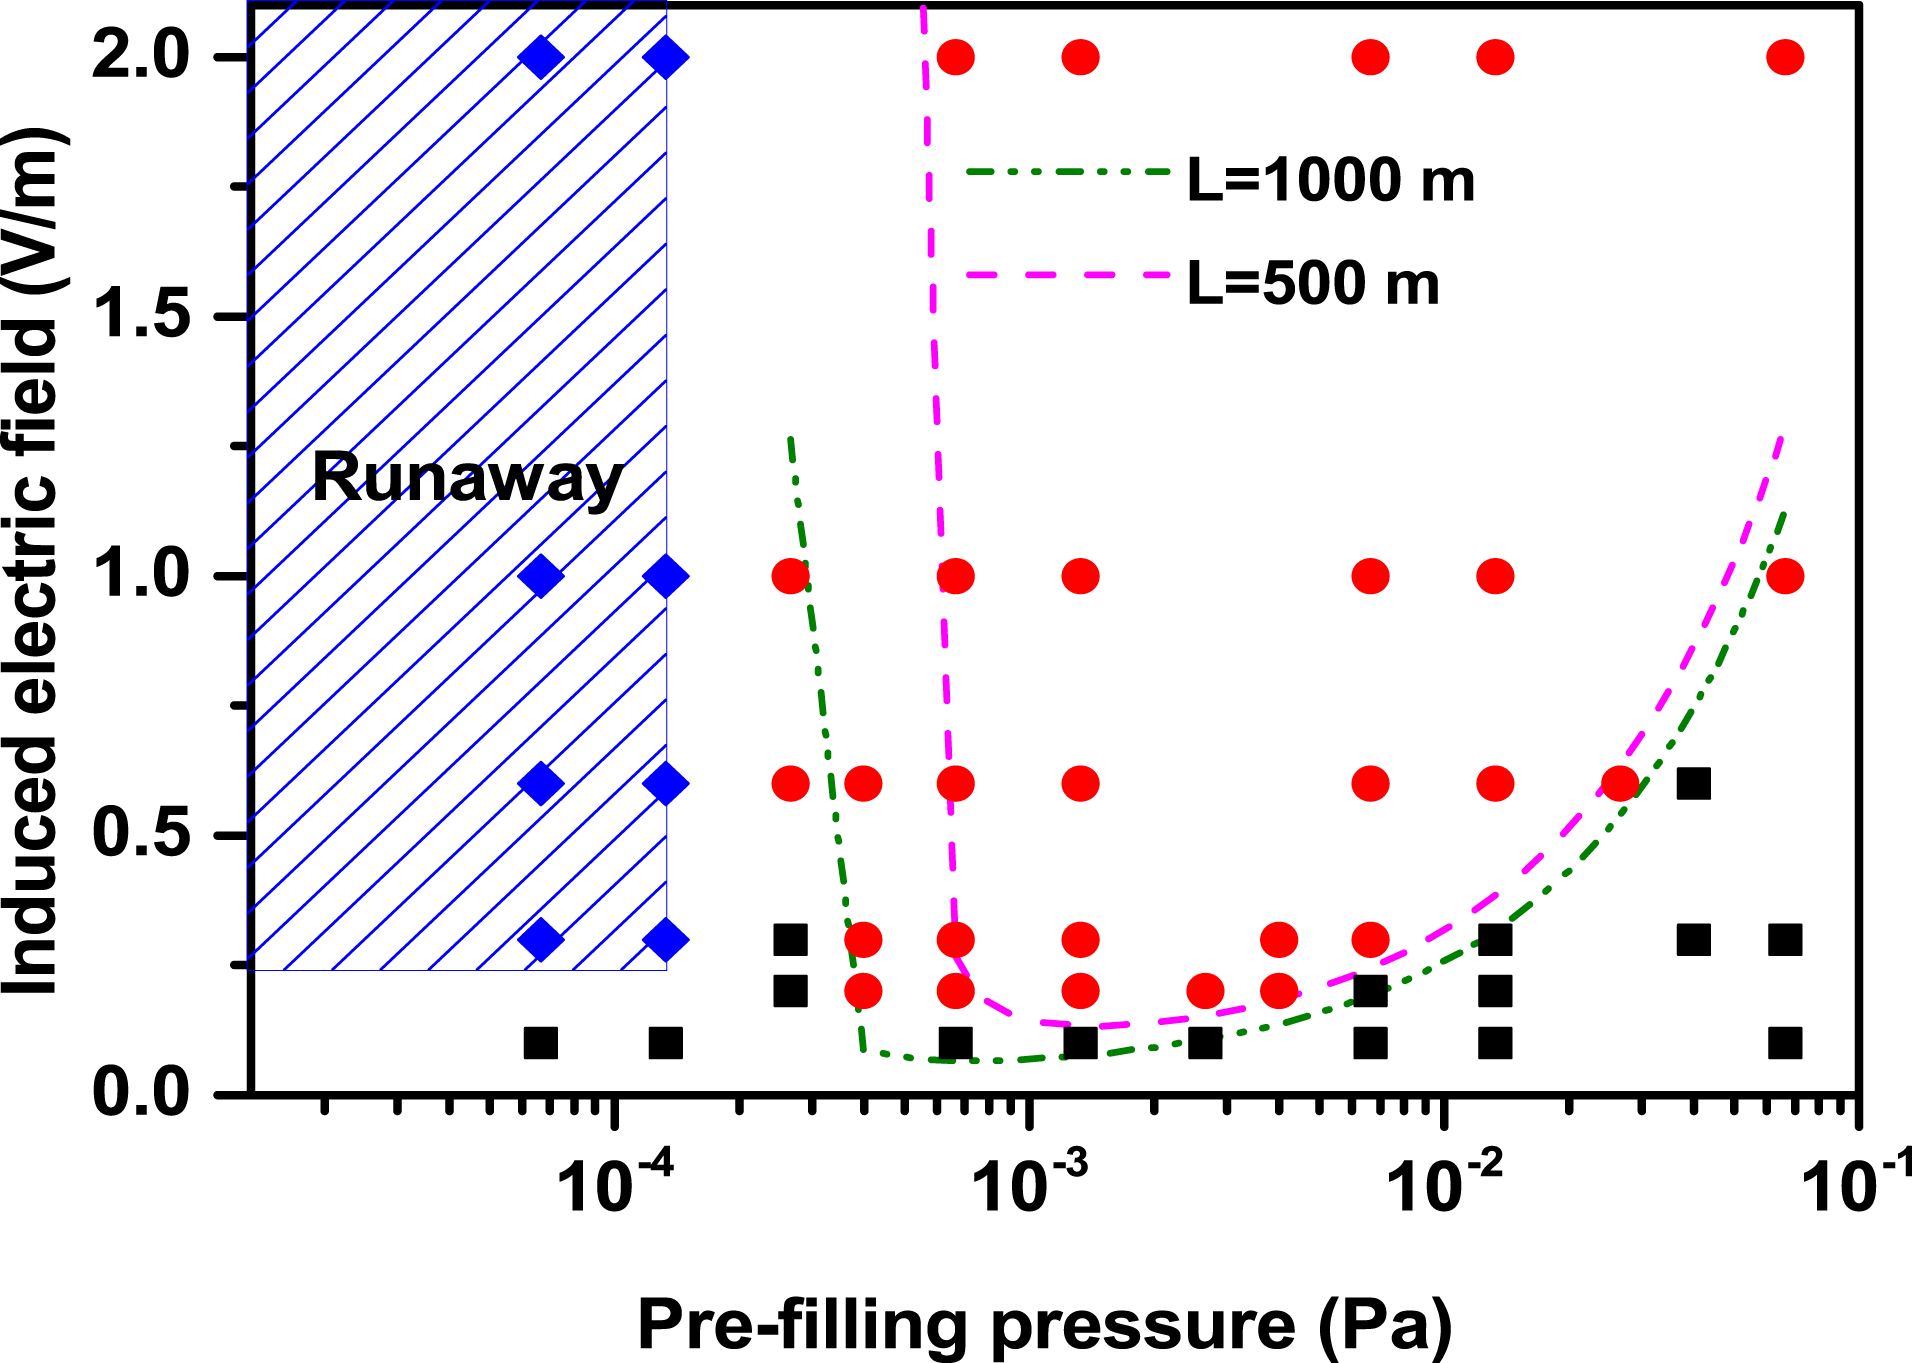
Figure 11. Occurrence of the three types of breakdown as a function of the pre-filling pressure and induced electric field. No breakdown is marked as black squares, successful breakdown as red circles, runaway as blue diamonds. The minimum electric field for breakdown as a function of the pre-filling pressure is shown for a connection length $L=500$
m in olive, for
$L=500$
m in olive, for $L=1000$
m in magenta.
$L=1000$
m in magenta.
In figure 11, we show two reference lines predicted by Lloyd’s theory (Lloyd et al.
Reference Lloyd, Jackson, Taylor, Lazarus, Luce and Prater1991), which represent the minimum electric field necessary for successful breakdown in deuterium as a function of the pre-filling pressure for various connection lengths. When the pressure is given, the minimum electric field $E_{\text{min}}$
is
$E_{\text{min}}$
is
 $$\begin{eqnarray}E_{\text{min}}~(\text{V}~\text{m}^{-1})=\frac{1.25\times 10^{4}p~(\text{torr})}{\ln [510p~(\text{torr})\,L~(\text{m})]}.\end{eqnarray}$$
In (4.1) $L$
denotes the connection length. One can see that our parameter ranges for successful breakdown are included by the olive dashed line. From this figure one can see that for ITER (
$L$
denotes the connection length. One can see that our parameter ranges for successful breakdown are included by the olive dashed line. From this figure one can see that for ITER ( $E\leqslant 0.3~\text{V}~\text{m}^{-1}$
) the condition of
$E\leqslant 0.3~\text{V}~\text{m}^{-1}$
) the condition of $L\geqslant 500~\text{m}$
must be met to achieve successful breakdown. This is consistent with Lloyd’s theory and is confirmed for the first time with simulations in our work. From this line, we can see that in low electric field regimes the pre-filling pressure range in which breakdown is possible is very narrow. To give an example, when the electric field is
$L\geqslant 500~\text{m}$
must be met to achieve successful breakdown. This is consistent with Lloyd’s theory and is confirmed for the first time with simulations in our work. From this line, we can see that in low electric field regimes the pre-filling pressure range in which breakdown is possible is very narrow. To give an example, when the electric field is $0.3~\text{V}~\text{m}^{-1}$
, the values of pre-filling pressure that produce successful breakdown are between
$0.3~\text{V}~\text{m}^{-1}$
, the values of pre-filling pressure that produce successful breakdown are between $6.66\times 10^{-4}$
and
$6.66\times 10^{-4}$
and $6.66\times 10^{-3}$
Pa, in good agreement with the magenta line. Since the electric field condition in ITER is
$6.66\times 10^{-3}$
Pa, in good agreement with the magenta line. Since the electric field condition in ITER is $E\leqslant 0.3~\text{V}~\text{m}^{-1}$
, we can conclude that ITER breakdown using purely ohmic heating is only possible in a narrow pre-filling pressure range and in a low pre-filling pressure regime. We should emphasize here that
$E\leqslant 0.3~\text{V}~\text{m}^{-1}$
, we can conclude that ITER breakdown using purely ohmic heating is only possible in a narrow pre-filling pressure range and in a low pre-filling pressure regime. We should emphasize here that $L$
is just a good fitting parameter, and in our model we have implicitly assumed that the reconnection length is infinite, as we have discussed in our last paper (Jiang et al.
Reference Jiang, Peng, Zhang and Lapenta2016).
$L$
is just a good fitting parameter, and in our model we have implicitly assumed that the reconnection length is infinite, as we have discussed in our last paper (Jiang et al.
Reference Jiang, Peng, Zhang and Lapenta2016).
When the electric field applied becomes lower, the available pre-filling pressure range shifts to lower pressure, which is easy to explain: in a low pressure regime collisions (which dissipate energy and therefore act against successful breakdown) decrease to a frequency low enough that electrons can be heated efficiently and neutrals can be easily ionized. Conversely, in a high pressure regime, the successful breakdown is possible only if the electric field is large enough to energize electrons to ionize neutrals, taking into account the energy loss resulting from a large number of collisions.
4.2 Comparison with Townsend theory
In Townsend’s theory (Raizer & Allen Reference Raizer and Allen1997), the discharge can be described completely in terms of the gas pressure and electric field. It is well known that the behaviours of disparate plasmas can have significant similarities, which are often referred to as plasma scaling laws (Mesyats Reference Mesyats2006). The induced electric field $E$
is used as the scaling parameter, and the properties of the discharge is determined by
$E$
is used as the scaling parameter, and the properties of the discharge is determined by $E/p$
, which means that increasing the electric field
$E/p$
, which means that increasing the electric field $E$
by a factor of
$E$
by a factor of $q$
has the same consequences as decreasing the gas pressure
$q$
has the same consequences as decreasing the gas pressure $p$
by a factor of
$p$
by a factor of $q$
. Townsend’s theory (originally developed for gas discharge) has also been used to describe the tokamak breakdown process (Papoular Reference Papoular1976; Lloyd et al.
Reference Lloyd, Jackson, Taylor, Lazarus, Luce and Prater1991). However, Townsend’s theory cannot explain all the breakdown behaviours in tokamak start-up. This limitation has to be addressed. For example, when the pre-filling gas pressure is very low and the electric field is high, runaway occurs. This case is not addressed by Townsend’s theory. In addition, the Townsend theory is a conventional empirical relation, which is not appropriate to elucidate the real dynamics of experiments. Yoshino et al. (Yoshino & Seki Reference Yoshino and Seki1997) have demonstrated that the electric field for achieving stable start-up is systematically larger than the value predicted by the Townsend avalanche theory.
$q$
. Townsend’s theory (originally developed for gas discharge) has also been used to describe the tokamak breakdown process (Papoular Reference Papoular1976; Lloyd et al.
Reference Lloyd, Jackson, Taylor, Lazarus, Luce and Prater1991). However, Townsend’s theory cannot explain all the breakdown behaviours in tokamak start-up. This limitation has to be addressed. For example, when the pre-filling gas pressure is very low and the electric field is high, runaway occurs. This case is not addressed by Townsend’s theory. In addition, the Townsend theory is a conventional empirical relation, which is not appropriate to elucidate the real dynamics of experiments. Yoshino et al. (Yoshino & Seki Reference Yoshino and Seki1997) have demonstrated that the electric field for achieving stable start-up is systematically larger than the value predicted by the Townsend avalanche theory.
Table 2. Parameter comparison between Townsend discharge at 1 atmosphere and tokamak breakdown.
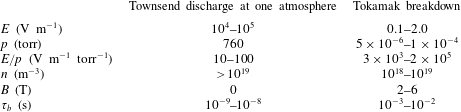
In table 2 we compare the values that several parameters assume in Townsend’s theory at 1 atmosphere and in tokamak breakdown. The tokamak values are taken from experiments. From this table, it is obvious that there is a great discrepancy between Townsend discharge at one atmosphere and tokamak breakdown. According to Townsend’s discharge theory, the electric field is very high due to the high pressure. The breakdown time is much shorter than in tokamak breakdown. One also has to remark that there is no magnetic field in Townsend discharge, while in tokamaks the plasma is strongly magnetized, which will lead to wide differences in plasma behaviour. Indeed, our simulations have found that the $E/p$
relation cannot be used to predict the discharge mode and parameter limits in tokamak breakdown, as can be seen in figure 11. For the no-breakdown mode,
$E/p$
relation cannot be used to predict the discharge mode and parameter limits in tokamak breakdown, as can be seen in figure 11. For the no-breakdown mode, $E/p$
can be quite high, e.g.
$E/p$
can be quite high, e.g. $4\times 10^{5}~\text{V}~\text{m}^{-1}~\text{torr}^{-1}$
or low to
$4\times 10^{5}~\text{V}~\text{m}^{-1}~\text{torr}^{-1}$
or low to $3\times 10^{3}~\text{V}~\text{m}^{-1}~\text{torr}^{-1}$
. However, some of the successful breakdown simulations, identified by red circles in figure 11, can also reach those same values. Hence,
$3\times 10^{3}~\text{V}~\text{m}^{-1}~\text{torr}^{-1}$
. However, some of the successful breakdown simulations, identified by red circles in figure 11, can also reach those same values. Hence, $E/p$
is not a reliable predictive parameter for real tokamak breakdown. Besides, from the figure 11 we can see that the breakdown will never happen when the electric field is less than
$E/p$
is not a reliable predictive parameter for real tokamak breakdown. Besides, from the figure 11 we can see that the breakdown will never happen when the electric field is less than $0.1~\text{V}~\text{m}^{-1}$
, which is inconsistent with the prediction by Townsend’s theory in Lloyd’s work (Lloyd et al.
Reference Lloyd, Carolan and Warrick1996). In addition, we found that absolute runaway mode exists at
$0.1~\text{V}~\text{m}^{-1}$
, which is inconsistent with the prediction by Townsend’s theory in Lloyd’s work (Lloyd et al.
Reference Lloyd, Carolan and Warrick1996). In addition, we found that absolute runaway mode exists at $E\geqslant 0.3~\text{V}~\text{m}^{-1}$
and
$E\geqslant 0.3~\text{V}~\text{m}^{-1}$
and $p\leqslant 1.33\times 10^{-4}$
Pa (
$p\leqslant 1.33\times 10^{-4}$
Pa ( $E/p\geqslant 3\times 10^{5}~\text{V}~\text{m}^{-1}~\text{torr}^{-1}$
).
$E/p\geqslant 3\times 10^{5}~\text{V}~\text{m}^{-1}~\text{torr}^{-1}$
).
According to Townsend’s theory, the plasma density increases exponentially during the discharge. The exponential increase of the plasma density is curbed by a competing mechanism. Indicating with $\unicode[STIX]{x1D708}$
the ionization rate and
$\unicode[STIX]{x1D708}$
the ionization rate and $\unicode[STIX]{x1D6FD}$
the loss rate, one has the following formula for the electron density as a function of the time
$\unicode[STIX]{x1D6FD}$
the loss rate, one has the following formula for the electron density as a function of the time $t$
:
$t$
:
 $$\begin{eqnarray}n_{e}(t)=n_{e0}\exp (\unicode[STIX]{x1D708}-\unicode[STIX]{x1D6FD})t.\end{eqnarray}$$
Here $n_{e0}$
is the initial seed electron density. As can be seen in § 2, the plasma density indeed increases exponentially in the fast avalanche phase. Since in our mode we neglect the particle loss, we have
$n_{e0}$
is the initial seed electron density. As can be seen in § 2, the plasma density indeed increases exponentially in the fast avalanche phase. Since in our mode we neglect the particle loss, we have $\unicode[STIX]{x1D6FD}=0$
. Then
$\unicode[STIX]{x1D6FD}=0$
. Then $\unicode[STIX]{x1D708}$
can be written as follows
$\unicode[STIX]{x1D708}$
can be written as follows
 $$\begin{eqnarray}\unicode[STIX]{x1D708}=\frac{1}{t}\ln \frac{n_{e}(t)}{n_{e0}}.\end{eqnarray}$$
Figure 12 shows the dependence of the ionization rate on the pre-filling pressure and induced electric field. We calculate $\unicode[STIX]{x1D708}$
directly from the simulations results. Note here the
$\unicode[STIX]{x1D708}$
directly from the simulations results. Note here the $\unicode[STIX]{x1D708}$
represents the first stages. It is clear that the ionization rate rises with increasing electric field at the same pre-filling pressure. The physical reason is the following: ionization happens with an electron energy above the ionization threshold, and electrons gain energy more easily at high electric field values. However, when the induced electric field is fixed, the ionization rate does not change linearly as the pre-filling pressure increases. At first it increases with the pressure and then it decreases, which means that a maximum ionization rate exists. In the low pre-filling pressure regime, ohmic heating dominates over collisions, so the ionization rate increases as the pressure increases. When the pressure increases to large values, collisions becomes dominant, a fact that decreases electron energy and makes it more difficult for electrons to ionize the neutrals: the effective ionization collisions decrease, which means that the ionization rate decreases. Moreover, with increasing induced electric field, the pre-filling pressure under which the maximum ionization is reached shifts to higher values, which means that the breakdown delay decreases with increasing electric field.
$\unicode[STIX]{x1D708}$
represents the first stages. It is clear that the ionization rate rises with increasing electric field at the same pre-filling pressure. The physical reason is the following: ionization happens with an electron energy above the ionization threshold, and electrons gain energy more easily at high electric field values. However, when the induced electric field is fixed, the ionization rate does not change linearly as the pre-filling pressure increases. At first it increases with the pressure and then it decreases, which means that a maximum ionization rate exists. In the low pre-filling pressure regime, ohmic heating dominates over collisions, so the ionization rate increases as the pressure increases. When the pressure increases to large values, collisions becomes dominant, a fact that decreases electron energy and makes it more difficult for electrons to ionize the neutrals: the effective ionization collisions decrease, which means that the ionization rate decreases. Moreover, with increasing induced electric field, the pre-filling pressure under which the maximum ionization is reached shifts to higher values, which means that the breakdown delay decreases with increasing electric field.
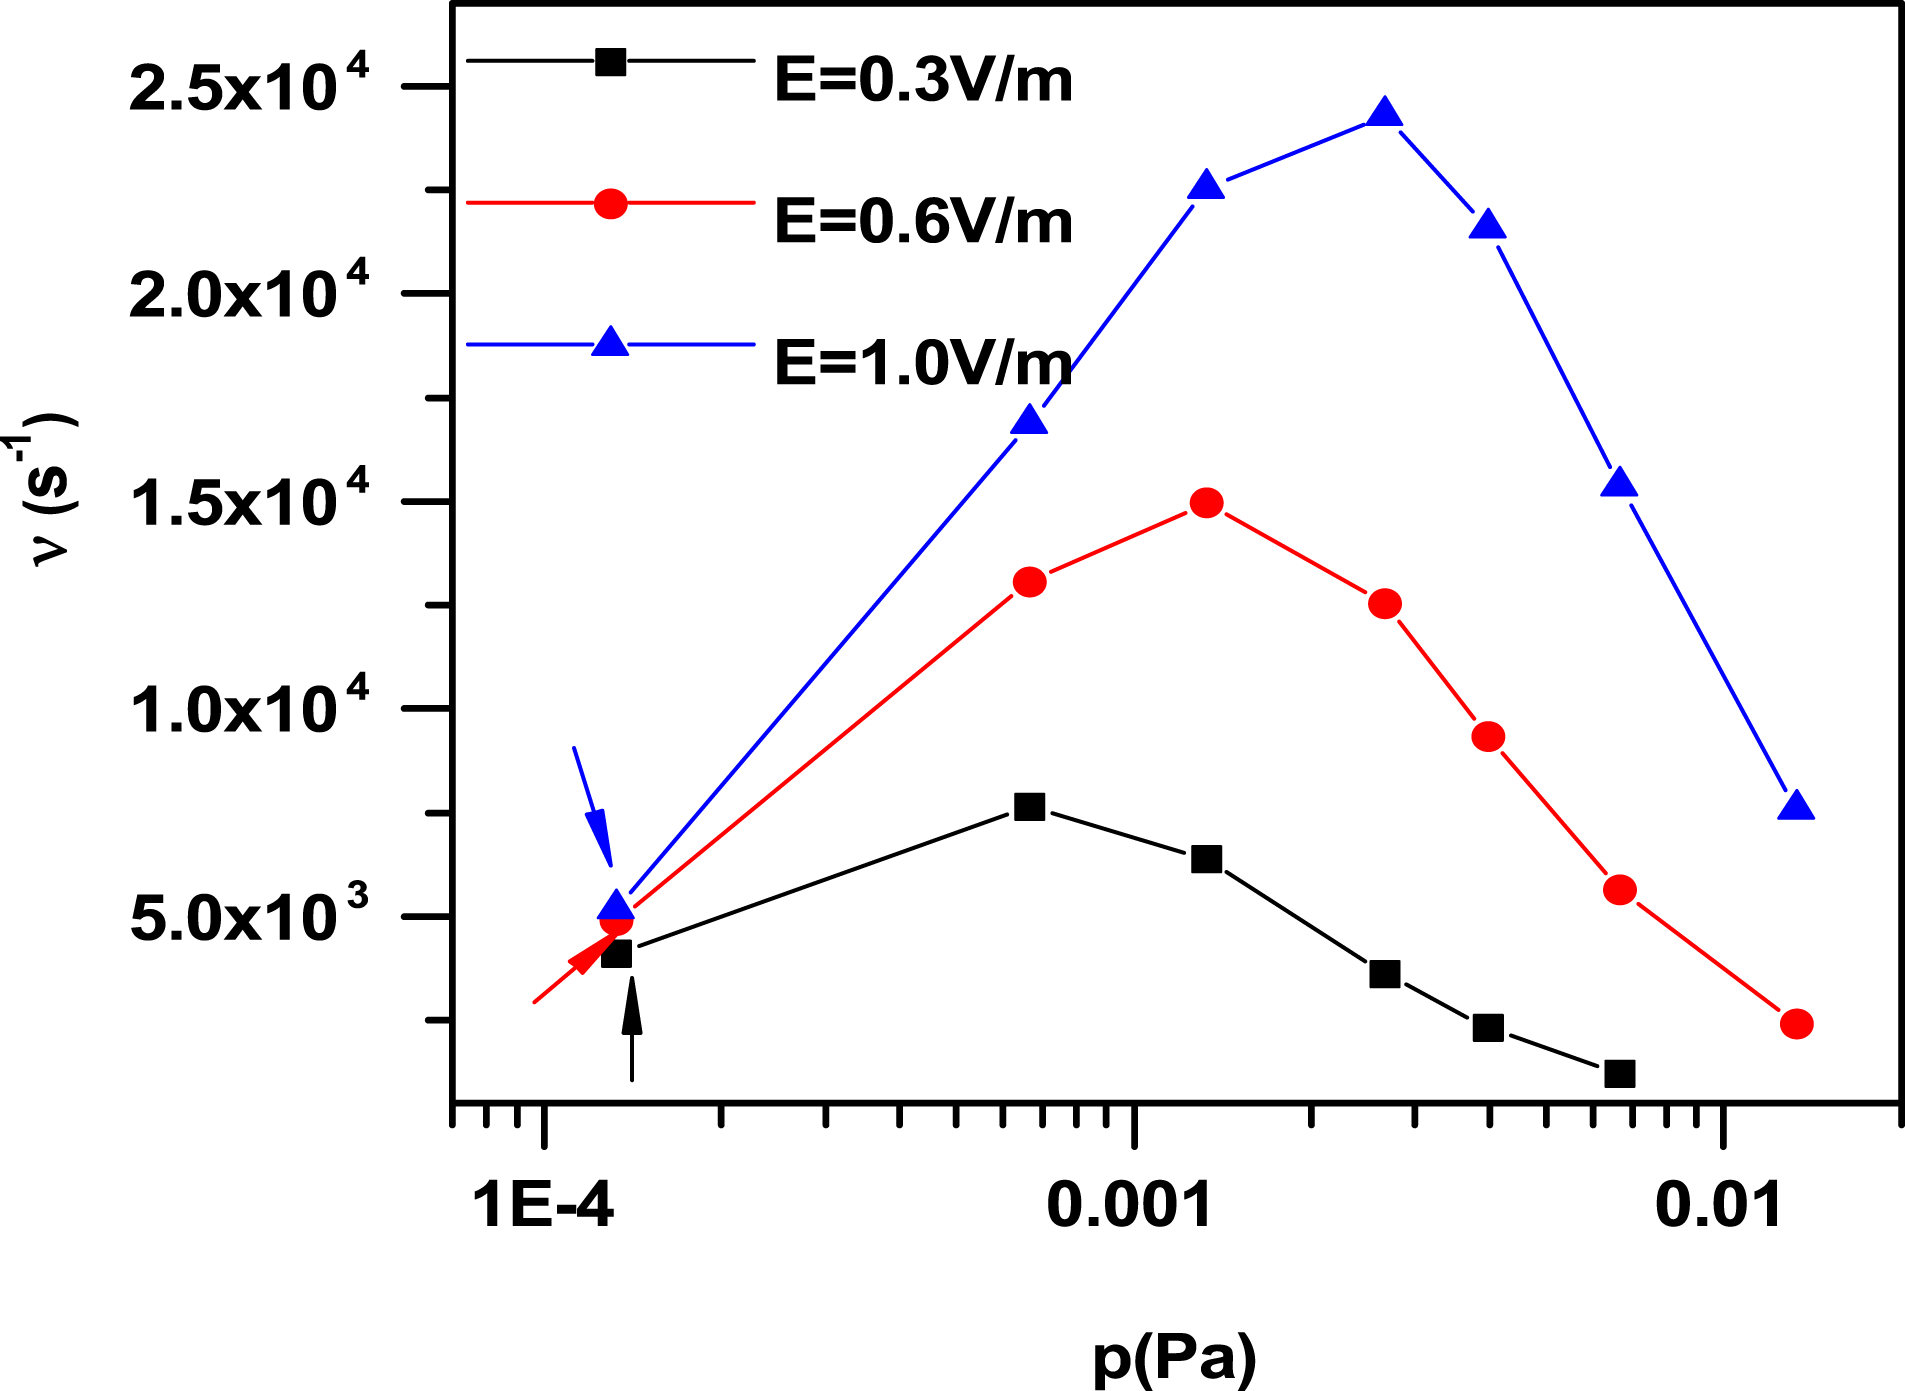
Figure 12. Ionization rate as a function of the pre-filling pressure and induced electric field during the first avalanche phase. The blue arrow represents the absolute runaway discharge mode. The red and black arrows represent the relative runaway discharge modes. Note these results are from our simulation results and not from the equations in this section.
According to Papoular’s estimation (Papoular Reference Papoular1976), the ionization rate is given by
 $$\begin{eqnarray}\unicode[STIX]{x1D708}=\unicode[STIX]{x1D6FC}v\simeq 9\times 10^{5}E~(\text{s}^{-1}).\end{eqnarray}$$
Here $\unicode[STIX]{x1D6FC}$
represents Townsend’s first coefficient,
$\unicode[STIX]{x1D6FC}$
represents Townsend’s first coefficient, $v$
is the parallel drift velocity and
$v$
is the parallel drift velocity and $E$
is the electric field. As can been seen in figure 12, the ionization rate calculated from the simulations is one order or even nearly two orders of magnitude smaller. For example, in (4.4) we make
$E$
is the electric field. As can been seen in figure 12, the ionization rate calculated from the simulations is one order or even nearly two orders of magnitude smaller. For example, in (4.4) we make $E$
equal to
$E$
equal to $1.0~\text{V}~\text{m}^{-1}$
, then
$1.0~\text{V}~\text{m}^{-1}$
, then $\unicode[STIX]{x1D708}$
is
$\unicode[STIX]{x1D708}$
is $9\times 10^{5}~\text{s}^{-1}$
which is much larger than that in figure 12 for the case of
$9\times 10^{5}~\text{s}^{-1}$
which is much larger than that in figure 12 for the case of $E=1.0~\text{V}~\text{m}^{-1}$
. The reason is that, in tokamaks, both electrons and ions are strongly magnetized. Without a magnetic field, the velocity vector of a particle is random and when the particle energy increases due to ohmic heating, the energy acquired from the electric field effectively becomes particle thermal energy. However, with a strong magnetic field, the Lorenz force pushes the particles directionally, and particle thermalization is suppressed, thus leading to a significant decrease of effective ionization. In summary, the conventional Townsend discharge model cannot be used to predict plasma breakdown in tokamak discharge accurately.
$E=1.0~\text{V}~\text{m}^{-1}$
. The reason is that, in tokamaks, both electrons and ions are strongly magnetized. Without a magnetic field, the velocity vector of a particle is random and when the particle energy increases due to ohmic heating, the energy acquired from the electric field effectively becomes particle thermal energy. However, with a strong magnetic field, the Lorenz force pushes the particles directionally, and particle thermalization is suppressed, thus leading to a significant decrease of effective ionization. In summary, the conventional Townsend discharge model cannot be used to predict plasma breakdown in tokamak discharge accurately.
4.3 Breakdown delay and volt-second consumption

Figure 13. (a) Dependence of the breakdown delay on the pre-filling pressure at different electric fields: $0.3~\text{V}~\text{m}^{-1}$
(black square),
$0.3~\text{V}~\text{m}^{-1}$
(black square), $0.6~\text{V}~\text{m}^{-1}$
(red triangle),
$0.6~\text{V}~\text{m}^{-1}$
(red triangle), $1.0~\text{V}~\text{m}^{-1}$
(blue circle) and (b) corresponding volt-second consumption as a function of pre-filling pressure. Note these results are based on our simulation results and not base on Townsend’s theory.
$1.0~\text{V}~\text{m}^{-1}$
(blue circle) and (b) corresponding volt-second consumption as a function of pre-filling pressure. Note these results are based on our simulation results and not base on Townsend’s theory.
The breakdown delay ( $t_{b}$
) is one of the key parameters that characterizes tokamak breakdown. Here, the breakdown time means the time when the
$t_{b}$
) is one of the key parameters that characterizes tokamak breakdown. Here, the breakdown time means the time when the $D_{\unicode[STIX]{x1D6FC}}$
peak occurs (Lloyd et al.
Reference Lloyd, Jackson, Taylor, Lazarus, Luce and Prater1991). In most cases, a short breakdown delay is desirable. In figure 13(a),
$D_{\unicode[STIX]{x1D6FC}}$
peak occurs (Lloyd et al.
Reference Lloyd, Jackson, Taylor, Lazarus, Luce and Prater1991). In most cases, a short breakdown delay is desirable. In figure 13(a), $t_{b}$
obtained from the simulations is plotted as a function of the pre-filling pressure during pure ohmic start-up with an induced electric field of
$t_{b}$
obtained from the simulations is plotted as a function of the pre-filling pressure during pure ohmic start-up with an induced electric field of $0.3~\text{V}~\text{m}^{-1}$
(black squares)
$0.3~\text{V}~\text{m}^{-1}$
(black squares) $0.6~\text{V}~\text{m}^{-1}$
(red triangles) and
$0.6~\text{V}~\text{m}^{-1}$
(red triangles) and $1.0~\text{V}~\text{m}^{-1}$
(blue circles). One can see that as the pre-filling pressure increases, the breakdown delay first decreases and then increases, which indicates that an optimal pre-filling pressure value for different applied electric field cases exists. We can see that when the electric field is
$1.0~\text{V}~\text{m}^{-1}$
(blue circles). One can see that as the pre-filling pressure increases, the breakdown delay first decreases and then increases, which indicates that an optimal pre-filling pressure value for different applied electric field cases exists. We can see that when the electric field is $0.3~\text{V}~\text{m}^{-1}$
(black squares in figure 13), the optimal range for the pre-filling pressure is
$0.3~\text{V}~\text{m}^{-1}$
(black squares in figure 13), the optimal range for the pre-filling pressure is $1.33\times 10^{-3}\sim 2.66\times 10^{-3}$
Pa, which is in good agreement with ITER initiation (ITER Physics Expert Group on Disruptions et al. (1999)). With an electric field of
$1.33\times 10^{-3}\sim 2.66\times 10^{-3}$
Pa, which is in good agreement with ITER initiation (ITER Physics Expert Group on Disruptions et al. (1999)). With an electric field of $0.6~\text{V}~\text{m}^{-1}$
(red triangles), the optimal pressure is approximately
$0.6~\text{V}~\text{m}^{-1}$
(red triangles), the optimal pressure is approximately $2.66\times 10^{-3}$
Pa. When the electric field is
$2.66\times 10^{-3}$
Pa. When the electric field is $1.0~\text{V}~\text{m}^{-1}$
(blue circles), the optimal pressure is near
$1.0~\text{V}~\text{m}^{-1}$
(blue circles), the optimal pressure is near $6.66\times 10^{-3}$
Pa. Our simulation results show quantitative agreement with experimental data, especially when the electric fields are
$6.66\times 10^{-3}$
Pa. Our simulation results show quantitative agreement with experimental data, especially when the electric fields are $0.4~\text{V}~\text{m}^{-1}$
,
$0.4~\text{V}~\text{m}^{-1}$
, $0.6~\text{V}~\text{m}^{-1}$
and
$0.6~\text{V}~\text{m}^{-1}$
and $1.0~\text{V}~\text{m}^{-1}$
with the pressure at
$1.0~\text{V}~\text{m}^{-1}$
with the pressure at $6.66\times 10^{-3}$
Pa, while the pressure in Lloyd et al. (Reference Lloyd, Jackson, Taylor, Lazarus, Luce and Prater1991) is
$6.66\times 10^{-3}$
Pa, while the pressure in Lloyd et al. (Reference Lloyd, Jackson, Taylor, Lazarus, Luce and Prater1991) is $3.9\times 10^{-5}$
torr (
$3.9\times 10^{-5}$
torr ( $5.2\times 10^{-3}$
Pa). Although the pre-filling pressures are different, they are of the same order, so they still have reference meaning to our simulation results.
$5.2\times 10^{-3}$
Pa). Although the pre-filling pressures are different, they are of the same order, so they still have reference meaning to our simulation results.
We can also see that when the pre-filling pressure is fixed, the breakdown delay decreases as the electric field increases, which has been discussed in § 2.2. The energetic electrons then produce ionization of the neutrals. In addition, when the electric field is $0.3~\text{V}~\text{m}^{-1}$
, the optimal range of pre-filling pressure for successful breakdown is much narrower compared to a high electric field case, which is in good agreement with Lloyd’s theoretical predictions (Lloyd et al.
Reference Lloyd, Carolan and Warrick1996) and indicates that for the high pre-filling pressure case, a successful breakdown is strongly dependent on the electric field. The reason is that at higher pressure, more collisions will take place and more energy will be dissipated by collisions. Therefore, a higher electric field is needed for the electrons to get enough energy. So pure ohmic breakdown in ITER is possible at an electric field of
$0.3~\text{V}~\text{m}^{-1}$
, the optimal range of pre-filling pressure for successful breakdown is much narrower compared to a high electric field case, which is in good agreement with Lloyd’s theoretical predictions (Lloyd et al.
Reference Lloyd, Carolan and Warrick1996) and indicates that for the high pre-filling pressure case, a successful breakdown is strongly dependent on the electric field. The reason is that at higher pressure, more collisions will take place and more energy will be dissipated by collisions. Therefore, a higher electric field is needed for the electrons to get enough energy. So pure ohmic breakdown in ITER is possible at an electric field of $0.3~\text{V}~\text{m}^{-1}$
, but only within a narrow pre-filling pressure range: the optimal pre-filling pressure range is between
$0.3~\text{V}~\text{m}^{-1}$
, but only within a narrow pre-filling pressure range: the optimal pre-filling pressure range is between $1.33\times 10^{-3}$
and
$1.33\times 10^{-3}$
and $2.66\times 10^{-3}$
Pa. At such a low loop electric field, the possibility of generating REs is low, as can be seen from figure 11. This is definitively an advantage of operating at
$2.66\times 10^{-3}$
Pa. At such a low loop electric field, the possibility of generating REs is low, as can be seen from figure 11. This is definitively an advantage of operating at $0.3~\text{V}~\text{m}^{-1}$
. When the pre-filling pressure is
$0.3~\text{V}~\text{m}^{-1}$
. When the pre-filling pressure is $6.66\times 10^{-2}$
Pa with
$6.66\times 10^{-2}$
Pa with $E=1.0~\text{V}~\text{m}^{-1}$
, the breakdown delay is very long (over 20 ms): such an high pre-filling pressure is undesirable for tokamak experiments, possibly leading to more impurity release, which may further affect the burn-through and ramp-up phases. As the electric field increases, the optimal pressure shifts rightwards, which is consistent with the ionization rate in figure 12. Our simulation results agree qualitatively with JET (de Vries et al.
Reference de Vries, Sips, Kim, Lomas, Maviglia, Albanese, Coffey, Joffrin, Lehnen and Manzanares2013), DIII-D (Lloyd et al.
Reference Lloyd, Jackson, Taylor, Lazarus, Luce and Prater1991), HL-2A (Song et al.
Reference Song, Song, Xia, Mao, Wang, Zhang and Chen2014) experiments. In JET for mode D the breakdown time is 5–20 ms while for mode B it can reaches 80 ms because of the larger error field. It is seen that the breakdown time for carbon wall is longer than that for an ITER-like wall because carbon can easily absorb the neutral gas and introduce much more impurities. In DIII-D the experimentally measured breakdown time is approximately 5–40 ms for low loop voltage cases and it is approximately 30 ms in HL-2A. There, the breakdown time strongly depends on the current of vertical field coils.
$E=1.0~\text{V}~\text{m}^{-1}$
, the breakdown delay is very long (over 20 ms): such an high pre-filling pressure is undesirable for tokamak experiments, possibly leading to more impurity release, which may further affect the burn-through and ramp-up phases. As the electric field increases, the optimal pressure shifts rightwards, which is consistent with the ionization rate in figure 12. Our simulation results agree qualitatively with JET (de Vries et al.
Reference de Vries, Sips, Kim, Lomas, Maviglia, Albanese, Coffey, Joffrin, Lehnen and Manzanares2013), DIII-D (Lloyd et al.
Reference Lloyd, Jackson, Taylor, Lazarus, Luce and Prater1991), HL-2A (Song et al.
Reference Song, Song, Xia, Mao, Wang, Zhang and Chen2014) experiments. In JET for mode D the breakdown time is 5–20 ms while for mode B it can reaches 80 ms because of the larger error field. It is seen that the breakdown time for carbon wall is longer than that for an ITER-like wall because carbon can easily absorb the neutral gas and introduce much more impurities. In DIII-D the experimentally measured breakdown time is approximately 5–40 ms for low loop voltage cases and it is approximately 30 ms in HL-2A. There, the breakdown time strongly depends on the current of vertical field coils.
In our simulation work, the breakdown time is a little lower than in the experiments just mentioned. There are two reasons for this result. One is that we consider ideal conditions and neglect the particle loss, which means $\unicode[STIX]{x1D6FD}$
is equal to zero, the growth rate is larger, the breakdown time is shorter. We can also say that we do not consider the error field which is the major reason for particle loss during the breakdown process. The other reason is that we do not consider the effect of impurity which will also influence the growth rate of the density, which means neglecting impurities also shortens the simulation breakdown time. According to Lloyd’s model (Lloyd et al.
Reference Lloyd, Carolan and Warrick1996), for prompt ohmic breakdown
$\unicode[STIX]{x1D6FD}$
is equal to zero, the growth rate is larger, the breakdown time is shorter. We can also say that we do not consider the error field which is the major reason for particle loss during the breakdown process. The other reason is that we do not consider the effect of impurity which will also influence the growth rate of the density, which means neglecting impurities also shortens the simulation breakdown time. According to Lloyd’s model (Lloyd et al.
Reference Lloyd, Carolan and Warrick1996), for prompt ohmic breakdown $t_{b}$
needs to be less than 20 ms at
$t_{b}$
needs to be less than 20 ms at $E=0.3~\text{V}~\text{m}^{-1}$
, so in our work, the simulation time is reasonable and covers all breakdown modes. For absolute runaway modes, the discharge cannot be sustained for a long time because of the generation of runaway electrons. For absolute no breakdown modes, although the simulation can be longer than 25 ms, it makes no sense because the ionization cannot be finished due to the inappropriate initial parameters, so the successful breakdown will never happen.
$E=0.3~\text{V}~\text{m}^{-1}$
, so in our work, the simulation time is reasonable and covers all breakdown modes. For absolute runaway modes, the discharge cannot be sustained for a long time because of the generation of runaway electrons. For absolute no breakdown modes, although the simulation can be longer than 25 ms, it makes no sense because the ionization cannot be finished due to the inappropriate initial parameters, so the successful breakdown will never happen.
In figure 13(b), the volt-second consumption is plotted as a function of the pre-filling pressure with induced electric fields of $0.3~\text{V}~\text{m}^{-1}$
(black diamonds)
$0.3~\text{V}~\text{m}^{-1}$
(black diamonds) $0.6~\text{V}~\text{m}^{-1}$
(red triangles) and
$0.6~\text{V}~\text{m}^{-1}$
(red triangles) and $1.0~\text{V}~\text{m}^{-1}$
(blue circles). The volt-second consumption is the product of the loop electric field and breakdown delay. Note that the volt-second consumption we have given here is the low limit estimation; the actual consumption is always larger. From figure 13(b), one can see that a minimum of volt-second consumption exists for any electric field value. For the electric field of
$1.0~\text{V}~\text{m}^{-1}$
(blue circles). The volt-second consumption is the product of the loop electric field and breakdown delay. Note that the volt-second consumption we have given here is the low limit estimation; the actual consumption is always larger. From figure 13(b), one can see that a minimum of volt-second consumption exists for any electric field value. For the electric field of $0.3~\text{V}~\text{m}^{-1}$
, the volt-second consumption has a minimum at
$0.3~\text{V}~\text{m}^{-1}$
, the volt-second consumption has a minimum at $2.66\times 10^{-3}$
Pa, which is then the optimal pressure for low electric field regimes. For an electric field of
$2.66\times 10^{-3}$
Pa, which is then the optimal pressure for low electric field regimes. For an electric field of $1.0~\text{V}~\text{m}^{-1}$
, the volt-second consumption has a minimum at
$1.0~\text{V}~\text{m}^{-1}$
, the volt-second consumption has a minimum at $6.66\times 10^{-3}$
Pa, which is the optimal pressure for high electric field regimes. In the low pre-filling pressure cases (
$6.66\times 10^{-3}$
Pa, which is the optimal pressure for high electric field regimes. In the low pre-filling pressure cases ( ${\leqslant}1.33\times 10^{-3}$
Pa), although the volt-second consumption is larger in a higher electric field, the difference of volt-second consumption is quite small. Instead, in high pressure cases, the volt-second consumption is larger at low electric fields because of the long breakdown delay shown in figure 13(a). So we can say that in the low pressure regime, the volt-second consumption is weakly dependent on the electric field but is strongly dependent on it for the high pressure regime.
${\leqslant}1.33\times 10^{-3}$
Pa), although the volt-second consumption is larger in a higher electric field, the difference of volt-second consumption is quite small. Instead, in high pressure cases, the volt-second consumption is larger at low electric fields because of the long breakdown delay shown in figure 13(a). So we can say that in the low pressure regime, the volt-second consumption is weakly dependent on the electric field but is strongly dependent on it for the high pressure regime.
In conclusion, as we have discussed in our last paper (Jiang et al. Reference Jiang, Peng, Zhang and Lapenta2016), there are two different discharge modes, i.e. the high pressure and low pressure mode. From figure 13, we can seen that the two different modes have a different dependence of the breakdown delay and the volt-second consumption on the electric field. In the high pressure mode, the breakdown delay decreases faster with increasing electric field, so does the volt-second consumption. In the low pressure mode, the breakdown delay decreases slower with increasing electric field and scales with the pressure, while the volt-second consumption changes little over different electric fields and slightly scales with the pressure.
5 Conclusions
In summary, tokamak breakdown by pure ohmic heating has been simulated under different initial parameters using a one-dimensional implicit PIC/MCC code. The effects of the pre-filling pressure and of the induced electric field on plasma initiation have been investigated. Given the simulation results, three breakdown modes can be distinguished: no-breakdown, successful breakdown and runaway mode. No-breakdown mode tends to occur in the cases with low electric field or high pre-filling pressure. In those cases, the ohmic heating rate is not sufficient to compensate for the energy loss due to collisions: full ionization is not achieved. In a high pre-filling pressure regime, breakdown can happen, but with a very long breakdown delay, which will consume lots of volt-seconds. Therefore, it is not advisable to operate tokamak in high pre-filling pressure regimes. As for the successful breakdown mode, we find that as the induced electric field rises, the avalanche process changes from three stages to two stages. This is because in the large electric field cases the ambipolar diffusion field increases faster so that the transition stage (the second stage in low field cases, when the induced electric field and the ambipolar electric field are comparable) disappears. We find that, to achieve a good quality plasma breakdown, it is necessary to make careful adjustment of the induced electric field and pre-filling pressure. Specifically, when the electric field is quite high ( ${\geqslant}2~\text{V}~\text{m}^{-1}$
), the breakdown is abnormal because in the whole discharge, the ohmic heating is dominant and ions are mainly heated by it rather than by the ambipolar field (
${\geqslant}2~\text{V}~\text{m}^{-1}$
), the breakdown is abnormal because in the whole discharge, the ohmic heating is dominant and ions are mainly heated by it rather than by the ambipolar field ( $P_{\text{equ}}$
). For runaway discharge, the simulation results show that runaway electrons are easy to be generated in low pressure cases, which is in good agreement with Lloyd’s theoretical predictions.
$P_{\text{equ}}$
). For runaway discharge, the simulation results show that runaway electrons are easy to be generated in low pressure cases, which is in good agreement with Lloyd’s theoretical predictions.
In tokamak breakdown the plasma is strongly magnetized, while in Townsend discharges there is no magnetic field. A comparison of operation parameters between Townsend discharge at an atmosphere and tokamak breakdown is made. It is found that the ionization rate in the first phase is at least one order of magnitude smaller than that predicted by Townsend discharge, which indicates that the conventional Townsend discharge is not applicable to tokamak breakdown discharge. One of the key reasons for this is the effect of the magnetic field. Since the breakdown delay is also a key parameter that characterizes tokamak breakdown, we have studied its dependence on pre-filling pressure and electric field and given an estimation of volt-second consumption during the breakdown.
Since ITER is faced with the low electric field limit ( $E\leqslant 0.3~\text{V}~\text{m}^{-1}$
), we have simulated the breakdown for ITER using pure ohmic heating. We have demonstrated that when the electric field is
$E\leqslant 0.3~\text{V}~\text{m}^{-1}$
), we have simulated the breakdown for ITER using pure ohmic heating. We have demonstrated that when the electric field is $0.3~\text{V}~\text{m}^{-1}$
, the possible pre-filling pressure range for successful breakdown is narrow, which is consistent with Lloyd’s predictions (Lloyd et al.
Reference Lloyd, Carolan and Warrick1996). Furthermore, we have found that the optimal pre-filling pressure for ITER breakdown is approximately
$0.3~\text{V}~\text{m}^{-1}$
, the possible pre-filling pressure range for successful breakdown is narrow, which is consistent with Lloyd’s predictions (Lloyd et al.
Reference Lloyd, Carolan and Warrick1996). Furthermore, we have found that the optimal pre-filling pressure for ITER breakdown is approximately $1.33\times 10^{-3}$
Pa, in line with ITER’s design value.
$1.33\times 10^{-3}$
Pa, in line with ITER’s design value.
Breakdown is an important phase in the life cycle of a tokamak, since it can influence later operation. In our opinion, these particular aspects of tokamak start-up need to be investigated further:
(i) A higher start-up success rate, volt-second savings and less wall thermal load should be pursued. Simulations allow an appropriate estimation of plasma inductance and resistivity history, which can be used to design more accurate and reliable tokamak operation schemes.
(ii) The shot-to-shot variation for tokamak operation should be reduced. This could be achieved with better plasma parameters at breakdown. Our simulations may provide the right initial conditions for many tokamak simulation tools. Indeed, many simulations currently begin assuming full ionization, because at present there are no data and no model for the plasma from the very beginning.
(iii) RE generation during the breakdown still needs further investigations. Simulations show that fast or superthermal electrons (which can in turn be a possible source of REs during later disruption) can be generated during the breakdown process. However, our present model cannot treat REs accurately. In the future, we will consider the REs in details, with a proper relativistic model.
Finally, we want to remark that although some of the presented results may be observed and well known by the experimentalists that operate tokamaks, they are obtained here for the first time in numerical simulations without appropriately tuned free parameters. In the future, we intend expand our model to contain complete physical processes, such as Coulomb collisions, perpendicular transport, particle loss, impurities and real geometries, to develop a predictive tool for tokamak start-up.
Acknowledgements
This work was supported by the National Natural Science Foundation (11775090, 11775164, 11375163, 11405067) and by the National Magnetic Confinement Fusion Energy Research Project (2015GB120003) and the Fundamental Research Funds for the Central Universities (WUT:2018IB011). Work in Belgium was supported by the Onderzoekfonds KU Leuven (Research Fund KU Leuven) and Exploratory Bilateral co-operation Programme of Tsinghua University – KU Leuven (ISP/15/003TS). W.J. and Y.Z. gratefully acknowledge the Belgian Federal Science Policy Office for financial support. M.E.I. is funded by the FWO (Fonds Wetenschappelijk Onderzoek Vlaanderen) postdoctoral fellowship reference 12O5215N.


 Open access