


1 Introduction
One model for the origin of the solar wind relies upon Alfvén waves (AWs) with wavelengths much larger than the proton gyroradius and frequencies much smaller than the proton cyclotron frequency. In this model, photospheric motions and/or magnetic reconnection in the solar atmosphere launch AWs into the corona and solar wind, where the AWs undergo partial non-WKB (Wentzel–Kramers–Brillouin) reflection (Velli, Grappin & Mangeney Reference Velli, Grappin and Mangeney1989; Zhou & Matthaeus Reference Zhou and Matthaeus1989). Subsequent interactions between counter-propagating AW packets transfer fluctuation energy from large scales to small scales. At sufficiently small scales, the fluctuation energy dissipates. Large-scale AWs also exert an outward force on the plasma. Several studies have found that this dissipation and momentum deposition can account for much of the heating and acceleration of the solar wind (e.g. Cranmer, van Ballegooijen & Edgar Reference Cranmer, van Ballegooijen and Edgar2007; Verdini et al. Reference Verdini, Velli, Matthaeus, Oughton and Dmitruk2010; Chandran et al. Reference Chandran, Dennis, Quataert and Bale2011; van der Holst et al. Reference van der Holst, Sokolov, Meng, Jin, Manchester, Tóth and Gombosi2014).
A number of authors have investigated different aspects of reflection-driven magnetohydrodynamic (MHD) turbulence. For example, Heinemann & Olbert (Reference Heinemann and Olbert1980), Velli (Reference Velli1993) and Hollweg & Isenberg (Reference Hollweg and Isenberg2007) investigated the linear AW propagation problem, accounting for radial variations in the density, outflow velocity and magnetic-field strength. Dmitruk et al. (Reference Dmitruk, Matthaeus, Milano, Oughton, Zank and Mullan2002), Cranmer & van Ballegooijen (Reference Cranmer and van Ballegooijen2005), Verdini & Velli (Reference Verdini and Velli2007), Chandran & Hollweg (Reference Chandran and Hollweg2009) and Zank et al. (Reference Zank, Adhikari, Hunana, Tiwari, Moore, Shiota, Bruno and Telloni2018) investigated the radial evolution of MHD turbulence in the solar atmosphere and solar wind accounting for reflection and nonlinear interactions. Cranmer et al. (Reference Cranmer, van Ballegooijen and Edgar2007), Verdini et al. (Reference Verdini, Velli, Matthaeus, Oughton and Dmitruk2010), Chandran et al. (Reference Chandran, Dennis, Quataert and Bale2011), van der Holst et al. (Reference van der Holst, Sokolov, Meng, Jin, Manchester, Tóth and Gombosi2014) and Usmanov, Goldstein & Matthaeus (Reference Usmanov, Goldstein and Matthaeus2014) incorporated reflection-driven MHD turbulence into one-dimensional (1-D) and 3-D solar-wind models. Verdini, Velli & Buchlin (Reference Verdini, Velli and Buchlin2009) and Verdini et al. (Reference Verdini, Grappin, Pinto and Velli2012) carried out numerical simulations of reflection-driven MHD turbulence, in which they approximated the nonlinear terms in the governing equations using a shell model. Dmitruk & Matthaeus (Reference Dmitruk and Matthaeus2003) carried out direct numerical simulations of reflection-driven MHD turbulence (i.e. without approximating the nonlinear terms) in the corona in the absence of a background flow. van Ballegooijen et al. (Reference van Ballegooijen, Asgari-Targhi, Cranmer and DeLuca2011) carried out direct numerical simulations of reflection-driven MHD turbulence in the chromosphere and corona without a background flow. Perez & Chandran (Reference Perez and Chandran2013), van Ballegooijen & Asgari-Targhi (Reference van Ballegooijen and Asgari-Targhi2016) and van Ballegooijen & Asgari-Targhi (Reference van Ballegooijen and Asgari-Targhi2017) carried out direct numerical simulations of reflection-driven MHD turbulence from the low corona to the Alfvén critical point (at a heliocentric distance
 $r$
of
$r$
of
 $r_{\text{A}}\sim 10R_{\odot }$
) and beyond, taking into account the solar-wind outflow velocity.
$r_{\text{A}}\sim 10R_{\odot }$
) and beyond, taking into account the solar-wind outflow velocity.
In § 3 of this paper, we present three new direct numerical simulations of reflection-driven MHD turbulence extending from the photosphere, through the chromosphere, through a coronal hole and out to
 $r=21R_{\odot }$
. These simulations go beyond previous simulations extending to
$r=21R_{\odot }$
. These simulations go beyond previous simulations extending to
 $r\gtrsim r_{\text{A}}$
by incorporating the chromosphere. This enables us to account, at least in an approximate way, for the strong turbulence that develops in the chromosphere, which launches a broad spectrum of fluctuations into the corona (van Ballegooijen et al.
Reference van Ballegooijen, Asgari-Targhi, Cranmer and DeLuca2011). Our simulations also reach larger
$r\gtrsim r_{\text{A}}$
by incorporating the chromosphere. This enables us to account, at least in an approximate way, for the strong turbulence that develops in the chromosphere, which launches a broad spectrum of fluctuations into the corona (van Ballegooijen et al.
Reference van Ballegooijen, Asgari-Targhi, Cranmer and DeLuca2011). Our simulations also reach larger
 $r$
than the simulations of Perez & Chandran (Reference Perez and Chandran2013) and contain 16 times as many grid points in the field-perpendicular plane as the simulations of van Ballegooijen & Asgari-Targhi (Reference van Ballegooijen and Asgari-Targhi2017).
$r$
than the simulations of Perez & Chandran (Reference Perez and Chandran2013) and contain 16 times as many grid points in the field-perpendicular plane as the simulations of van Ballegooijen & Asgari-Targhi (Reference van Ballegooijen and Asgari-Targhi2017).
To offer some insight into the physical processes at work in our simulations, we present an analytic model of reflection-driven MHD turbulence in § 4. This model accounts for the generation of inward-propagating AWs by non-WKB reflection, nonlinear interactions between counter-propagating AW packets and the development of alignment between outward-propagating and inward-propagating fluctuations. For reasons that we describe in §§ 3 and 4, we divide the outward-propagating fluctuations into two populations with different characteristic radial correlation lengths. Our model reproduces our numerical results reasonably well.
The power-law scalings of the inertial-range power spectra in our simulations vary with radius. We discuss the causes of these variations in § 6, after reviewing several relevant studies in § 5. We briefly discuss other wave-launching parameter regimes in § 7 and phase mixing in § 8, and we present our conclusions in § 9.
2 Transverse, non-compressive fluctuations in a radially stratified corona and solar wind
We focus exclusively on non-compressive fluctuations, which are observed to dominate the energy density of solar-wind turbulence (Tu & Marsch Reference Tu and Marsch1995), and which carry an energy flux in the low corona that is sufficient to power the solar wind (De Pontieu et al.
Reference De Pontieu, McIntosh, Carlsson, Hansteen, Tarbell, Schrijver, Title, Shine, Tsuneta and Katsukawa2007). A disadvantage of our approach is that we neglect nonlinear couplings between compressive and non-compressive fluctuations (see, e.g. Cho & Lazarian Reference Cho and Lazarian2003; Chandran Reference Chandran2005; Luo & Melrose Reference Luo and Melrose2006; Chandran Reference Chandran2008; Yoon & Fang Reference Yoon and Fang2009; Shoda et al.
Reference Shoda, Suzuki, Asgari-Targhi and Yokoyama2019), which are likely important in the solar atmosphere and solar wind. For example, the plasma density varies by a factor of
 ${\sim}6$
over a distance of a few thousand km perpendicular to the background magnetic field
${\sim}6$
over a distance of a few thousand km perpendicular to the background magnetic field
 $\boldsymbol{B}_{0}$
in the low corona (Raymond et al.
Reference Raymond, McCauley, Cranmer and Downs2014), which suggests that phase mixing (Heyvaerts & Priest Reference Heyvaerts and Priest1983) is an efficient mechanism for cascading AW energy to small scales measured perpendicular to
$\boldsymbol{B}_{0}$
in the low corona (Raymond et al.
Reference Raymond, McCauley, Cranmer and Downs2014), which suggests that phase mixing (Heyvaerts & Priest Reference Heyvaerts and Priest1983) is an efficient mechanism for cascading AW energy to small scales measured perpendicular to
 $\boldsymbol{B}_{0}$
near the Sun.Footnote
1
We also neglect the parametric decay of AWs into slow magnetosonic waves and counter-propagating AWs (e.g. Galeev & Oraevskii Reference Galeev and Oraevskii1963; Sagdeev & Galeev Reference Sagdeev and Galeev1969; Cohen & Dewar Reference Cohen and Dewar1974; Tenerani, Velli & Hellinger Reference Tenerani, Velli and Hellinger2017), which may cause outward-propagating AWs in the fast solar wind to acquire a
$\boldsymbol{B}_{0}$
near the Sun.Footnote
1
We also neglect the parametric decay of AWs into slow magnetosonic waves and counter-propagating AWs (e.g. Galeev & Oraevskii Reference Galeev and Oraevskii1963; Sagdeev & Galeev Reference Sagdeev and Galeev1969; Cohen & Dewar Reference Cohen and Dewar1974; Tenerani, Velli & Hellinger Reference Tenerani, Velli and Hellinger2017), which may cause outward-propagating AWs in the fast solar wind to acquire a
 $k_{\Vert }^{-1}$
spectrum by the time these fluctuations reach
$k_{\Vert }^{-1}$
spectrum by the time these fluctuations reach
 $r=0.3~\text{au}$
(Chandran Reference Chandran2018), where
$r=0.3~\text{au}$
(Chandran Reference Chandran2018), where
 $k_{\Vert }$
is the wave-vector component parallel to the background magnetic field, and 1 au is the mean Earth–Sun distance. Nevertheless, the simulations that we report in § 3 describe an important subset of the full turbulent dynamics.
$k_{\Vert }$
is the wave-vector component parallel to the background magnetic field, and 1 au is the mean Earth–Sun distance. Nevertheless, the simulations that we report in § 3 describe an important subset of the full turbulent dynamics.
Our analysis begins with the continuity, momentum and induction equations of ideal MHD,
 $$\begin{eqnarray}\displaystyle & \displaystyle \frac{\unicode[STIX]{x2202}\unicode[STIX]{x1D70C}}{\unicode[STIX]{x2202}t}+\unicode[STIX]{x1D735}\boldsymbol{\cdot }(\unicode[STIX]{x1D70C}\boldsymbol{v})=0, & \displaystyle\end{eqnarray}$$
 $$\begin{eqnarray}\displaystyle & \displaystyle \unicode[STIX]{x1D70C}\left(\frac{\unicode[STIX]{x2202}\boldsymbol{v}}{\unicode[STIX]{x2202}t}+\boldsymbol{v}\boldsymbol{\cdot }\unicode[STIX]{x1D735}\boldsymbol{v}\right)=-\unicode[STIX]{x1D735}p_{\text{tot}}+\frac{\boldsymbol{B}\boldsymbol{\cdot }\unicode[STIX]{x1D735}\boldsymbol{B}}{4\unicode[STIX]{x03C0}}-\unicode[STIX]{x1D70C}\unicode[STIX]{x1D735}\unicode[STIX]{x1D6F7}, & \displaystyle\end{eqnarray}$$
and
 $$\begin{eqnarray}\frac{\unicode[STIX]{x2202}\boldsymbol{B}}{\unicode[STIX]{x2202}t}=\unicode[STIX]{x1D735}\times (\boldsymbol{v}\times \boldsymbol{B}),\end{eqnarray}$$
where
 $\unicode[STIX]{x1D70C}$
,
$\unicode[STIX]{x1D70C}$
,
 $\boldsymbol{v}$
and
$\boldsymbol{v}$
and
 $\boldsymbol{B}$
are the mass density, velocity and magnetic field,
$\boldsymbol{B}$
are the mass density, velocity and magnetic field,
 $\unicode[STIX]{x1D6F7}$
is the gravitational potential,
$\unicode[STIX]{x1D6F7}$
is the gravitational potential,
 $p_{\text{tot}}=p+B^{2}/8\unicode[STIX]{x03C0}$
is the total pressure and
$p_{\text{tot}}=p+B^{2}/8\unicode[STIX]{x03C0}$
is the total pressure and
 $p$
is the plasma pressure. We set
$p$
is the plasma pressure. We set
 $$\begin{eqnarray}\boldsymbol{v}=\boldsymbol{U}+\unicode[STIX]{x1D6FF}\boldsymbol{v}\quad \boldsymbol{B}=\boldsymbol{B}_{0}+\unicode[STIX]{x1D6FF}\boldsymbol{B}\end{eqnarray}$$
and take the background flow velocity
 $\boldsymbol{U}$
to be aligned with
$\boldsymbol{U}$
to be aligned with
 $\boldsymbol{B}_{0}$
. We neglect density fluctuations, setting
$\boldsymbol{B}_{0}$
. We neglect density fluctuations, setting
 $$\begin{eqnarray}\unicode[STIX]{x1D6FF}\unicode[STIX]{x1D70C}=0.\end{eqnarray}$$
We assume that the fluctuations are transverse and non-compressive, i.e.
 $$\begin{eqnarray}\unicode[STIX]{x1D6FF}\boldsymbol{v}\boldsymbol{\cdot }\boldsymbol{B}_{0}=0\quad \unicode[STIX]{x1D6FF}\boldsymbol{B}\boldsymbol{\cdot }\boldsymbol{B}_{0}=0\quad \unicode[STIX]{x1D735}\boldsymbol{\cdot }\unicode[STIX]{x1D6FF}\boldsymbol{v}=0,\end{eqnarray}$$
and we take
 $\unicode[STIX]{x1D70C}$
,
$\unicode[STIX]{x1D70C}$
,
 $\boldsymbol{U}$
and
$\boldsymbol{U}$
and
 $\boldsymbol{B}_{0}$
to be steady-state solutions of (2.1) through (2.3) (as well as the MHD energy equation). The Alfvén velocity and Elsasser variables are given by
$\boldsymbol{B}_{0}$
to be steady-state solutions of (2.1) through (2.3) (as well as the MHD energy equation). The Alfvén velocity and Elsasser variables are given by
 $$\begin{eqnarray}\boldsymbol{v}_{\text{A}}=\frac{\boldsymbol{B}_{0}}{\sqrt{4\unicode[STIX]{x03C0}\unicode[STIX]{x1D70C}}}\quad \boldsymbol{z}^{\pm }=\unicode[STIX]{x1D6FF}\boldsymbol{v}\mp \unicode[STIX]{x1D6FF}\boldsymbol{b},\end{eqnarray}$$
where
 $\unicode[STIX]{x1D6FF}\boldsymbol{b}=\unicode[STIX]{x1D6FF}\boldsymbol{B}/\sqrt{4\unicode[STIX]{x03C0}\unicode[STIX]{x1D70C}}$
. Rewriting (2.2) and (2.3) in terms of
$\unicode[STIX]{x1D6FF}\boldsymbol{b}=\unicode[STIX]{x1D6FF}\boldsymbol{B}/\sqrt{4\unicode[STIX]{x03C0}\unicode[STIX]{x1D70C}}$
. Rewriting (2.2) and (2.3) in terms of
 $\boldsymbol{z}^{\pm }$
, we obtain (Velli et al.
Reference Velli, Grappin and Mangeney1989; Zhou & Matthaeus Reference Zhou and Matthaeus1990)
$\boldsymbol{z}^{\pm }$
, we obtain (Velli et al.
Reference Velli, Grappin and Mangeney1989; Zhou & Matthaeus Reference Zhou and Matthaeus1990)
 $$\begin{eqnarray}\displaystyle & & \displaystyle \frac{\unicode[STIX]{x2202}\boldsymbol{z}^{\pm }}{\unicode[STIX]{x2202}t}+(\boldsymbol{U}\pm \boldsymbol{v}_{\text{A}})\boldsymbol{\cdot }\unicode[STIX]{x1D735}\boldsymbol{z}^{\pm }+\boldsymbol{z}^{\mp }\boldsymbol{\cdot }\unicode[STIX]{x1D735}(\boldsymbol{U}\mp \boldsymbol{v}_{A})+\frac{1}{2}(\boldsymbol{z}^{-}-\boldsymbol{z}^{+})(\unicode[STIX]{x1D735}\boldsymbol{\cdot }\boldsymbol{v}_{\text{A}}\mp \frac{1}{2}\unicode[STIX]{x1D735}\boldsymbol{\cdot }\boldsymbol{U})\nonumber\\ \displaystyle & & \displaystyle \quad =-\left(\boldsymbol{z}^{\mp }\boldsymbol{\cdot }\unicode[STIX]{x1D735}\boldsymbol{z}^{\pm }+\frac{\unicode[STIX]{x1D735}p_{\text{tot}}}{\unicode[STIX]{x1D70C}}\right).\end{eqnarray}$$
As in homogeneous MHD turbulence, the
 $\unicode[STIX]{x1D70C}^{-1}\unicode[STIX]{x1D735}p_{\text{tot}}$
term in (2.8) cancels the compressive part of the
$\unicode[STIX]{x1D70C}^{-1}\unicode[STIX]{x1D735}p_{\text{tot}}$
term in (2.8) cancels the compressive part of the
 $\boldsymbol{z}^{\mp }\boldsymbol{\cdot }\unicode[STIX]{x1D735}\boldsymbol{z}^{\pm }$
term to maintain the condition
$\boldsymbol{z}^{\mp }\boldsymbol{\cdot }\unicode[STIX]{x1D735}\boldsymbol{z}^{\pm }$
term to maintain the condition
 $\unicode[STIX]{x1D735}\boldsymbol{\cdot }\boldsymbol{z}^{\pm }=0$
.
$\unicode[STIX]{x1D735}\boldsymbol{\cdot }\boldsymbol{z}^{\pm }=0$
.
We assume that the background magnetic field
 $\boldsymbol{B}_{0}$
possesses a field line that is purely radial. Working, temporarily, in spherical coordinates
$\boldsymbol{B}_{0}$
possesses a field line that is purely radial. Working, temporarily, in spherical coordinates
 $(r,\unicode[STIX]{x1D703},\unicode[STIX]{x1D719})$
, with
$(r,\unicode[STIX]{x1D703},\unicode[STIX]{x1D719})$
, with
 $\unicode[STIX]{x1D703}=0$
coinciding with this radial field line, we restrict our analysis to
$\unicode[STIX]{x1D703}=0$
coinciding with this radial field line, we restrict our analysis to
 $$\begin{eqnarray}\unicode[STIX]{x1D703}\ll 1.\end{eqnarray}$$
We further assume that
 $$\begin{eqnarray}v_{A\unicode[STIX]{x1D719}}=U_{\unicode[STIX]{x1D719}}=\unicode[STIX]{x2202}U/\unicode[STIX]{x2202}\unicode[STIX]{x1D719}=\unicode[STIX]{x2202}v_{\text{A}}/\unicode[STIX]{x2202}\unicode[STIX]{x1D719}=0\end{eqnarray}$$
and
 $$\begin{eqnarray}\frac{1}{B_{0}}\frac{\unicode[STIX]{x2202}B_{0}}{\unicode[STIX]{x2202}r}\sim O(r^{-1}).\end{eqnarray}$$
Since
 $\boldsymbol{z}^{\mp }\boldsymbol{\cdot }\boldsymbol{B}_{0}=0$
, these assumptions imply that to leading order in
$\boldsymbol{z}^{\mp }\boldsymbol{\cdot }\boldsymbol{B}_{0}=0$
, these assumptions imply that to leading order in
 $\unicode[STIX]{x1D703}$
(Chandran et al.
Reference Chandran, Perez, Verscharen, Klein and Mallet2015a
)
$\unicode[STIX]{x1D703}$
(Chandran et al.
Reference Chandran, Perez, Verscharen, Klein and Mallet2015a
)
 $$\begin{eqnarray}\hat{\boldsymbol{b}}_{0}\boldsymbol{\cdot }\unicode[STIX]{x1D735}=\frac{\unicode[STIX]{x2202}}{\unicode[STIX]{x2202}r},\end{eqnarray}$$
and
 $$\begin{eqnarray}\boldsymbol{z}^{\mp }\boldsymbol{\cdot }\unicode[STIX]{x1D735}(\boldsymbol{U}\mp \boldsymbol{v}_{\text{A}})=\boldsymbol{z}^{\mp }(U\mp v_{\text{A}})(\unicode[STIX]{x1D735}\boldsymbol{\cdot }\hat{\boldsymbol{b}}_{0}/2),\end{eqnarray}$$
where
 $$\begin{eqnarray}\hat{\boldsymbol{b}}_{0}=\frac{\boldsymbol{B}_{0}}{B_{0}}.\end{eqnarray}$$
We take
 $\boldsymbol{B}_{0}$
to be directed away from the Sun, so that
$\boldsymbol{B}_{0}$
to be directed away from the Sun, so that
 $\boldsymbol{z}^{+}$
(
$\boldsymbol{z}^{+}$
(
 $\boldsymbol{z}^{-}$
) corresponds to outward-propagating (inward-propagating) fluctuations (when viewed in the local plasma frame), and we define vector versions of the variables introduced by Heinemann & Olbert (Reference Heinemann and Olbert1980),
$\boldsymbol{z}^{-}$
) corresponds to outward-propagating (inward-propagating) fluctuations (when viewed in the local plasma frame), and we define vector versions of the variables introduced by Heinemann & Olbert (Reference Heinemann and Olbert1980),
 $$\begin{eqnarray}\boldsymbol{g}=\frac{(1+\unicode[STIX]{x1D702}^{1/2})\boldsymbol{z}^{+}}{\unicode[STIX]{x1D702}^{1/4}}\quad \boldsymbol{f}=\frac{(1-\unicode[STIX]{x1D702}^{1/2})\boldsymbol{z}^{-}}{\unicode[STIX]{x1D702}^{1/4}},\end{eqnarray}$$
where
 $$\begin{eqnarray}\unicode[STIX]{x1D702}=\unicode[STIX]{x1D70C}/\unicode[STIX]{x1D70C}_{a},\end{eqnarray}$$
and
 $\unicode[STIX]{x1D70C}_{a}$
is the value of
$\unicode[STIX]{x1D70C}_{a}$
is the value of
 $\unicode[STIX]{x1D70C}$
at the Alfvén critical point, at which
$\unicode[STIX]{x1D70C}$
at the Alfvén critical point, at which
 $U=v_{\text{A}}$
. Mass conservation and flux conservation imply that
$U=v_{\text{A}}$
. Mass conservation and flux conservation imply that
 $$\begin{eqnarray}\frac{\unicode[STIX]{x1D70C}U}{B_{0}}=\text{const.},\end{eqnarray}$$
which in turn implies that
 $$\begin{eqnarray}v_{\text{A}}=\unicode[STIX]{x1D702}^{1/2}U.\end{eqnarray}$$
With the use of (2.15) and (2.18), we rewrite
 $\boldsymbol{z}^{\pm }$
in (2.8) in terms of
$\boldsymbol{z}^{\pm }$
in (2.8) in terms of
 $\boldsymbol{g}$
and
$\boldsymbol{g}$
and
 $\boldsymbol{f}$
, obtaining the nonlinear Heinemann–Olbert equations (Heinemann & Olbert Reference Heinemann and Olbert1980; Chandran & Hollweg Reference Chandran and Hollweg2009),
$\boldsymbol{f}$
, obtaining the nonlinear Heinemann–Olbert equations (Heinemann & Olbert Reference Heinemann and Olbert1980; Chandran & Hollweg Reference Chandran and Hollweg2009),
 $$\begin{eqnarray}\displaystyle & \displaystyle \frac{\unicode[STIX]{x2202}\boldsymbol{g}}{\unicode[STIX]{x2202}t}+(U+v_{\text{A}})\frac{\unicode[STIX]{x2202}\boldsymbol{g}}{\unicode[STIX]{x2202}r}-\left(\frac{U+v_{\text{A}}}{2v_{\text{A}}}\right)\frac{\text{d}v_{\text{A}}}{\text{d}r}\boldsymbol{f}=-\boldsymbol{z}^{-}\boldsymbol{\cdot }\unicode[STIX]{x1D735}\boldsymbol{g}-\left(\frac{1+\unicode[STIX]{x1D702}^{1/2}}{\unicode[STIX]{x1D702}^{1/4}}\right)\frac{\unicode[STIX]{x1D735}p_{\text{tot}}}{\unicode[STIX]{x1D70C}} & \displaystyle\end{eqnarray}$$
 $$\begin{eqnarray}\displaystyle & \displaystyle \frac{\unicode[STIX]{x2202}\boldsymbol{f}}{\unicode[STIX]{x2202}t}+(U-v_{\text{A}})\frac{\unicode[STIX]{x2202}\boldsymbol{f}}{\unicode[STIX]{x2202}r}-\left(\frac{U-v_{\text{A}}}{2v_{\text{A}}}\right)\frac{\text{d}v_{\text{A}}}{\text{d}r}\boldsymbol{g}=-\boldsymbol{z}^{+}\boldsymbol{\cdot }\unicode[STIX]{x1D735}\boldsymbol{f}-\left(\frac{1-\unicode[STIX]{x1D702}^{1/2}}{\unicode[STIX]{x1D702}^{1/4}}\right)\frac{\unicode[STIX]{x1D735}p_{\text{tot}}}{\unicode[STIX]{x1D70C}}. & \displaystyle\end{eqnarray}$$
Equations (2.19) and (2.20) are equivalent to the equations solved by Perez & Chandran (Reference Perez and Chandran2013) and van Ballegooijen & Asgari-Targhi (Reference van Ballegooijen and Asgari-Targhi2016), van Ballegooijen & Asgari-Targhi (Reference van Ballegooijen and Asgari-Targhi2017).Footnote 2
Because (2.6) is also satisfied by non-compressive fluctuations in reduced MHD (RMHD), equations (2.19) and (2.20) could be viewed as an inhomogeneous version of RMHD. However, the way in which we have arrived at (2.19) and (2.20) – in particular, starting with (2.5) and (2.6) as assumptions – differs from the usual derivation of the RMHD equations (see, e.g. Schekochihin et al.
Reference Schekochihin, Cowley, Dorland, Hammett, Howes, Quataert and Tatsuno2009), which begins by assuming that
 $\unicode[STIX]{x1D6FF}B\ll B_{0}$
and
$\unicode[STIX]{x1D6FF}B\ll B_{0}$
and
 $\unicode[STIX]{x1D706}\ll l$
, where
$\unicode[STIX]{x1D706}\ll l$
, where
 $\unicode[STIX]{x1D706}$
(
$\unicode[STIX]{x1D706}$
(
 $l$
) is the characteristic length scale of the fluctuations measured perpendicular (parallel) to
$l$
) is the characteristic length scale of the fluctuations measured perpendicular (parallel) to
 $\boldsymbol{B}_{0}$
. We conjecture that (2.19) and (2.20) may provide a reasonable description of transverse, non-compressive fluctuations and their mutual interactions even when the assumptions
$\boldsymbol{B}_{0}$
. We conjecture that (2.19) and (2.20) may provide a reasonable description of transverse, non-compressive fluctuations and their mutual interactions even when the assumptions
 $\unicode[STIX]{x1D6FF}B\ll B_{0}$
and
$\unicode[STIX]{x1D6FF}B\ll B_{0}$
and
 $\unicode[STIX]{x1D706}\ll l$
fail. For example, if collisionless damping (Barnes Reference Barnes1966) or passive-scalar mixing (Schekochihin et al.
Reference Schekochihin, Parker, Highcock, Dellar, Dorland and Hammett2016; Meyrand et al.
Reference Meyrand, Kanekar, Dorland and Schekochihin2019) removes compressive and longitudinal fluctuations, then (2.5) and (2.6) may be reasonable approximations even if
$\unicode[STIX]{x1D706}\ll l$
fail. For example, if collisionless damping (Barnes Reference Barnes1966) or passive-scalar mixing (Schekochihin et al.
Reference Schekochihin, Parker, Highcock, Dellar, Dorland and Hammett2016; Meyrand et al.
Reference Meyrand, Kanekar, Dorland and Schekochihin2019) removes compressive and longitudinal fluctuations, then (2.5) and (2.6) may be reasonable approximations even if
 $\unicode[STIX]{x1D6FF}B\sim B_{0}$
and
$\unicode[STIX]{x1D6FF}B\sim B_{0}$
and
 $\unicode[STIX]{x1D706}\sim l$
. We note that neither our derivation of (2.19) and (2.20), nor the derivation of RMHD as a limit of the Vlasov equation (Schekochihin et al.
Reference Schekochihin, Cowley, Dorland, Hammett, Howes, Quataert and Tatsuno2009), requires that
$\unicode[STIX]{x1D706}\sim l$
. We note that neither our derivation of (2.19) and (2.20), nor the derivation of RMHD as a limit of the Vlasov equation (Schekochihin et al.
Reference Schekochihin, Cowley, Dorland, Hammett, Howes, Quataert and Tatsuno2009), requires that
 $\unicode[STIX]{x1D6FD}=8\unicode[STIX]{x03C0}p/B^{2}$
be ordered as either large or small.
$\unicode[STIX]{x1D6FD}=8\unicode[STIX]{x03C0}p/B^{2}$
be ordered as either large or small.
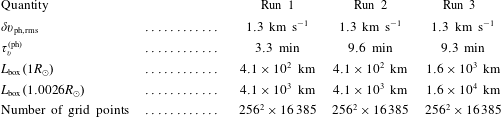
3 Direct numerical simulations
We have carried out three direct numerical simulations of (2.19) and (2.20) using the pseudo-spectral/Chebyshev REFLECT code (Perez & Chandran Reference Perez and Chandran2013). In each simulation, the numerical domain is a narrow magnetic flux tube with a square cross-section, as illustrated in figure 1. This flux tube extends from the photosphere at
 $r=r_{\text{min}}=1R_{\odot }$
, through the chromosphere, the ‘transition region’ (the narrow layer at the top of the chromosphere), and a coronal hole and then out to a heliocentric distance of
$r=r_{\text{min}}=1R_{\odot }$
, through the chromosphere, the ‘transition region’ (the narrow layer at the top of the chromosphere), and a coronal hole and then out to a heliocentric distance of
 $$\begin{eqnarray}r_{\text{max}}=21R_{\odot }.\end{eqnarray}$$
We model the transition region in our simulations as a discontinuity in the density at
 $$\begin{eqnarray}r_{\text{tr}}=1.0026R_{\odot },\end{eqnarray}$$
a distance of roughly 1800 km above the photosphere. (We have collected in table 2 several heliocentric distances that we refer to repeatedly in the discussion to follow.) The walls of the simulation domain are parallel to the background magnetic field
 $\boldsymbol{B}_{0}$
. As
$\boldsymbol{B}_{0}$
. As
 $r$
increases and
$r$
increases and
 $\boldsymbol{B}_{0}(r)$
decreases, the width
$\boldsymbol{B}_{0}(r)$
decreases, the width
 $L_{\text{box}}$
of the simulation domain perpendicular to
$L_{\text{box}}$
of the simulation domain perpendicular to
 $\boldsymbol{B}_{0}$
grows according to the relation
$\boldsymbol{B}_{0}$
grows according to the relation
 $$\begin{eqnarray}L_{\text{box}}(r)=L_{\text{box}}(1R_{\odot })\left[\frac{B_{0}(1R_{\odot })}{B_{0}(r)}\right]^{1/2}.\end{eqnarray}$$
Because
 $B_{0}$
drops sharply between the photosphere and the transition region (see (3.16) below),
$B_{0}$
drops sharply between the photosphere and the transition region (see (3.16) below),
 $L_{\text{box}}(r_{\text{tr}})\simeq 10L_{\text{box}}(1R_{\odot })$
. The values of
$L_{\text{box}}(r_{\text{tr}})\simeq 10L_{\text{box}}(1R_{\odot })$
. The values of
 $L_{\text{box}}(1R_{\odot })$
and
$L_{\text{box}}(1R_{\odot })$
and
 $L_{\text{box}}(r_{\text{tr}})$
in our three simulations are listed in table 1. We discuss why we choose these values for
$L_{\text{box}}(r_{\text{tr}})$
in our three simulations are listed in table 1. We discuss why we choose these values for
 $L_{\text{box}}(1R_{\odot })$
in § 3.2.
$L_{\text{box}}(1R_{\odot })$
in § 3.2.
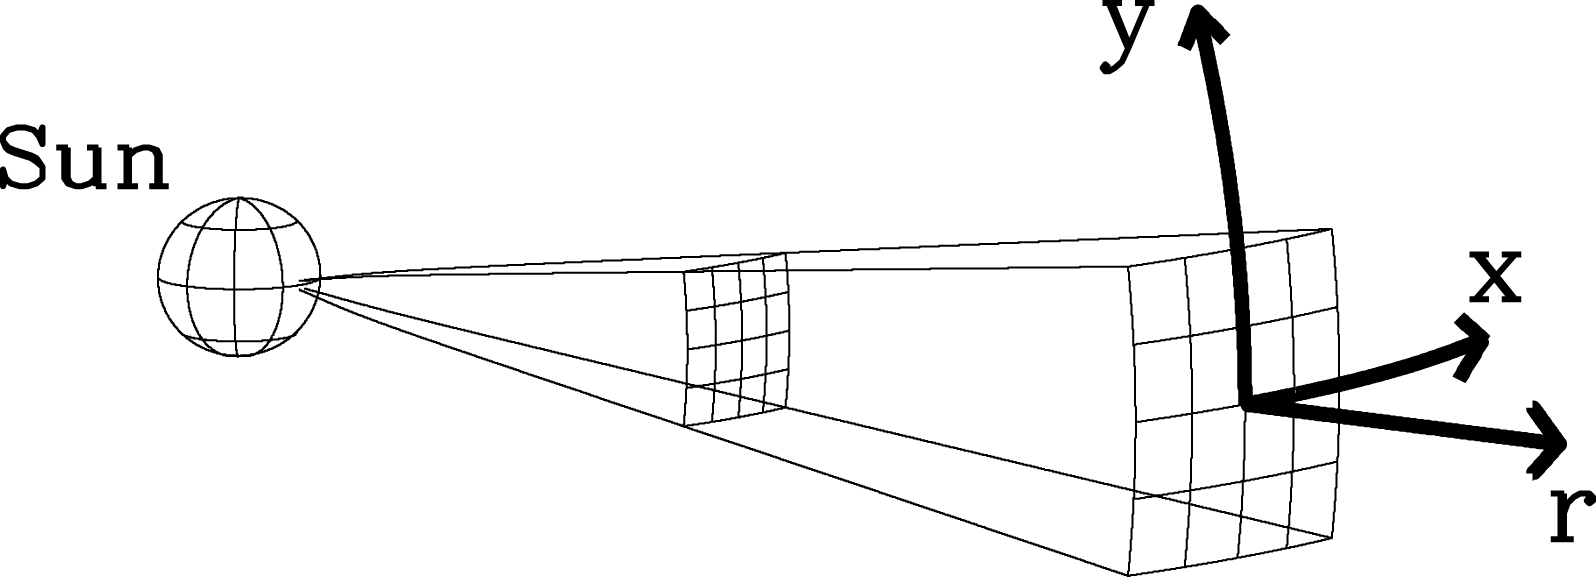
Figure 1. Numerical domain of the REFLECT code.
Table 1. Simulation parameters.
Note:
 $\unicode[STIX]{x1D6FF}v_{\text{ph},\text{rms}}$
is the root mean square (r.m.s.) amplitude of the velocity fluctuation at the photosphere,
$\unicode[STIX]{x1D6FF}v_{\text{ph},\text{rms}}$
is the root mean square (r.m.s.) amplitude of the velocity fluctuation at the photosphere,
 $\unicode[STIX]{x1D70F}_{v}^{\text{(ph)}}$
is the correlation time of the photospheric velocity and
$\unicode[STIX]{x1D70F}_{v}^{\text{(ph)}}$
is the correlation time of the photospheric velocity and
 $L_{\text{box}}$
is the perpendicular dimension (along either the
$L_{\text{box}}$
is the perpendicular dimension (along either the
 $x$
or
$x$
or
 $y$
direction) of the numerical domain.
$y$
direction) of the numerical domain.
Table 2. Glossary of heliocentric distances.
At
 $r>r_{\text{tr}}$
, the field lines of
$r>r_{\text{tr}}$
, the field lines of
 $\boldsymbol{B}_{0}$
are nearly radial, even though we allow for super-radial expansion of the magnetic field. This is because the flux-tube width is much smaller than the characteristic radial distance over which
$\boldsymbol{B}_{0}$
are nearly radial, even though we allow for super-radial expansion of the magnetic field. This is because the flux-tube width is much smaller than the characteristic radial distance over which
 $B_{0}$
varies by a factor of order unity. Because the flux tube is narrow and
$B_{0}$
varies by a factor of order unity. Because the flux tube is narrow and
 $\boldsymbol{B}_{0}$
is nearly radial, we can ignore the curvature of the field-perpendicular surfaces to a good approximation at
$\boldsymbol{B}_{0}$
is nearly radial, we can ignore the curvature of the field-perpendicular surfaces to a good approximation at
 $r>r_{\text{tr}}$
. We thus use Cartesian coordinates,
$r>r_{\text{tr}}$
. We thus use Cartesian coordinates,
 $x$
and
$x$
and
 $y$
, to denote position in the plane perpendicular to the radial line that runs down the centre of the simulation domain.
$y$
, to denote position in the plane perpendicular to the radial line that runs down the centre of the simulation domain.
At
 $r<r_{\text{tr}}$
, our assumption in § 2 that
$r<r_{\text{tr}}$
, our assumption in § 2 that
 $\boldsymbol{B}_{0}$
is nearly radial breaks down, because the flux tube expands so rapidly with height above the photosphere. Because of this, and because we neglect compressive fluctuations, our simulations provide only a crude approximation of chromospheric turbulence. Nevertheless, we retain the chromosphere in our simulations, because turbulence in the actual chromosphere launches a broad spectrum of AWs into the corona (van Ballegooijen et al.
Reference van Ballegooijen, Asgari-Targhi, Cranmer and DeLuca2011), and our model chromosphere gives us a way of approximating this turbulent wave-launching process.
$\boldsymbol{B}_{0}$
is nearly radial breaks down, because the flux tube expands so rapidly with height above the photosphere. Because of this, and because we neglect compressive fluctuations, our simulations provide only a crude approximation of chromospheric turbulence. Nevertheless, we retain the chromosphere in our simulations, because turbulence in the actual chromosphere launches a broad spectrum of AWs into the corona (van Ballegooijen et al.
Reference van Ballegooijen, Asgari-Targhi, Cranmer and DeLuca2011), and our model chromosphere gives us a way of approximating this turbulent wave-launching process.
3.1 Radial profiles of
 $\unicode[STIX]{x1D70C}$
,
$B_{0}$
and
$U$
$\unicode[STIX]{x1D70C}$
,
$B_{0}$
and
$U$


We choose the radial profiles of
 $\unicode[STIX]{x1D70C}$
,
$\unicode[STIX]{x1D70C}$
,
 $U$
and
$U$
and
 $B_{0}$
to approximate the conditions found in coronal holes and the fast solar wind. Above the transition region, at
$B_{0}$
to approximate the conditions found in coronal holes and the fast solar wind. Above the transition region, at
 $r>r_{\text{tr}}$
, we set
$r>r_{\text{tr}}$
, we set
 $$\begin{eqnarray}\displaystyle & \displaystyle \unicode[STIX]{x1D70C}=(10^{9}s^{-15.6}+2.51\times 10^{6}s^{-3.76}+1.85\times 10^{5}s^{-2})m_{\text{p}}~\text{cm}^{-3}, & \displaystyle\end{eqnarray}$$
 $$\begin{eqnarray}\displaystyle & \displaystyle B_{0}=1.5[s^{-6}(f_{\text{max}}-1)+s^{-2}]\,\text{G}, & \displaystyle\end{eqnarray}$$
and
 $$\begin{eqnarray}U=9.25\times 10^{12}\left(\frac{B_{0}}{1\,\text{G}}\right)\left(\frac{\unicode[STIX]{x1D70C}}{m_{\text{p}}~\text{cm}^{-3}}\right)^{-1}\text{cm}\,\text{s}^{-1},\end{eqnarray}$$
where
 $$\begin{eqnarray}\displaystyle & \displaystyle s=\frac{r}{R_{\odot }}, & \displaystyle\end{eqnarray}$$
 $$\begin{eqnarray}\displaystyle & \displaystyle f_{\text{max}}=9 & \displaystyle\end{eqnarray}$$
is the super-radial expansion factor, and
 $m_{\text{p}}$
is the proton mass. Equation (3.4) is adapted from the coronal-hole electron-density measurements of Feldman et al. (Reference Feldman, Habbal, Hoogeveen and Wang1997). We have modified those authors’ density profile by adding the
$m_{\text{p}}$
is the proton mass. Equation (3.4) is adapted from the coronal-hole electron-density measurements of Feldman et al. (Reference Feldman, Habbal, Hoogeveen and Wang1997). We have modified those authors’ density profile by adding the
 $s^{-2}$
term in (3.4) so that the model extrapolates to a reasonable density at large
$s^{-2}$
term in (3.4) so that the model extrapolates to a reasonable density at large
 $r$
and by increasing the coefficient of the
$r$
and by increasing the coefficient of the
 $s^{-15.6}$
term in order to match the low-corona density in the model of Cranmer & van Ballegooijen (Reference Cranmer and van Ballegooijen2005). Equation (3.5) is taken from Hollweg & Isenberg (Reference Hollweg and Isenberg2002). The general form of (3.6) follows from (2.17). The numerical coefficient on the right-hand side of (3.6) is chosen so that
$s^{-15.6}$
term in order to match the low-corona density in the model of Cranmer & van Ballegooijen (Reference Cranmer and van Ballegooijen2005). Equation (3.5) is taken from Hollweg & Isenberg (Reference Hollweg and Isenberg2002). The general form of (3.6) follows from (2.17). The numerical coefficient on the right-hand side of (3.6) is chosen so that
 $$\begin{eqnarray}U(r_{\text{b}})=1.2~\text{km}~\text{s}^{-1}\quad U(1~\text{au})=750~\text{km}~\text{s}^{-1},\end{eqnarray}$$
where
 $$\begin{eqnarray}r_{\text{b}}=1.0027R_{\odot }\end{eqnarray}$$
is a heliocentric distance just larger than
 $r_{\text{tr}}$
that we take to correspond to the base of the corona. Given the radial profiles in (3.4) through (3.6), the Alfvén critical point is at
$r_{\text{tr}}$
that we take to correspond to the base of the corona. Given the radial profiles in (3.4) through (3.6), the Alfvén critical point is at
 $$\begin{eqnarray}r_{\text{A}}=11.1R_{\odot },\end{eqnarray}$$
the Alfvén speed reaches its maximum value at
 $$\begin{eqnarray}r_{\text{m}}=1.71R_{\odot },\end{eqnarray}$$
and
 $$\begin{eqnarray}v_{\text{A}}(r_{\text{b}})=935~\text{km}~\text{s}^{-1}\quad v_{\text{A}}(r_{\text{m}})=2730~\text{km}~\text{s}^{-1}\quad v_{\text{A}}(r_{\text{A}})=U(r_{\text{A}})=627~\text{km}~\text{s}^{-1}.\end{eqnarray}$$
Below the transition region, we set
 $$\begin{eqnarray}\unicode[STIX]{x1D70C}=\unicode[STIX]{x1D70C}_{\text{ph}}\text{e}^{c(1-s)/s},\end{eqnarray}$$
where
 $$\begin{eqnarray}\unicode[STIX]{x1D70C}_{\text{ph}}=4.78\times 10^{16}m_{\text{p}}\text{cm}^{-3}\end{eqnarray}$$
is the photospheric density,
 $c=[s_{\text{tr}}/(1-s_{\text{tr}})]\ln (\unicode[STIX]{x1D70C}_{\text{tr},<}/\unicode[STIX]{x1D70C}_{\text{ph}})$
,
$c=[s_{\text{tr}}/(1-s_{\text{tr}})]\ln (\unicode[STIX]{x1D70C}_{\text{tr},<}/\unicode[STIX]{x1D70C}_{\text{ph}})$
,
 $s_{\text{tr}}=r_{\text{tr}}/R_{\odot }$
and
$s_{\text{tr}}=r_{\text{tr}}/R_{\odot }$
and
 $\unicode[STIX]{x1D70C}_{\text{tr},<}$
is the density just below the transition region, which we take to be 100 times greater than the value of the density at
$\unicode[STIX]{x1D70C}_{\text{tr},<}$
is the density just below the transition region, which we take to be 100 times greater than the value of the density at
 $r=r_{\text{tr}}$
from (3.4). We then set (cf. van Ballegooijen et al.
Reference van Ballegooijen, Asgari-Targhi, Cranmer and DeLuca2011)
$r=r_{\text{tr}}$
from (3.4). We then set (cf. van Ballegooijen et al.
Reference van Ballegooijen, Asgari-Targhi, Cranmer and DeLuca2011)
 $$\begin{eqnarray}B=\left[\frac{(B_{\text{ph}}^{2}-B_{\text{tr}}^{2})(\unicode[STIX]{x1D70C}-\unicode[STIX]{x1D70C}_{\text{tr},<})}{\unicode[STIX]{x1D70C}_{\text{ph}}-\unicode[STIX]{x1D70C}_{\text{tr},<}}+B_{\text{tr}}^{2}\right]^{1/2},\end{eqnarray}$$
at
 $r<r_{\text{tr}}$
, where
$r<r_{\text{tr}}$
, where
 $$\begin{eqnarray}B_{\text{ph}}=1400~\text{G}\end{eqnarray}$$
is the assumed magnetic-field strength in the photospheric footpoint of the simulated flux tube, and
 $B_{\text{tr}}$
is the value of
$B_{\text{tr}}$
is the value of
 $B$
at
$B$
at
 $r=r_{\text{tr}}$
from (3.5).
$r=r_{\text{tr}}$
from (3.5).
We plot the radial profiles of
 $\unicode[STIX]{x1D70C}$
,
$\unicode[STIX]{x1D70C}$
,
 $B$
,
$B$
,
 $U$
and
$U$
and
 $v_{\text{A}}$
in figure 2. We also plot the
$v_{\text{A}}$
in figure 2. We also plot the
 $\boldsymbol{z}^{+}$
travel time between the photosphere and radius
$\boldsymbol{z}^{+}$
travel time between the photosphere and radius
 $r$
,
$r$
,
 $$\begin{eqnarray}T(r)=\int _{R_{\odot }}^{r}\frac{\text{d}r}{U+v_{\text{A}}}.\end{eqnarray}$$

Figure 2. The radial profiles of the solar-wind outflow velocity
 $U$
, Alfvén speed
$U$
, Alfvén speed
 $v_{\text{A}}$
, plasma density
$v_{\text{A}}$
, plasma density
 $\unicode[STIX]{x1D70C}$
divided by the proton mass
$\unicode[STIX]{x1D70C}$
divided by the proton mass
 $m_{\text{p}}$
, background magnetic-field strength
$m_{\text{p}}$
, background magnetic-field strength
 $B_{0}$
and
$B_{0}$
and
 $\boldsymbol{z}^{+}$
travel time from the transition region
$\boldsymbol{z}^{+}$
travel time from the transition region
 $T(r)$
in our direct numerical simulations. We use the same profiles when evaluating quantities in the analytic model that we present in § 4.
$T(r)$
in our direct numerical simulations. We use the same profiles when evaluating quantities in the analytic model that we present in § 4.
3.2 Boundary conditions
We take the
 $\boldsymbol{z}^{\pm }$
fluctuations to satisfy periodic boundary conditions in the
$\boldsymbol{z}^{\pm }$
fluctuations to satisfy periodic boundary conditions in the
 $xy$
-plane. At the photosphere, we impose a time-dependent velocity field. We set the velocity Fourier components at the photosphere equal to zero when
$xy$
-plane. At the photosphere, we impose a time-dependent velocity field. We set the velocity Fourier components at the photosphere equal to zero when
 $k_{\bot }>3\times 2\unicode[STIX]{x03C0}/L_{\text{box}}(R_{\odot })$
, where
$k_{\bot }>3\times 2\unicode[STIX]{x03C0}/L_{\text{box}}(R_{\odot })$
, where
 $$\begin{eqnarray}k_{\bot }=\sqrt{k_{x}^{2}+k_{y}^{2}},\end{eqnarray}$$
and
 $k_{x}$
and
$k_{x}$
and
 $k_{y}$
are the
$k_{y}$
are the
 $x$
and
$x$
and
 $y$
components of the wave vector
$y$
components of the wave vector
 $\boldsymbol{k}$
. We set the amplitudes of the velocity Fourier components at
$\boldsymbol{k}$
. We set the amplitudes of the velocity Fourier components at
 $k_{\bot }\leqslant 3\times 2\unicode[STIX]{x03C0}/L_{\text{box}}(R_{\odot })$
equal to a constant, which we choose so that the r.m.s. amplitude of the fluctuating velocity at the photosphere is
$k_{\bot }\leqslant 3\times 2\unicode[STIX]{x03C0}/L_{\text{box}}(R_{\odot })$
equal to a constant, which we choose so that the r.m.s. amplitude of the fluctuating velocity at the photosphere is
 $$\begin{eqnarray}\unicode[STIX]{x1D6FF}v_{\text{ph},\text{rms}}=1.3~\text{km}~\text{s}^{-1},\end{eqnarray}$$
consistent with observational constraints on the velocities of solar granules (Richardson & Schwarzschild Reference Richardson and Schwarzschild1950). We then assign random values to the phases of these velocity Fourier components at the discrete set of times
 $t_{\text{n}}=n\,\unicode[STIX]{x1D70F}_{0}$
, where
$t_{\text{n}}=n\,\unicode[STIX]{x1D70F}_{0}$
, where
 $\unicode[STIX]{x1D70F}_{0}=5~\text{min}$
in Run 1 and
$\unicode[STIX]{x1D70F}_{0}=5~\text{min}$
in Run 1 and
 $\unicode[STIX]{x1D70F}_{0}=20~\text{min}$
in Runs 2 and 3. To determine the phases at times between successive
$\unicode[STIX]{x1D70F}_{0}=20~\text{min}$
in Runs 2 and 3. To determine the phases at times between successive
 $t_{\text{n}}$
, we use cubic interpolation in time. We define the correlation time of the photospheric velocity
$t_{\text{n}}$
, we use cubic interpolation in time. We define the correlation time of the photospheric velocity
 $\unicode[STIX]{x1D70F}_{v}^{\text{(ph)}}$
to be the time lag over which the normalized velocity autocorrelation function decreases from 1 to 0.5. The resulting velocity correlation times are listed in table 1.
$\unicode[STIX]{x1D70F}_{v}^{\text{(ph)}}$
to be the time lag over which the normalized velocity autocorrelation function decreases from 1 to 0.5. The resulting velocity correlation times are listed in table 1.
Our choices of
 $\unicode[STIX]{x1D70F}_{0}$
and
$\unicode[STIX]{x1D70F}_{0}$
and
 $L_{\text{box}}(R_{\odot })$
determine (at least in part – see § 3.7) the correlation time
$L_{\text{box}}(R_{\odot })$
determine (at least in part – see § 3.7) the correlation time
 $\unicode[STIX]{x1D70F}_{\text{c}}$
and perpendicular correlation length
$\unicode[STIX]{x1D70F}_{\text{c}}$
and perpendicular correlation length
 $L_{\bot }$
of the AWs launched by the Sun. (Since we only drive photospheric velocity modes with
$L_{\bot }$
of the AWs launched by the Sun. (Since we only drive photospheric velocity modes with
 $k_{\bot }\leqslant 3\times 2\unicode[STIX]{x03C0}/L_{\text{box}}(R_{\odot })$
,
$k_{\bot }\leqslant 3\times 2\unicode[STIX]{x03C0}/L_{\text{box}}(R_{\odot })$
,
 $L_{\bot }$
is a few times smaller than
$L_{\bot }$
is a few times smaller than
 $L_{\text{box}}$
.) Estimates of
$L_{\text{box}}$
.) Estimates of
 $L_{\bot }(r_{\text{b}})$
range from
$L_{\bot }(r_{\text{b}})$
range from
 $\simeq 10^{3}~\text{km}$
(Cranmer et al.
Reference Cranmer, van Ballegooijen and Edgar2007; Hollweg et al.
Reference Hollweg, Cranmer and Chandran2010; van Ballegooijen & Asgari-Targhi Reference van Ballegooijen and Asgari-Targhi2016; van Ballegooijen & Asgari-Targhi Reference van Ballegooijen and Asgari-Targhi2017) to more than
$\simeq 10^{3}~\text{km}$
(Cranmer et al.
Reference Cranmer, van Ballegooijen and Edgar2007; Hollweg et al.
Reference Hollweg, Cranmer and Chandran2010; van Ballegooijen & Asgari-Targhi Reference van Ballegooijen and Asgari-Targhi2016; van Ballegooijen & Asgari-Targhi Reference van Ballegooijen and Asgari-Targhi2017) to more than
 $10^{4}~\text{km}$
(Dmitruk et al.
Reference Dmitruk, Matthaeus, Milano, Oughton, Zank and Mullan2002; Verdini & Velli Reference Verdini and Velli2007; Verdini et al.
Reference Verdini, Grappin, Pinto and Velli2012), and estimates of
$10^{4}~\text{km}$
(Dmitruk et al.
Reference Dmitruk, Matthaeus, Milano, Oughton, Zank and Mullan2002; Verdini & Velli Reference Verdini and Velli2007; Verdini et al.
Reference Verdini, Grappin, Pinto and Velli2012), and estimates of
 $\unicode[STIX]{x1D70F}_{\text{c}}(r_{\text{b}})$
range from
$\unicode[STIX]{x1D70F}_{\text{c}}(r_{\text{b}})$
range from
 $\simeq 1$
–5 min (Cranmer & van Ballegooijen Reference Cranmer and van Ballegooijen2005; van Ballegooijen & Asgari-Targhi Reference van Ballegooijen and Asgari-Targhi2016; van Ballegooijen & Asgari-Targhi Reference van Ballegooijen and Asgari-Targhi2017) to one or more hours (Dmitruk & Matthaeus Reference Dmitruk and Matthaeus2003). Given the uncertainty in
$\simeq 1$
–5 min (Cranmer & van Ballegooijen Reference Cranmer and van Ballegooijen2005; van Ballegooijen & Asgari-Targhi Reference van Ballegooijen and Asgari-Targhi2016; van Ballegooijen & Asgari-Targhi Reference van Ballegooijen and Asgari-Targhi2017) to one or more hours (Dmitruk & Matthaeus Reference Dmitruk and Matthaeus2003). Given the uncertainty in
 $L_{\bot }(r_{\text{b}})$
and
$L_{\bot }(r_{\text{b}})$
and
 $\unicode[STIX]{x1D70F}_{\text{c}}(r_{\text{b}})$
, we vary
$\unicode[STIX]{x1D70F}_{\text{c}}(r_{\text{b}})$
, we vary
 $L_{\text{box}}(R_{\odot })$
and
$L_{\text{box}}(R_{\odot })$
and
 $\unicode[STIX]{x1D70F}_{0}$
by factors of 4 and 5, respectively, in our different simulations in order to investigate how the values of
$\unicode[STIX]{x1D70F}_{0}$
by factors of 4 and 5, respectively, in our different simulations in order to investigate how the values of
 $L_{\bot }(r_{\text{b}})$
and
$L_{\bot }(r_{\text{b}})$
and
 $\unicode[STIX]{x1D70F}_{\text{c}}(r_{\text{b}})$
influence the properties of the turbulence at larger
$\unicode[STIX]{x1D70F}_{\text{c}}(r_{\text{b}})$
influence the properties of the turbulence at larger
 $r$
.
$r$
.
No information flows into the simulation domain through the outer boundary at
 $r=r_{\text{max}}$
, because
$r=r_{\text{max}}$
, because
 $r_{\text{max}}>r_{\text{A}}$
. We thus do not impose an additional boundary condition at the outer boundary.
$r_{\text{max}}>r_{\text{A}}$
. We thus do not impose an additional boundary condition at the outer boundary.
3.3 Hyper-dissipation
To dissipate the fluctuation energy that cascades to small wavelengths, we add a hyper-dissipation term of the form
 $$\begin{eqnarray}D_{g}=-\unicode[STIX]{x1D708}_{g}\left(\frac{\unicode[STIX]{x2202}^{2}}{\unicode[STIX]{x2202}x^{2}}+\frac{\unicode[STIX]{x2202}^{2}}{\unicode[STIX]{x2202}y^{2}}\right)^{4}\boldsymbol{g}\end{eqnarray}$$
to the right-hand side of (2.19), and a hyper-dissipation term of the form
 $$\begin{eqnarray}D_{f}=-\unicode[STIX]{x1D708}_{f}\left(\frac{\unicode[STIX]{x2202}^{2}}{\unicode[STIX]{x2202}x^{2}}+\frac{\unicode[STIX]{x2202}^{2}}{\unicode[STIX]{x2202}y^{2}}\right)^{4}\boldsymbol{f}\end{eqnarray}$$
to the right-hand side of (2.20). We choose the magnitude and radial dependence of the hyper-dissipation coefficients
 $\unicode[STIX]{x1D708}_{g}$
and
$\unicode[STIX]{x1D708}_{g}$
and
 $\unicode[STIX]{x1D708}_{f}$
so that dissipation becomes important near the grid scale at all radii in each simulation. In particular, we take
$\unicode[STIX]{x1D708}_{f}$
so that dissipation becomes important near the grid scale at all radii in each simulation. In particular, we take
 $\unicode[STIX]{x1D708}_{g}$
and
$\unicode[STIX]{x1D708}_{g}$
and
 $\unicode[STIX]{x1D708}_{f}$
to be proportional to
$\unicode[STIX]{x1D708}_{f}$
to be proportional to
 $[L_{\text{box}}(r)/L_{\text{box}}(R_{\odot })]^{8}$
.
$[L_{\text{box}}(r)/L_{\text{box}}(R_{\odot })]^{8}$
.
3.4 Numerical algorithm
The REFLECT code solves (2.19) and (2.20) using a spectral element method based on a Chebyshev–Fourier basis (Canuto et al.
Reference Canuto, Hussaini, Quarteroni and Zang1988). In each of our three simulations, we split the numerical domain into 1024 subdomains. Each subdomain covers the full flux-tube cross-section pictured in figure 1 using 256 grid points along both the
 $x$
and
$x$
and
 $y$
directions, but only part of the flux tube’s radial extent. Along the
$y$
directions, but only part of the flux tube’s radial extent. Along the
 $r$
axis, each subdomain contains 17 grid points, two of which are boundary grid points. The total number of radial grid points is 16 385. Except at
$r$
axis, each subdomain contains 17 grid points, two of which are boundary grid points. The total number of radial grid points is 16 385. Except at
 $r_{\text{min}}$
and
$r_{\text{min}}$
and
 $r_{\max }$
, these boundary grid points are shared by neighbouring subdomains. Eight of the subdomains are in the chromosphere.
$r_{\max }$
, these boundary grid points are shared by neighbouring subdomains. Eight of the subdomains are in the chromosphere.

Figure 3. Panels (a,b,c) show the r.m.s. amplitudes of
 $\boldsymbol{z}^{\pm }$
in Runs 1 through 3 and in the analytic model described in § 4. The lower-right panel shows
$\boldsymbol{z}^{\pm }$
in Runs 1 through 3 and in the analytic model described in § 4. The lower-right panel shows
 $\unicode[STIX]{x1D6FF}B_{\text{rms}}/B_{0}$
in Runs 1 through 3, where
$\unicode[STIX]{x1D6FF}B_{\text{rms}}/B_{0}$
in Runs 1 through 3, where
 $\unicode[STIX]{x1D6FF}B_{\text{rms}}$
is the r.m.s. amplitude of the magnetic-field fluctuation.
$\unicode[STIX]{x1D6FF}B_{\text{rms}}$
is the r.m.s. amplitude of the magnetic-field fluctuation.
A Chebyshev/Fourier transform of (2.19) and (2.20) leads to a system of ordinary differential equations for the Chebyshev–Fourier coefficients in each subdomain. These equations are coupled through matching conditions (continuity of
 $\unicode[STIX]{x1D6FF}\boldsymbol{v}$
and
$\unicode[STIX]{x1D6FF}\boldsymbol{v}$
and
 $\unicode[STIX]{x1D6FF}\boldsymbol{B}$
) at the boundaries between neighbouring subdomains. The REFLECT code advances the solution forward in time using a third-order Runge–Kutta method, with an integrating factor to handle the hyper-dissipation terms. Within each subdomain, the REFLECT code discretizes the radial interval using a Gauss–Lobatto grid, which makes it possible to compute the Chebyshev transform using a fast cosine transform.
$\unicode[STIX]{x1D6FF}\boldsymbol{B}$
) at the boundaries between neighbouring subdomains. The REFLECT code advances the solution forward in time using a third-order Runge–Kutta method, with an integrating factor to handle the hyper-dissipation terms. Within each subdomain, the REFLECT code discretizes the radial interval using a Gauss–Lobatto grid, which makes it possible to compute the Chebyshev transform using a fast cosine transform.
3.5 Duration of the simulations
We run each simulation from
 $t=0$
until
$t=0$
until
 $t=13.2~\text{h}$
. Between
$t=13.2~\text{h}$
. Between
 $t=0$
and
$t=0$
and
 $t=4~\text{h}$
, the magnetic and kinetic energies in the simulations fluctuate while trending upwards. For reference, it takes 1.3 h for an outward-propagating AW to travel from the photosphere to the Alfvén critical point at
$t=4~\text{h}$
, the magnetic and kinetic energies in the simulations fluctuate while trending upwards. For reference, it takes 1.3 h for an outward-propagating AW to travel from the photosphere to the Alfvén critical point at
 $r_{\text{A}}=11.1R_{\odot }$
, and 3 h for an outward-propagating AW to travel from the photosphere to
$r_{\text{A}}=11.1R_{\odot }$
, and 3 h for an outward-propagating AW to travel from the photosphere to
 $r_{\text{max}}=21R_{\odot }$
(see figure 2). After
$r_{\text{max}}=21R_{\odot }$
(see figure 2). After
 $t\simeq 4~\text{h}$
, the magnetic and kinetic energies fluctuate around a steady value. We regard the turbulence as being in a statistical steady state at
$t\simeq 4~\text{h}$
, the magnetic and kinetic energies fluctuate around a steady value. We regard the turbulence as being in a statistical steady state at
 $t>6~\text{h}$
. All the numerical results that we present are calculated from time averages between
$t>6~\text{h}$
. All the numerical results that we present are calculated from time averages between
 $t=6~\text{h}$
and
$t=6~\text{h}$
and
 $t=13.2~\text{h}$
, except for the
$t=13.2~\text{h}$
, except for the
 $z_{\text{HF},\text{rms}}^{+}$
and
$z_{\text{HF},\text{rms}}^{+}$
and
 $z_{\text{LF},\text{rms}}^{+}$
profiles in Run 2; those profiles, because of technical difficulties, were only computed from averages between
$z_{\text{LF},\text{rms}}^{+}$
profiles in Run 2; those profiles, because of technical difficulties, were only computed from averages between
 $t=12~\text{h}$
and
$t=12~\text{h}$
and
 $t=13~\text{h}$
.
$t=13~\text{h}$
.
3.6 Radial profiles of the fluctuation amplitudes
In figure 3, we plot the r.m.s. amplitudes of
 $\boldsymbol{z}^{\pm }$
, denoted
$\boldsymbol{z}^{\pm }$
, denoted
 $z_{\text{rms}}^{\pm }$
, as a function of
$z_{\text{rms}}^{\pm }$
, as a function of
 $r$
in Runs 1 through 3 and in the analytic model discussed in § 4. The lower-right panel of figure 3 shows the fractional variation in the magnetic-field strength as a function of
$r$
in Runs 1 through 3 and in the analytic model discussed in § 4. The lower-right panel of figure 3 shows the fractional variation in the magnetic-field strength as a function of
 $r$
in our three numerical simulations. In all three simulations,
$r$
in our three numerical simulations. In all three simulations,
 $z_{\text{rms}}^{+}\simeq z_{\text{rms}}^{-}$
in the chromosphere, because of strong AW reflection at the transition region and photosphere. On the other hand,
$z_{\text{rms}}^{+}\simeq z_{\text{rms}}^{-}$
in the chromosphere, because of strong AW reflection at the transition region and photosphere. On the other hand,
 $z_{\text{rms}}^{+}\gg z_{\text{rms}}^{-}$
in the corona and solar wind because of the limited efficiency of reflection in these regions and because
$z_{\text{rms}}^{+}\gg z_{\text{rms}}^{-}$
in the corona and solar wind because of the limited efficiency of reflection in these regions and because
 $\boldsymbol{z}^{-}$
fluctuations are rapidly cascaded to small scales by the large-amplitude
$\boldsymbol{z}^{-}$
fluctuations are rapidly cascaded to small scales by the large-amplitude
 $\boldsymbol{z}^{+}$
fluctuations.
$\boldsymbol{z}^{+}$
fluctuations.
The value of
 $z_{\text{rms}}^{+}$
increases between
$z_{\text{rms}}^{+}$
increases between
 $r=R_{\odot }$
and
$r=R_{\odot }$
and
 $r=5R_{\odot }$
because of the radially decreasing density profile. Equation (2.19) implies that the r.m.s. amplitude of
$r=5R_{\odot }$
because of the radially decreasing density profile. Equation (2.19) implies that the r.m.s. amplitude of
 $\boldsymbol{g}$
(
$\boldsymbol{g}$
(
 $g_{\text{rms}}$
) is independent of
$g_{\text{rms}}$
) is independent of
 $r$
when (i) the fluctuations are in a statistical steady state, (ii)
$r$
when (i) the fluctuations are in a statistical steady state, (ii)
 $z_{\text{rms}}^{-}\ll z_{\text{rms}}^{+}$
and (iii) nonlinear interactions can be ignored. At
$z_{\text{rms}}^{-}\ll z_{\text{rms}}^{+}$
and (iii) nonlinear interactions can be ignored. At
 $r<5R_{\odot }$
,
$r<5R_{\odot }$
,
 $\unicode[STIX]{x1D70C}(r)\gg \unicode[STIX]{x1D70C}(r_{\text{A}})$
, and it follows from (2.15) that
$\unicode[STIX]{x1D70C}(r)\gg \unicode[STIX]{x1D70C}(r_{\text{A}})$
, and it follows from (2.15) that
 $z_{\text{rms}}^{+}\propto g_{\text{rms}}\unicode[STIX]{x1D70C}^{-1/4}$
. Equations (2.15) and (2.19) thus imply that the linear physics of AW propagation causes
$z_{\text{rms}}^{+}\propto g_{\text{rms}}\unicode[STIX]{x1D70C}^{-1/4}$
. Equations (2.15) and (2.19) thus imply that the linear physics of AW propagation causes
 $z_{\text{rms}}^{+}$
to increase rapidly with increasing
$z_{\text{rms}}^{+}$
to increase rapidly with increasing
 $r$
at
$r$
at
 $r<5R_{\odot }$
, since
$r<5R_{\odot }$
, since
 $z_{\text{rms}}^{-}\ll z_{\text{rms}}^{+}$
in this region. When nonlinear interactions are taken into account,
$z_{\text{rms}}^{-}\ll z_{\text{rms}}^{+}$
in this region. When nonlinear interactions are taken into account,
 $g_{\text{rms}}$
becomes a decreasing function of
$g_{\text{rms}}$
becomes a decreasing function of
 $r$
, but the linear physics ‘wins out’ at
$r$
, but the linear physics ‘wins out’ at
 $r<5R_{\odot }$
, in the sense that
$r<5R_{\odot }$
, in the sense that
 $z_{\text{rms}}^{+}\propto g_{\text{rms}}\unicode[STIX]{x1D70C}^{-1/4}$
remains an increasing function of
$z_{\text{rms}}^{+}\propto g_{\text{rms}}\unicode[STIX]{x1D70C}^{-1/4}$
remains an increasing function of
 $r$
. Since the rate of non-WKB reflection vanishes at
$r$
. Since the rate of non-WKB reflection vanishes at
 $r=r_{\text{m}}=1.71R_{\odot }$
, the
$r=r_{\text{m}}=1.71R_{\odot }$
, the
 $z^{-}$
fluctuations seen at
$z^{-}$
fluctuations seen at
 $r=r_{\text{m}}$
in all three simulations must be generated elsewhere. At
$r=r_{\text{m}}$
in all three simulations must be generated elsewhere. At
 $r<r_{\text{A}}$
,
$r<r_{\text{A}}$
,
 $z^{-}$
fluctuations propagate with a negative radial velocity once they are produced, and thus the
$z^{-}$
fluctuations propagate with a negative radial velocity once they are produced, and thus the
 $z^{-}$
fluctuations seen at
$z^{-}$
fluctuations seen at
 $r=r_{\text{m}}$
in the simulations originate at
$r=r_{\text{m}}$
in the simulations originate at
 $r>r_{\text{m}}$
.
$r>r_{\text{m}}$
.
3.7 Two components of outward-propagating fluctuations
In our simulations, the transition region, which acts like an AW antenna, is characterized by two time scales at the perpendicular outer scale of the turbulence, which we take to be
 $$\begin{eqnarray}L_{\bot }={\textstyle \frac{1}{3}}L_{\text{box}}.\end{eqnarray}$$
The first time scale is the correlation time of the photospheric velocity field,
 $\unicode[STIX]{x1D70F}_{v}^{\text{(ph)}}$
, which we define as the time increment required for the normalized velocity autocorrelation function at the photosphere to decrease from 1 to 0.5. This time increment is 3.3 min, 9.6 min and 9.3 min in Runs 1, 2 and 3, respectively, as displayed in table 1. The second time scale is the nonlinear time scale
$\unicode[STIX]{x1D70F}_{v}^{\text{(ph)}}$
, which we define as the time increment required for the normalized velocity autocorrelation function at the photosphere to decrease from 1 to 0.5. This time increment is 3.3 min, 9.6 min and 9.3 min in Runs 1, 2 and 3, respectively, as displayed in table 1. The second time scale is the nonlinear time scale
 $$\begin{eqnarray}\unicode[STIX]{x1D70F}_{\text{nl}}=\frac{L_{\bot }}{z_{\text{rms}}^{\pm }}\end{eqnarray}$$
of the balanced turbulence (‘balanced’ meaning that
 $z_{\text{rms}}^{+}\simeq z_{\text{rms}}^{-}$
) just below the transition region at
$z_{\text{rms}}^{+}\simeq z_{\text{rms}}^{-}$
) just below the transition region at
 $r=r_{\text{tr},<}=r_{\text{tr}}-\unicode[STIX]{x1D716}$
, where
$r=r_{\text{tr},<}=r_{\text{tr}}-\unicode[STIX]{x1D716}$
, where
 $\unicode[STIX]{x1D716}$
is an infinitesimal distance, and
$\unicode[STIX]{x1D716}$
is an infinitesimal distance, and
 $z_{\text{rms}}^{\pm }(r_{\text{tr},<})\simeq 30~\text{km}~\text{s}^{-1}$
. (Section 3.10 discusses an effect that shortens this second time scale relative to the estimate in (3.24) in Runs 1 and 2.) Although the right-hand side of (3.24) contains a
$z_{\text{rms}}^{\pm }(r_{\text{tr},<})\simeq 30~\text{km}~\text{s}^{-1}$
. (Section 3.10 discusses an effect that shortens this second time scale relative to the estimate in (3.24) in Runs 1 and 2.) Although the right-hand side of (3.24) contains a
 $\pm$
sign, we do not include a
$\pm$
sign, we do not include a
 $\pm$
sign on the left-hand side, because we will only evaluate (3.24) at locations at which
$\pm$
sign on the left-hand side, because we will only evaluate (3.24) at locations at which
 $z_{\text{rms}}^{+}\simeq z_{\text{rms}}^{-}$
. We define
$z_{\text{rms}}^{+}\simeq z_{\text{rms}}^{-}$
. We define
 $$\begin{eqnarray}\unicode[STIX]{x1D70F}_{\text{nl}}^{\text{(tr)}}=\unicode[STIX]{x1D70F}_{\text{nl}}(r_{\text{tr},<}).\end{eqnarray}$$
Given the values of
 $L_{\text{box}}(r_{\text{tr}})$
listed in table 1,
$L_{\text{box}}(r_{\text{tr}})$
listed in table 1,
 $\unicode[STIX]{x1D70F}_{\text{nl}}^{\text{(tr)}}$
is 0.8 min, 0.8 min and 3 min in Runs 1, 2 and 3, respectively, values that are several times smaller than
$\unicode[STIX]{x1D70F}_{\text{nl}}^{\text{(tr)}}$
is 0.8 min, 0.8 min and 3 min in Runs 1, 2 and 3, respectively, values that are several times smaller than
 $\unicode[STIX]{x1D70F}_{v}^{\text{(ph)}}$
. This suggests that the transition region in our simulations launches two populations of
$\unicode[STIX]{x1D70F}_{v}^{\text{(ph)}}$
. This suggests that the transition region in our simulations launches two populations of
 $\boldsymbol{z}^{+}$
fluctuations characterized by different time scales and hence different radial correlation lengths.
$\boldsymbol{z}^{+}$
fluctuations characterized by different time scales and hence different radial correlation lengths.


To investigate this possibility, we define
 $$\begin{eqnarray}\boldsymbol{g}_{\text{LF}}(\tilde{x},{\tilde{y}},r,t)=\frac{1}{2\unicode[STIX]{x1D6E5}}\int _{r_{\text{i}}}^{r_{\text{i}}+2\unicode[STIX]{x1D6E5}}\text{d}r^{\prime }\boldsymbol{g}(\tilde{x},{\tilde{y}},r^{\prime },t),\end{eqnarray}$$
 $$\begin{eqnarray}g_{\text{LF},\text{rms}}=\langle |\boldsymbol{g}_{\text{LF}}|^{2}\rangle ^{1/2},\end{eqnarray}$$
and
 $$\begin{eqnarray}g_{\text{HF},\text{rms}}=\sqrt{g_{\text{rms}}^{2}-g_{\text{LF},\text{rms}}^{2}},\end{eqnarray}$$
where
 $\tilde{x}=x/L_{\text{box}}$
,
$\tilde{x}=x/L_{\text{box}}$
,
 ${\tilde{y}}=y/L_{\text{box}}$
, and
${\tilde{y}}=y/L_{\text{box}}$
, and
 $\langle \cdots \rangle$
denotes an average over
$\langle \cdots \rangle$
denotes an average over
 $x$
,
$x$
,
 $y$
and
$y$
and
 $t$
. The quantity
$t$
. The quantity
 $$\begin{eqnarray}\unicode[STIX]{x1D6E5}=c_{\text{av}}\unicode[STIX]{x1D70F}_{\text{nl}}^{\text{(tr)}}v_{\text{A}}(r_{\text{b}})\end{eqnarray}$$
is the approximate radial correlation length in the low corona of a
 $\boldsymbol{z}^{+}$
fluctuation that is generated by a disturbance at the transition region whose correlation time is
$\boldsymbol{z}^{+}$
fluctuation that is generated by a disturbance at the transition region whose correlation time is
 $\unicode[STIX]{x1D70F}_{\text{nl}}^{\text{(tr)}}$
,
$\unicode[STIX]{x1D70F}_{\text{nl}}^{\text{(tr)}}$
,
 $$\begin{eqnarray}r_{\text{i}}=\left\{\begin{array}{@{}ll@{}}r_{\text{min}} & \text{if}~r<r_{\text{min}}+\unicode[STIX]{x1D6E5},\\ r-\unicode[STIX]{x1D6E5} & \text{if}~r_{\text{min}}+\unicode[STIX]{x1D6E5}\leqslant r\leqslant r_{\text{max}}-\unicode[STIX]{x1D6E5},\\ r_{\text{max}}-2\unicode[STIX]{x1D6E5} & \text{if}~r>r_{\text{max}}-\unicode[STIX]{x1D6E5}\end{array}\right.\end{eqnarray}$$
and
 $c_{\text{av}}$
is a dimensionless constant of order unity. We set
$c_{\text{av}}$
is a dimensionless constant of order unity. We set
 $$\begin{eqnarray}c_{\text{av}}\simeq 0.6,\end{eqnarray}$$
which enables us to carry out the radial average in (3.26) in a computationally efficient way, using an integer number of subdomains. Given the above definitions,
 $\unicode[STIX]{x1D6E5}=0.08R_{\odot }$
in Runs 1 and 2, and
$\unicode[STIX]{x1D6E5}=0.08R_{\odot }$
in Runs 1 and 2, and
 $\unicode[STIX]{x1D6E5}=0.32R_{\odot }$
in Run 3. We define
$\unicode[STIX]{x1D6E5}=0.32R_{\odot }$
in Run 3. We define
 $$\begin{eqnarray}z_{\text{LF},\text{rms}}^{+}=\frac{\unicode[STIX]{x1D702}^{1/4}g_{\text{LF},\text{rms}}}{1+\unicode[STIX]{x1D702}^{1/2}}\quad z_{\text{HF},\text{rms}}^{+}=\frac{\unicode[STIX]{x1D702}^{1/4}g_{\text{HF},\text{rms}}}{1+\unicode[STIX]{x1D702}^{1/2}}.\end{eqnarray}$$
We emphasize that, although we use the subscripts ‘LF’ and ‘HF’ as shorthand for ‘low frequency’ and ‘high frequency’, the defining difference between
 $z_{\text{LF},\text{rms}}^{+}$
and
$z_{\text{LF},\text{rms}}^{+}$
and
 $z_{\text{HF},\text{rms}}^{+}$
is the difference in their radial correlation lengths.
$z_{\text{HF},\text{rms}}^{+}$
is the difference in their radial correlation lengths.
In figure 4 we plot the radial profiles of
 $z_{\text{LF},\text{rms}}^{+}$
and
$z_{\text{LF},\text{rms}}^{+}$
and
 $z_{\text{HF},\text{rms}}^{+}$
in our numerical simulations and the analytic model of § 4. As this figure shows, all three simulations contain both
$z_{\text{HF},\text{rms}}^{+}$
in our numerical simulations and the analytic model of § 4. As this figure shows, all three simulations contain both
 $\boldsymbol{z}_{\text{LF}}^{+}$
and
$\boldsymbol{z}_{\text{LF}}^{+}$
and
 $\boldsymbol{z}_{\text{HF}}^{+}$
fluctuations, and these fluctuations evolve in different ways as they propagate away from the Sun. In all three runs,
$\boldsymbol{z}_{\text{HF}}^{+}$
fluctuations, and these fluctuations evolve in different ways as they propagate away from the Sun. In all three runs,
 $z_{\text{HF},\text{rms}}^{+}\simeq z_{\text{LF},\text{rms}}^{+}$
in the low corona. As
$z_{\text{HF},\text{rms}}^{+}\simeq z_{\text{LF},\text{rms}}^{+}$
in the low corona. As
 $r$
increases,
$r$
increases,
 $z_{\text{HF},\text{rms}}^{+}/z_{\text{LF},\text{rms}}^{+}$
decreases, particularly in Run 2, suggesting that the high-frequency component of
$z_{\text{HF},\text{rms}}^{+}/z_{\text{LF},\text{rms}}^{+}$
decreases, particularly in Run 2, suggesting that the high-frequency component of
 $\boldsymbol{z}^{+}$
cascades and dissipates more rapidly than the low-frequency component.
$\boldsymbol{z}^{+}$
cascades and dissipates more rapidly than the low-frequency component.
3.8 Alignment
Figure 5 shows the characteristic value of the sine of the angle between
 $\boldsymbol{z}^{+}$
and
$\boldsymbol{z}^{+}$
and
 $\boldsymbol{z}^{-}$
,
$\boldsymbol{z}^{-}$
,
 $$\begin{eqnarray}\sin \unicode[STIX]{x1D703}=\frac{\langle |\boldsymbol{z}^{+}\times \boldsymbol{z}^{-}|\rangle }{\langle |\boldsymbol{z}^{+}|\rangle \langle |\boldsymbol{z}^{-}|\rangle },\end{eqnarray}$$
in both our numerical simulations and the model we present in § 4. As
 $r$
increases,
$r$
increases,
 $\sin \unicode[STIX]{x1D703}$
decreases, particularly in Run 2, causing nonlinear interactions between
$\sin \unicode[STIX]{x1D703}$
decreases, particularly in Run 2, causing nonlinear interactions between
 $\boldsymbol{z}^{+}$
and
$\boldsymbol{z}^{+}$
and
 $\boldsymbol{z}^{-}$
to weaken (see, e.g. Boldyrev Reference Boldyrev2005, Reference Boldyrev2006; Perez & Chandran Reference Perez and Chandran2013; Chandran, Schekochihin & Mallet Reference Chandran, Schekochihin and Mallet2015b
).Footnote
3
$\boldsymbol{z}^{-}$
to weaken (see, e.g. Boldyrev Reference Boldyrev2005, Reference Boldyrev2006; Perez & Chandran Reference Perez and Chandran2013; Chandran, Schekochihin & Mallet Reference Chandran, Schekochihin and Mallet2015b
).Footnote
3
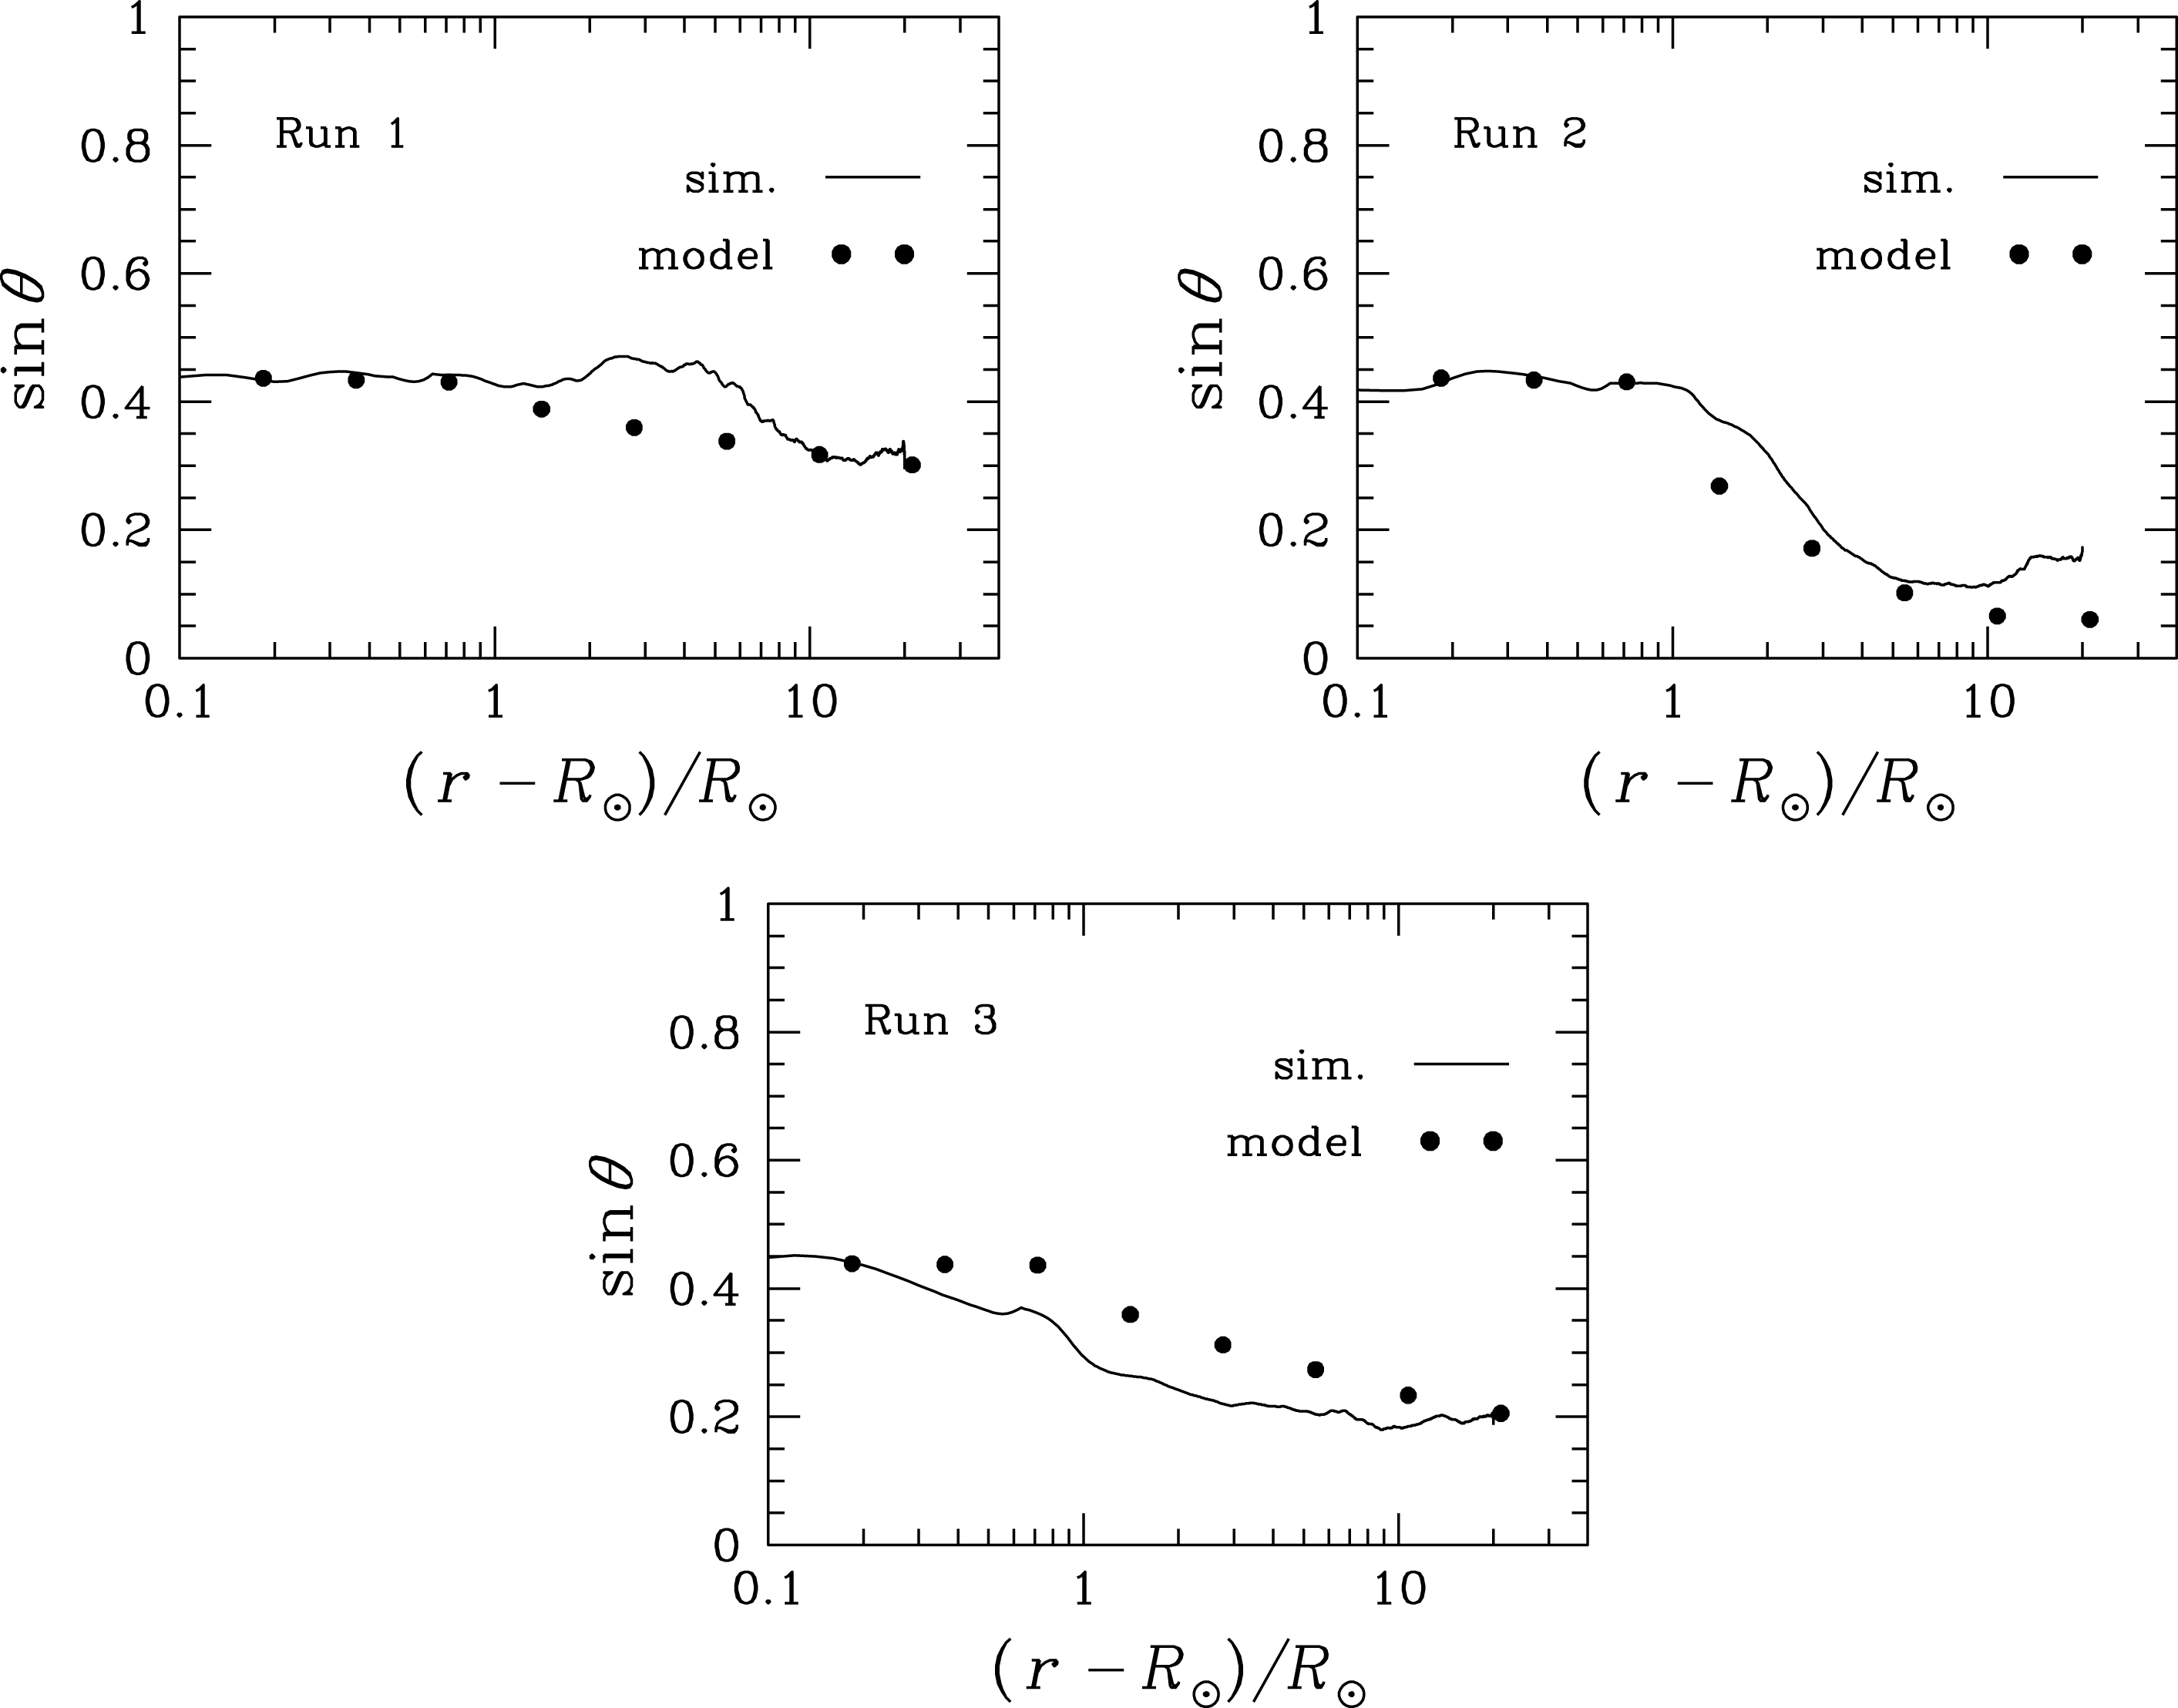


3.9 Turbulent heating
In figure 6 we plot the rate
 $Q$
at which energy is dissipated per unit mass by hyper-dissipation in our simulations (see Perez & Chandran Reference Perez and Chandran2013) as a function of
$Q$
at which energy is dissipated per unit mass by hyper-dissipation in our simulations (see Perez & Chandran Reference Perez and Chandran2013) as a function of
 $r$
, as well as the turbulent heating rate in the analytic model described in § 4. The amplitudes of the turbulent fluctuations in our simulations are consistent with the results of several observational studies that were summarized in figure 9 of Cranmer & van Ballegooijen (Reference Cranmer and van Ballegooijen2005), including non-thermal line widths in coronal holes inferred from SUMER (Solar Ultraviolet Measurements of Emitted Radiation) and UVCS (Ultraviolet Coronagraph Spectrometer) measurements (Banerjee et al.
Reference Banerjee, Teriaca, Doyle and Wilhelm1998; Esser et al.
Reference Esser, Fineschi, Dobrzycka, Habbal, Edgar, Raymond, Kohl and Guhathakurta1999). For comparison, the r.m.s. amplitudes of the fluctuating velocity
$r$
, as well as the turbulent heating rate in the analytic model described in § 4. The amplitudes of the turbulent fluctuations in our simulations are consistent with the results of several observational studies that were summarized in figure 9 of Cranmer & van Ballegooijen (Reference Cranmer and van Ballegooijen2005), including non-thermal line widths in coronal holes inferred from SUMER (Solar Ultraviolet Measurements of Emitted Radiation) and UVCS (Ultraviolet Coronagraph Spectrometer) measurements (Banerjee et al.
Reference Banerjee, Teriaca, Doyle and Wilhelm1998; Esser et al.
Reference Esser, Fineschi, Dobrzycka, Habbal, Edgar, Raymond, Kohl and Guhathakurta1999). For comparison, the r.m.s. amplitudes of the fluctuating velocity
 $\unicode[STIX]{x1D6FF}v_{\text{rms}}$
at
$\unicode[STIX]{x1D6FF}v_{\text{rms}}$
at
 $r=r_{\text{tr}}$
in Runs 1, 2 and 3 are, respectively,
$r=r_{\text{tr}}$
in Runs 1, 2 and 3 are, respectively,
 $30.4~\text{km}~\text{s}^{-1}$
,
$30.4~\text{km}~\text{s}^{-1}$
,
 $30.0~\text{km}~\text{s}^{-1}$
and
$30.0~\text{km}~\text{s}^{-1}$
and
 $26.7~\text{km}~\text{s}^{-1}$
.Footnote
4
The values of
$26.7~\text{km}~\text{s}^{-1}$
.Footnote
4
The values of
 $\unicode[STIX]{x1D6FF}v_{\text{rms}}$
at
$\unicode[STIX]{x1D6FF}v_{\text{rms}}$
at
 $r=2R_{\odot }$
in Runs 1, 2 and 3 are, respectively,
$r=2R_{\odot }$
in Runs 1, 2 and 3 are, respectively,
 $170~\text{km}~\text{s}^{-1}$
,
$170~\text{km}~\text{s}^{-1}$
,
 $157~\text{km}~\text{s}^{-1}$
and
$157~\text{km}~\text{s}^{-1}$
and
 $146~\text{km}~\text{s}^{-1}$
. Because the turbulence amplitudes in our simulations are consistent with the aforementioned observations, the turbulent heating rate in each of our simulations can be used to estimate the rate at which transverse, non-compressive MHD turbulence would heat the solar wind as a function of
$146~\text{km}~\text{s}^{-1}$
. Because the turbulence amplitudes in our simulations are consistent with the aforementioned observations, the turbulent heating rate in each of our simulations can be used to estimate the rate at which transverse, non-compressive MHD turbulence would heat the solar wind as a function of
 $r$
if the correlation lengths and correlation time at
$r$
if the correlation lengths and correlation time at
 $r=r_{\text{b}}$
in the simulation were realistic.Footnote
5
$r=r_{\text{b}}$
in the simulation were realistic.Footnote
5

Figure 6. The turbulent-heating rate per unit mass
 $Q$
in Runs 1 through 3 and in the analytic model of § 4. The dotted line labelled C11 is the turbulent-heating rate in the solar-wind model of Chandran et al. (Reference Chandran, Dennis, Quataert and Bale2011), which approximates the heating needed to power the fast solar wind.
$Q$
in Runs 1 through 3 and in the analytic model of § 4. The dotted line labelled C11 is the turbulent-heating rate in the solar-wind model of Chandran et al. (Reference Chandran, Dennis, Quataert and Bale2011), which approximates the heating needed to power the fast solar wind.
To estimate the amount of turbulent heating that would be needed to power the solar wind, we also plot in figure 6 the turbulent-heating rate in the one-dimensional (flux-tube) solar-wind model of Chandran et al. (Reference Chandran, Dennis, Quataert and Bale2011). This model included Coulomb collisions, super-radial expansion of the magnetic field, separate energy equations for the protons and electrons, proton temperature anisotropy, a transition between Spitzer conductivity near the Sun and a Hollweg collisionless heat flux at larger
 $r$
and enhanced pitch-angle scattering by temperature-anisotropy instabilities in regions in which the plasma is either mirror or firehose unstable. The model agreed with a number of remote observations of coronal holes and in situ measurements of fast-solar-wind streams.
$r$
and enhanced pitch-angle scattering by temperature-anisotropy instabilities in regions in which the plasma is either mirror or firehose unstable. The model agreed with a number of remote observations of coronal holes and in situ measurements of fast-solar-wind streams.
The turbulent-heating rate in the Chandran et al. (Reference Chandran, Dennis, Quataert and Bale2011) model, which we denote
 $Q_{\text{C11}}$
, is for the most part comparable to (i.e. within a factor of 3 of) the heating rate in our numerical simulations. The simulated heating rates in Runs 1 and 3 are in fact strikingly close to
$Q_{\text{C11}}$
, is for the most part comparable to (i.e. within a factor of 3 of) the heating rate in our numerical simulations. The simulated heating rates in Runs 1 and 3 are in fact strikingly close to
 $Q_{\text{C11}}$
at
$Q_{\text{C11}}$
at
 $r\gtrsim 4R_{\odot }$
. However, in all three runs,
$r\gtrsim 4R_{\odot }$
. However, in all three runs,
 $Q>Q_{\text{C11}}$
at
$Q>Q_{\text{C11}}$
at
 $r=2-3R_{\odot }$
. This latter discrepancy is largest in the case of Run 2, in which
$r=2-3R_{\odot }$
. This latter discrepancy is largest in the case of Run 2, in which
 $Q\simeq 3Q_{\text{C11}}$
at
$Q\simeq 3Q_{\text{C11}}$
at
 $r=2R_{\odot }$
. Although Run 2 has the largest heating rate of all three simulations at
$r=2R_{\odot }$
. Although Run 2 has the largest heating rate of all three simulations at
 $r=2R_{\odot }$
, the simulated heating rate in Run 2 is smaller than
$r=2R_{\odot }$
, the simulated heating rate in Run 2 is smaller than
 $Q_{\text{C11}}$
at
$Q_{\text{C11}}$
at
 $r\gtrsim 5R_{\odot }$
by a factor of
$r\gtrsim 5R_{\odot }$
by a factor of
 ${\sim}2$
.
${\sim}2$
.
The only region in which the simulated heating rate differs from
 $Q_{\text{C11}}$
by a factor
$Q_{\text{C11}}$
by a factor
 ${\gtrsim}4$
is at
${\gtrsim}4$
is at
 $r<1.3R_{\odot }$
in Run 3, where
$r<1.3R_{\odot }$
in Run 3, where
 $Q/Q_{\text{C11}}$
falls below 0.1. Even in Runs 1 and 2, the simulated heating rate at
$Q/Q_{\text{C11}}$
falls below 0.1. Even in Runs 1 and 2, the simulated heating rate at
 $r<1.3R_{\odot }$
is smaller than
$r<1.3R_{\odot }$
is smaller than
 $Q_{\text{C11}}$
by a factor of
$Q_{\text{C11}}$
by a factor of
 ${\sim}2$
. The finding that
${\sim}2$
. The finding that
 $Q\lesssim 0.5Q_{\text{C11}}$
at
$Q\lesssim 0.5Q_{\text{C11}}$
at
 $r<1.3R_{\odot }$
in all three runs may indicate the presence of additional heating mechanisms in the actual low corona, such as compressive fluctuations, a possibility previously considered by Cranmer et al. (Reference Cranmer, van Ballegooijen and Edgar2007) and Verdini et al. (Reference Verdini, Velli, Matthaeus, Oughton and Dmitruk2010).
$r<1.3R_{\odot }$
in all three runs may indicate the presence of additional heating mechanisms in the actual low corona, such as compressive fluctuations, a possibility previously considered by Cranmer et al. (Reference Cranmer, van Ballegooijen and Edgar2007) and Verdini et al. (Reference Verdini, Velli, Matthaeus, Oughton and Dmitruk2010).
Recently, van Ballegooijen & Asgari-Targhi (Reference van Ballegooijen and Asgari-Targhi2016), van Ballegooijen & Asgari-Targhi (Reference van Ballegooijen and Asgari-Targhi2017) carried out a series of direct numerical simulations of reflection-driven MHD turbulence and concluded that such turbulence is unable to provide enough heating to power the solar wind. The reason we reach a different conclusion is likely that we use the two-fluid solar-wind model of Chandran et al. (Reference Chandran, Dennis, Quataert and Bale2011) to estimate the amount of heating required, whereas van Ballegooijen & Asgari-Targhi (Reference van Ballegooijen and Asgari-Targhi2016), van Ballegooijen & Asgari-Targhi (Reference van Ballegooijen and Asgari-Targhi2017) used a one-fluid solar-wind model (A. van Ballegooijen, private communication). In the Chandran et al. (Reference Chandran, Dennis, Quataert and Bale2011) two-fluid model, the electron temperature is lower than the proton temperature, and thus less heat is conducted back to the chromosphere than in a one-fluid solar-wind model.
3.10 Simulation results: Elsasser power spectra
We define the perpendicular Elsasser power spectra
 $$\begin{eqnarray}E^{\pm }(k_{\bot },r)=k_{\bot }\int _{0}^{2\unicode[STIX]{x03C0}}\text{d}\unicode[STIX]{x1D719}\overline{|\tilde{\boldsymbol{z}}^{\pm }(k_{\bot },\unicode[STIX]{x1D719},r,t)|^{2}},\end{eqnarray}$$
where
 $\tilde{\boldsymbol{z}}^{\pm }(k_{\bot },\unicode[STIX]{x1D719})$
is the Fourier transform of
$\tilde{\boldsymbol{z}}^{\pm }(k_{\bot },\unicode[STIX]{x1D719})$
is the Fourier transform of
 $\boldsymbol{z}^{\pm }$
in
$\boldsymbol{z}^{\pm }$
in
 $x$
and
$x$
and
 $y$
(see figure 1),
$y$
(see figure 1),
 $\unicode[STIX]{x1D719}$
is the polar angle in the
$\unicode[STIX]{x1D719}$
is the polar angle in the
 $(k_{x},k_{y})$
plane and
$(k_{x},k_{y})$
plane and
 $\overline{(\ldots \,)}$
indicates a time average. As illustrated in figure 7(a), we find that
$\overline{(\ldots \,)}$
indicates a time average. As illustrated in figure 7(a), we find that
 $E^{\pm }(k_{\bot })$
exhibits an approximate power-law scaling of the form
$E^{\pm }(k_{\bot })$
exhibits an approximate power-law scaling of the form
 $$\begin{eqnarray}E^{\pm }(k_{\bot },r)\propto k_{\bot }^{-\unicode[STIX]{x1D6FC}^{\pm }(r)}\end{eqnarray}$$
from
 $k_{\bot }\simeq 3\times 2\unicode[STIX]{x03C0}/L_{\text{box}}$
to
$k_{\bot }\simeq 3\times 2\unicode[STIX]{x03C0}/L_{\text{box}}$
to
 $k_{\bot }\simeq 15\times 2\unicode[STIX]{x03C0}/L_{\text{box}}$
at all
$k_{\bot }\simeq 15\times 2\unicode[STIX]{x03C0}/L_{\text{box}}$
at all
 $r$
in all three of our simulations. We evaluate
$r$
in all three of our simulations. We evaluate
 $\unicode[STIX]{x1D6FC}^{\pm }(r)$
by fitting
$\unicode[STIX]{x1D6FC}^{\pm }(r)$
by fitting
 $E^{\pm }(k_{\bot },r)$
to a power law within this range of wave numbers, and plot the resulting values of
$E^{\pm }(k_{\bot },r)$
to a power law within this range of wave numbers, and plot the resulting values of
 $\unicode[STIX]{x1D6FC}^{\pm }(r)$
in figure 7.
$\unicode[STIX]{x1D6FC}^{\pm }(r)$
in figure 7.

Figure 7. (a) The Elsasser power spectra
 $E^{\pm }(k_{\bot },r)$
defined in (3.34) as functions of perpendicular wavenumber
$E^{\pm }(k_{\bot },r)$
defined in (3.34) as functions of perpendicular wavenumber
 $k_{\bot }$
at
$k_{\bot }$
at
 $r=20R_{\odot }$
in Run 1. (b,c,d) The spectral indices
$r=20R_{\odot }$
in Run 1. (b,c,d) The spectral indices
 $\unicode[STIX]{x1D6FC}^{+}(r)$
and
$\unicode[STIX]{x1D6FC}^{+}(r)$
and
 $\unicode[STIX]{x1D6FC}^{-}(r)$
defined in (3.35) in our three numerical simulations.
$\unicode[STIX]{x1D6FC}^{-}(r)$
defined in (3.35) in our three numerical simulations.
Although we drive only large-scale (
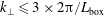 $k_{\bot }\leqslant 3\times 2\unicode[STIX]{x03C0}/L_{\text{box}}$
) velocity fluctuations at the photosphere, figure 7 shows that there is broad-spectrum turbulence throughout the chromosphere. This is because of the strong reflection of
$k_{\bot }\leqslant 3\times 2\unicode[STIX]{x03C0}/L_{\text{box}}$
) velocity fluctuations at the photosphere, figure 7 shows that there is broad-spectrum turbulence throughout the chromosphere. This is because of the strong reflection of
 $\boldsymbol{z}^{+}$
fluctuations at the transition region and the strong reflection of
$\boldsymbol{z}^{+}$
fluctuations at the transition region and the strong reflection of
 $\boldsymbol{z}^{-}$
fluctuations (at all
$\boldsymbol{z}^{-}$
fluctuations (at all
 $k_{\bot }$
) at the photosphere (enforced by the fixed-velocity boundary condition at
$k_{\bot }$
) at the photosphere (enforced by the fixed-velocity boundary condition at
 $r=R_{\odot }$
), which together lead to comparatively ‘balanced’ turbulence (meaning that
$r=R_{\odot }$
), which together lead to comparatively ‘balanced’ turbulence (meaning that
 $z_{\text{rms}}^{+}\simeq z_{\text{rms}}^{-}$
) in the chromosphere, as shown previously by van Ballegooijen et al. (Reference van Ballegooijen, Asgari-Targhi, Cranmer and DeLuca2011). In the low chromosphere,
$z_{\text{rms}}^{+}\simeq z_{\text{rms}}^{-}$
) in the chromosphere, as shown previously by van Ballegooijen et al. (Reference van Ballegooijen, Asgari-Targhi, Cranmer and DeLuca2011). In the low chromosphere,
 $\unicode[STIX]{x1D6FC}^{\pm }\simeq 1.3{-}1.5$
in all four simulations, which is similar to the value
$\unicode[STIX]{x1D6FC}^{\pm }\simeq 1.3{-}1.5$
in all four simulations, which is similar to the value
 $\unicode[STIX]{x1D6FC}^{\pm }\simeq 3/2$
that arises in numerical simulations of homogeneous, balanced, RMHD turbulence (Mason, Cattaneo & Boldyrev Reference Mason, Cattaneo and Boldyrev2008; Beresnyak Reference Beresnyak2012; Perez et al.
Reference Perez, Mason, Boldyrev and Cattaneo2012). On the other hand,
$\unicode[STIX]{x1D6FC}^{\pm }\simeq 3/2$
that arises in numerical simulations of homogeneous, balanced, RMHD turbulence (Mason, Cattaneo & Boldyrev Reference Mason, Cattaneo and Boldyrev2008; Beresnyak Reference Beresnyak2012; Perez et al.
Reference Perez, Mason, Boldyrev and Cattaneo2012). On the other hand,
 $\unicode[STIX]{x1D6FC}^{+}$
decreases from
$\unicode[STIX]{x1D6FC}^{+}$
decreases from
 $\simeq 1.5$
to
$\simeq 1.5$
to
 $\simeq 0.8$
as
$\simeq 0.8$
as
 $r$
increases from
$r$
increases from
 $1.001R_{\odot }$
to
$1.001R_{\odot }$
to
 $r_{\text{tr}}=1.0026R_{\odot }$
in Runs 1 and 2. This spectral flattening arises because the Alfvén-speed gradient in the upper chromosphere acts as a high-pass filter on outward-propagating AWs in Runs 1 and 2, causing lower-
$r_{\text{tr}}=1.0026R_{\odot }$
in Runs 1 and 2. This spectral flattening arises because the Alfvén-speed gradient in the upper chromosphere acts as a high-pass filter on outward-propagating AWs in Runs 1 and 2, causing lower-
 $k_{\bot }$
(and hence lower-frequency – see Goldreich & Sridhar (Reference Goldreich and Sridhar1995))
$k_{\bot }$
(and hence lower-frequency – see Goldreich & Sridhar (Reference Goldreich and Sridhar1995))
 $\boldsymbol{z}^{+}$
fluctuations to undergo non-WKB reflection, and allowing higher-
$\boldsymbol{z}^{+}$
fluctuations to undergo non-WKB reflection, and allowing higher-
 $k_{\bot }$
(and hence higher-frequency)
$k_{\bot }$
(and hence higher-frequency)
 $\boldsymbol{z}^{+}$
fluctuations to propagate unhindered to the transition region (Velli Reference Velli1993; Réville, Tenerani & Velli Reference Réville, Tenerani and Velli2018). The difference in Run 3 is that
$\boldsymbol{z}^{+}$
fluctuations to propagate unhindered to the transition region (Velli Reference Velli1993; Réville, Tenerani & Velli Reference Réville, Tenerani and Velli2018). The difference in Run 3 is that
 $L_{\text{box}}$
is larger, and thus
$L_{\text{box}}$
is larger, and thus
 $\boldsymbol{z}^{+}$
fluctuations do not reach sufficiently large
$\boldsymbol{z}^{+}$
fluctuations do not reach sufficiently large
 $k_{\bot }$
values that they can avoid non-WKB reflection in the upper chromosphere.Footnote
6
The idea that
$k_{\bot }$
values that they can avoid non-WKB reflection in the upper chromosphere.Footnote
6
The idea that
 $\boldsymbol{z}^{+}$
fluctuations at the high-
$\boldsymbol{z}^{+}$
fluctuations at the high-
 $k_{\bot }$
end of the inertial range propagate through the chromosphere more easily in Runs 1 and 2 than in Run 3 is consistent with the fact that
$k_{\bot }$
end of the inertial range propagate through the chromosphere more easily in Runs 1 and 2 than in Run 3 is consistent with the fact that
 $z_{\text{rms}}^{+}(r_{\text{b}})$
and
$z_{\text{rms}}^{+}(r_{\text{b}})$
and
 $\unicode[STIX]{x1D6FF}B_{\text{rms}}$
are somewhat larger in Runs 1 and 2 than in Run 3 (see table 1 and figure 3).
$\unicode[STIX]{x1D6FF}B_{\text{rms}}$
are somewhat larger in Runs 1 and 2 than in Run 3 (see table 1 and figure 3).
As
 $r$
increases from
$r$
increases from
 $r_{\text{tr}}$
to
$r_{\text{tr}}$
to
 $r_{\text{A}}$
and beyond,
$r_{\text{A}}$
and beyond,
 $\unicode[STIX]{x1D6FC}^{\pm }$
approaches
$\unicode[STIX]{x1D6FC}^{\pm }$
approaches
 $\simeq 3/2$
in all three runs. In Runs 1 and 2, the increase in
$\simeq 3/2$
in all three runs. In Runs 1 and 2, the increase in
 $\unicode[STIX]{x1D6FC}^{+}$
as
$\unicode[STIX]{x1D6FC}^{+}$
as
 $r$
increases from
$r$
increases from
 $r_{\text{tr}}$
to
$r_{\text{tr}}$
to
 $r_{\text{A}}$
is not steady. In Run 1,
$r_{\text{A}}$
is not steady. In Run 1,
 $\unicode[STIX]{x1D6FC}^{+}$
decreases as
$\unicode[STIX]{x1D6FC}^{+}$
decreases as
 $r$
increases from
$r$
increases from
 $2.8R_{\odot }$
to
$2.8R_{\odot }$
to
 $4.2R_{\odot }$
, and in Run 2,
$4.2R_{\odot }$
, and in Run 2,
 $\unicode[STIX]{x1D6FC}^{+}$
plateaus around a value of 1 between
$\unicode[STIX]{x1D6FC}^{+}$
plateaus around a value of 1 between
 $r=2R_{\odot }$
and
$r=2R_{\odot }$
and
 $r=3R_{\odot }$
. This behaviour suggests that, in these two simulations, the turbulent dynamics at
$r=3R_{\odot }$
. This behaviour suggests that, in these two simulations, the turbulent dynamics at
 $2R_{\odot }\lesssim r\lesssim 4R_{\odot }$
drives
$2R_{\odot }\lesssim r\lesssim 4R_{\odot }$
drives
 $\unicode[STIX]{x1D6FC}^{+}$
towards a value close to 1, and the tendency for
$\unicode[STIX]{x1D6FC}^{+}$
towards a value close to 1, and the tendency for
 $\unicode[STIX]{x1D6FC}^{+}$
to evolve towards 3/2 sets in at
$\unicode[STIX]{x1D6FC}^{+}$
to evolve towards 3/2 sets in at
 $r\gtrsim 4R_{\odot }$
. We discuss these trends further in § 6.
$r\gtrsim 4R_{\odot }$
. We discuss these trends further in § 6.
4 Two-component analytic model of reflection-driven MHD turbulence
Chandran & Hollweg (Reference Chandran and Hollweg2009) (hereafter CH09) developed an analytic model of reflection-driven MHD turbulence in the solar corona and solar wind. This model can reproduce the radial profile of
 $z_{\text{rms}}^{+}$
in our numerical simulations fairly accurately, provided the constant
$z_{\text{rms}}^{+}$
in our numerical simulations fairly accurately, provided the constant
 $\unicode[STIX]{x1D712}$
introduced in equation (34) of CH09 is treated as an adjustable free parameter that is allowed to take on different values in different simulations. With the best-fit values of
$\unicode[STIX]{x1D712}$
introduced in equation (34) of CH09 is treated as an adjustable free parameter that is allowed to take on different values in different simulations. With the best-fit values of
 $\unicode[STIX]{x1D712}$
, the CH09 model also reproduces the turbulent-heating profiles in Runs 1 and 2 reasonably well. However, the model is significantly less accurate at reproducing
$\unicode[STIX]{x1D712}$
, the CH09 model also reproduces the turbulent-heating profiles in Runs 1 and 2 reasonably well. However, the model is significantly less accurate at reproducing
 $Q(r)$
in Run 3 and deviates markedly from the
$Q(r)$
in Run 3 and deviates markedly from the
 $z_{\text{rms}}^{-}$
profiles in all three runs. Moreover, the CH09 model does not explain the differences between the best-fit values of
$z_{\text{rms}}^{-}$
profiles in all three runs. Moreover, the CH09 model does not explain the differences between the best-fit values of
 $\unicode[STIX]{x1D712}$
for Runs 1, 2 and 3 (which are, respectively, 0.55, 0.72 and 0.36), or explain how these values can be determined from the perpendicular correlation length and correlation time of the AWs launched by the Sun. These shortcomings indicate that there are important physical processes operating in our numerical simulations that were not accounted for by CH09.
$\unicode[STIX]{x1D712}$
for Runs 1, 2 and 3 (which are, respectively, 0.55, 0.72 and 0.36), or explain how these values can be determined from the perpendicular correlation length and correlation time of the AWs launched by the Sun. These shortcomings indicate that there are important physical processes operating in our numerical simulations that were not accounted for by CH09.
In order to elucidate these processes, we develop a new analytic model of reflection-driven MHD turbulence at
 $$\begin{eqnarray}r\geqslant r_{\text{b}},\end{eqnarray}$$
where
 $r_{\text{b}}$
is the radius of the coronal base defined in (3.10). The reader who is not interested in the technical details may wish to skip to § 4.6, which summarizes the free parameters and boundary conditions of the model and compares the model with our simulation results.
$r_{\text{b}}$
is the radius of the coronal base defined in (3.10). The reader who is not interested in the technical details may wish to skip to § 4.6, which summarizes the free parameters and boundary conditions of the model and compares the model with our simulation results.
We begin by dividing the
 $\boldsymbol{z}^{+}$
fluctuations into two components as described in § 3.7:
$\boldsymbol{z}^{+}$
fluctuations into two components as described in § 3.7:
 $$\begin{eqnarray}\boldsymbol{z}^{+}=\boldsymbol{z}_{\text{HF}}^{+}+\boldsymbol{z}_{\text{LF}}^{+},\quad \boldsymbol{g}=\boldsymbol{g}_{\text{HF}}+\boldsymbol{g}_{\text{LF}}.\end{eqnarray}$$
The quantities,
 $\boldsymbol{z}_{\text{HF}}^{+}$
and
$\boldsymbol{z}_{\text{HF}}^{+}$
and
 $\boldsymbol{z}_{\text{LF}}^{+}$
have different radial correlation lengths (see (3.26)), but we take them to have the same perpendicular outer scale
$\boldsymbol{z}_{\text{LF}}^{+}$
have different radial correlation lengths (see (3.26)), but we take them to have the same perpendicular outer scale
 $L_{\bot }$
.Footnote
7
We make the simplifying approximation that the HF and LF fluctuations are uncorrelated; i.e.
$L_{\bot }$
.Footnote
7
We make the simplifying approximation that the HF and LF fluctuations are uncorrelated; i.e.
 $\overline{\boldsymbol{g}_{\text{HF}}\boldsymbol{\cdot }\boldsymbol{g}_{\text{LF}}}=0$
, where
$\overline{\boldsymbol{g}_{\text{HF}}\boldsymbol{\cdot }\boldsymbol{g}_{\text{LF}}}=0$
, where
 $\overline{(\ldots )}$
indicates a time average. Non-WKB reflection is more efficient for low-frequency AWs than for high-frequency AWs (Heinemann & Olbert Reference Heinemann and Olbert1980; Velli Reference Velli1993). We thus take
$\overline{(\ldots )}$
indicates a time average. Non-WKB reflection is more efficient for low-frequency AWs than for high-frequency AWs (Heinemann & Olbert Reference Heinemann and Olbert1980; Velli Reference Velli1993). We thus take
 $\boldsymbol{f}$
to be a ‘low-frequency quantity’ that is correlated with
$\boldsymbol{f}$
to be a ‘low-frequency quantity’ that is correlated with
 $\boldsymbol{g}_{\text{LF}}$
but not
$\boldsymbol{g}_{\text{LF}}$
but not
 $\boldsymbol{g}_{\text{HF}}$
. Upon taking the dot product of (2.19) with
$\boldsymbol{g}_{\text{HF}}$
. Upon taking the dot product of (2.19) with
 $2\boldsymbol{g}_{\text{HF}}$
, averaging and assuming a statistical steady state, we obtain
$2\boldsymbol{g}_{\text{HF}}$
, averaging and assuming a statistical steady state, we obtain
 $$\begin{eqnarray}(U+v_{\text{A}})\frac{\text{d}}{\text{d}r}g_{\text{HF},\text{rms}}^{2}=2\overline{\boldsymbol{R}\boldsymbol{\cdot }\boldsymbol{g}_{\text{HF}}},\end{eqnarray}$$
where
 $g_{\text{HF},\text{rms}}=\overline{|\boldsymbol{g}_{\text{HF}}|^{2}}^{1/2}$
(with analogous definitions for
$g_{\text{HF},\text{rms}}=\overline{|\boldsymbol{g}_{\text{HF}}|^{2}}^{1/2}$
(with analogous definitions for
 $g_{\text{LF},\text{rms}}$
,
$g_{\text{LF},\text{rms}}$
,
 $z_{\text{HF},\text{rms}}^{+}$
,
$z_{\text{HF},\text{rms}}^{+}$
,
 $z_{\text{LF},\text{rms}}^{+}$
,
$z_{\text{LF},\text{rms}}^{+}$
,
 $f_{\text{rms}}$
and
$f_{\text{rms}}$
and
 $z_{\text{rms}}^{-}$
), and
$z_{\text{rms}}^{-}$
), and
 $\boldsymbol{R}$
represents the right-hand side of (2.19). The nonlinear term on the right-hand side of (2.19) acts to cascade
$\boldsymbol{R}$
represents the right-hand side of (2.19). The nonlinear term on the right-hand side of (2.19) acts to cascade
 $\boldsymbol{g}_{\text{HF}}$
fluctuations to small scales at which the fluctuations dissipate. We set
$\boldsymbol{g}_{\text{HF}}$
fluctuations to small scales at which the fluctuations dissipate. We set
 $\overline{\boldsymbol{R}\boldsymbol{\cdot }\boldsymbol{g}_{\text{HF}}}=-\unicode[STIX]{x1D6FE}_{\text{HF}}^{+}g_{\text{HF},\text{rms}}^{2}$
, where
$\overline{\boldsymbol{R}\boldsymbol{\cdot }\boldsymbol{g}_{\text{HF}}}=-\unicode[STIX]{x1D6FE}_{\text{HF}}^{+}g_{\text{HF},\text{rms}}^{2}$
, where
 $\unicode[STIX]{x1D6FE}_{\text{HF}}^{+}$
is the cascade rate of the outer-scale
$\unicode[STIX]{x1D6FE}_{\text{HF}}^{+}$
is the cascade rate of the outer-scale
 $\boldsymbol{g}_{\text{HF}}$
fluctuations. Equation (4.3) then becomes
$\boldsymbol{g}_{\text{HF}}$
fluctuations. Equation (4.3) then becomes
 $$\begin{eqnarray}(U+v_{\text{A}})\frac{\text{d}}{\text{d}r}g_{\text{HF},\text{rms}}^{2}=-2\unicode[STIX]{x1D6FE}_{\text{HF}}^{+}g_{\text{HF},\text{rms}}^{2}.\end{eqnarray}$$
We follow Velli et al. (Reference Velli, Grappin and Mangeney1989) and Verdini et al. (Reference Verdini, Velli and Buchlin2009) in taking the outer-scale
 $\boldsymbol{z}^{-}$
fluctuations to be anomalously coherent in a reference frame that propagates outward with the
$\boldsymbol{z}^{-}$
fluctuations to be anomalously coherent in a reference frame that propagates outward with the
 $\boldsymbol{z}^{+}$
fluctuations, because the
$\boldsymbol{z}^{+}$
fluctuations, because the
 $\boldsymbol{z}^{-}$
fluctuations are produced by sources that propagate outward at speed
$\boldsymbol{z}^{-}$
fluctuations are produced by sources that propagate outward at speed
 $U+v_{\text{A}}$
. We thus estimate
$U+v_{\text{A}}$
. We thus estimate
 $\unicode[STIX]{x1D6FE}_{\text{HF}}^{+}$
using a strong-turbulence scaling regardless of the value of
$\unicode[STIX]{x1D6FE}_{\text{HF}}^{+}$
using a strong-turbulence scaling regardless of the value of
 $z_{\text{HF},\text{rms}}^{-}$
, setting
$z_{\text{HF},\text{rms}}^{-}$
, setting
 $$\begin{eqnarray}\unicode[STIX]{x1D6FE}_{\text{HF}}^{+}=\frac{c_{\text{diss}}z_{\text{rms}}^{-}}{L_{\bot }},\end{eqnarray}$$
where
 $c_{\text{diss}}$
is a dimensionless free parameter.
$c_{\text{diss}}$
is a dimensionless free parameter.
Using a similar procedure, but this time for
 $g_{\text{LF}}$
, we find that
$g_{\text{LF}}$
, we find that
 $$\begin{eqnarray}(U+v_{\text{A}})\frac{\text{d}}{\text{d}r}g_{\text{LF},\text{rms}}^{2}=-2\unicode[STIX]{x1D6FE}_{\text{LF}}^{+}g_{\text{LF},\text{rms}}^{2},\end{eqnarray}$$
where
 $\unicode[STIX]{x1D6FE}_{\text{LF}}^{+}$
is the rate at which outer-scale
$\unicode[STIX]{x1D6FE}_{\text{LF}}^{+}$
is the rate at which outer-scale
 $\boldsymbol{g}_{\text{LF}}$
fluctuations cascade to small scales and dissipate. In writing (4.6), we have dropped a term containing
$\boldsymbol{g}_{\text{LF}}$
fluctuations cascade to small scales and dissipate. In writing (4.6), we have dropped a term containing
 $\overline{\boldsymbol{f}\boldsymbol{\cdot }\boldsymbol{g}_{\text{LF}}}$
on the assumption that
$\overline{\boldsymbol{f}\boldsymbol{\cdot }\boldsymbol{g}_{\text{LF}}}$
on the assumption that
 $f\ll g_{\text{LF}}$
. We set
$f\ll g_{\text{LF}}$
. We set
 $$\begin{eqnarray}\unicode[STIX]{x1D6FE}_{\text{LF}}^{+}=\frac{c_{\text{diss}}z_{\text{rms}}^{-}A}{L_{\bot }},\end{eqnarray}$$
where the dimensionless coefficient
 $A$
models the weakening of nonlinear interactions between
$A$
models the weakening of nonlinear interactions between
 $\boldsymbol{g}_{\text{LF}}$
and
$\boldsymbol{g}_{\text{LF}}$
and
 $\boldsymbol{f}$
as these two fluctuation types become increasingly aligned with each other. We discuss how we determine
$\boldsymbol{f}$
as these two fluctuation types become increasingly aligned with each other. We discuss how we determine
 $A$
in § 4.3 below. In order to compare our model with our simulation results, we take
$A$
in § 4.3 below. In order to compare our model with our simulation results, we take
 $A$
to be related to
$A$
to be related to
 $\sin \unicode[STIX]{x1D703}$
in (3.33) via the equation
$\sin \unicode[STIX]{x1D703}$
in (3.33) via the equation
 $$\begin{eqnarray}\sin \unicode[STIX]{x1D703}=\frac{0.55(Ag_{\text{LF},\text{rms}}^{2}+g_{\text{HF},\text{rms}}^{2})}{g_{\text{LF},\text{rms}}^{2}+g_{\text{HF},\text{rms}}^{2}},\end{eqnarray}$$
which expresses the idea that only low-frequency
 $\boldsymbol{g}$
fluctuations align with
$\boldsymbol{g}$
fluctuations align with
 $\boldsymbol{f}$
fluctuations, while both low-frequency and high-frequency
$\boldsymbol{f}$
fluctuations, while both low-frequency and high-frequency
 $\boldsymbol{g}$
fluctuations contribute to the average that is used to compute
$\boldsymbol{g}$
fluctuations contribute to the average that is used to compute
 $\sin \unicode[STIX]{x1D703}$
in (3.33). The factor of 0.55 in (4.8) is included because this is the typical value of the right-hand side of (3.33) for outer-scale fluctuations in homogeneous RMHD turbulence (Chandran et al.
Reference Chandran, Schekochihin and Mallet2015b
).
$\sin \unicode[STIX]{x1D703}$
in (3.33). The factor of 0.55 in (4.8) is included because this is the typical value of the right-hand side of (3.33) for outer-scale fluctuations in homogeneous RMHD turbulence (Chandran et al.
Reference Chandran, Schekochihin and Mallet2015b
).
4.1 Amplitude of the inward-propagating fluctuations
To determine
 $z_{\text{rms}}^{-}$
, we assume that
$z_{\text{rms}}^{-}$
, we assume that
 $\boldsymbol{z}^{-}$
cascades primarily via interactions with
$\boldsymbol{z}^{-}$
cascades primarily via interactions with
 $\boldsymbol{z}_{\text{LF}}^{+}$
(or, equivalently,
$\boldsymbol{z}_{\text{LF}}^{+}$
(or, equivalently,
 $\boldsymbol{g}_{\text{LF}}$
). The outer-scale
$\boldsymbol{g}_{\text{LF}}$
). The outer-scale
 $\boldsymbol{z}^{-}$
cascade rate then depends upon the critical-balance parameter (Goldreich & Sridhar Reference Goldreich and Sridhar1995; Boldyrev Reference Boldyrev2006)
$\boldsymbol{z}^{-}$
cascade rate then depends upon the critical-balance parameter (Goldreich & Sridhar Reference Goldreich and Sridhar1995; Boldyrev Reference Boldyrev2006)
 $$\begin{eqnarray}\unicode[STIX]{x1D712}_{\text{LF}}^{-}=\frac{z_{\text{LF},\text{rms}}^{+}L_{r,\text{LF}}^{+}A}{L_{\bot }v_{\text{A}}},\end{eqnarray}$$
where
 $L_{r,\text{LF}}^{+}$
is the radial correlation length of the
$L_{r,\text{LF}}^{+}$
is the radial correlation length of the
 $\boldsymbol{g}_{\text{LF}}$
fluctuations. The critical-balance parameter
$\boldsymbol{g}_{\text{LF}}$
fluctuations. The critical-balance parameter
 $\unicode[STIX]{x1D712}_{\text{LF}}^{-}$
is an estimate of the fractional change in an outer-scale
$\unicode[STIX]{x1D712}_{\text{LF}}^{-}$
is an estimate of the fractional change in an outer-scale
 $\boldsymbol{z}^{-}$
fluctuation that results from a single ‘collision’ with an outer-scale
$\boldsymbol{z}^{-}$
fluctuation that results from a single ‘collision’ with an outer-scale
 $\boldsymbol{g}_{\text{LF}}$
fluctuation lasting a time
$\boldsymbol{g}_{\text{LF}}$
fluctuation lasting a time
 $\unicode[STIX]{x0394}t\sim L_{r,\text{LF}}^{+}/v_{\text{A}}$
(Lithwick, Goldreich & Sridhar Reference Lithwick, Goldreich and Sridhar2007).
$\unicode[STIX]{x0394}t\sim L_{r,\text{LF}}^{+}/v_{\text{A}}$
(Lithwick, Goldreich & Sridhar Reference Lithwick, Goldreich and Sridhar2007).
If
 $\unicode[STIX]{x1D712}_{\text{LF}}^{-}\ll 1$
, then each such collision causes only a small perturbation to the outer-scale
$\unicode[STIX]{x1D712}_{\text{LF}}^{-}\ll 1$
, then each such collision causes only a small perturbation to the outer-scale
 $\boldsymbol{z}^{-}$
fluctuation, and the turbulence is weak. In this limit, the effects of successive collisions add like a random walk, and roughly
$\boldsymbol{z}^{-}$
fluctuation, and the turbulence is weak. In this limit, the effects of successive collisions add like a random walk, and roughly
 $$\begin{eqnarray}N=(\unicode[STIX]{x1D712}_{\text{LF}}^{-})^{-2}\end{eqnarray}$$
collisions are needed for nonlinear interactions to cause an order-unity change in the outer-scale
 $\boldsymbol{z}^{-}$
fluctuation. The outer-scale
$\boldsymbol{z}^{-}$
fluctuation. The outer-scale
 $\boldsymbol{z}^{-}$
cascade time scale
$\boldsymbol{z}^{-}$
cascade time scale
 $t_{\text{NL}}^{-}$
is then
$t_{\text{NL}}^{-}$
is then
 ${\sim}NL_{r,\text{LF}}^{+}/v_{\text{A}}$
. The generation of outer-scale
${\sim}NL_{r,\text{LF}}^{+}/v_{\text{A}}$
. The generation of outer-scale
 $\boldsymbol{z}^{-}$
(or
$\boldsymbol{z}^{-}$
(or
 $\boldsymbol{f}$
) fluctuations by non-WKB reflection in this weak-turbulence regime can also be viewed as a random-walk-like process. Equation (2.20) implies that, in a reference frame
$\boldsymbol{f}$
) fluctuations by non-WKB reflection in this weak-turbulence regime can also be viewed as a random-walk-like process. Equation (2.20) implies that, in a reference frame
 $S^{-}$
that propagates with radial velocity
$S^{-}$
that propagates with radial velocity
 $U-v_{\text{A}}$
, the increment to
$U-v_{\text{A}}$
, the increment to
 $\boldsymbol{f}$
from non-WKB reflection during a time
$\boldsymbol{f}$
from non-WKB reflection during a time
 $\unicode[STIX]{x0394}t=L_{r,\text{LF}}^{+}/v_{\text{A}}$
is of order
$\unicode[STIX]{x0394}t=L_{r,\text{LF}}^{+}/v_{\text{A}}$
is of order
 $$\begin{eqnarray}\unicode[STIX]{x0394}f\sim \left(\frac{U-v_{\text{A}}}{2v_{\text{A}}}\right)\left|\frac{\text{d}v_{\text{A}}}{\text{d}r}\right|g_{\text{LF},\text{rms}}\unicode[STIX]{x0394}t.\end{eqnarray}$$
It follows from (2.15) that the corresponding increment to
 $\boldsymbol{z}^{-}$
is of order
$\boldsymbol{z}^{-}$
is of order
 $$\begin{eqnarray}\unicode[STIX]{x0394}z^{-}\sim \left(\frac{U+v_{\text{A}}}{2v_{\text{A}}}\right)\left|\frac{\text{d}v_{\text{A}}}{\text{d}r}\right|z_{\text{LF},\text{rms}}^{+}\unicode[STIX]{x0394}t.\end{eqnarray}$$
The r.m.s. value of
 $\boldsymbol{z}^{-}$
is approximately the ‘amount’ of
$\boldsymbol{z}^{-}$
is approximately the ‘amount’ of
 $\boldsymbol{z}^{-}$
that ‘builds up’ in frame
$\boldsymbol{z}^{-}$
that ‘builds up’ in frame
 $S^{-}$
by non-WKB reflection during the cascade/damping time scale
$S^{-}$
by non-WKB reflection during the cascade/damping time scale
 ${\sim}N\unicode[STIX]{x0394}t$
. The resulting value of
${\sim}N\unicode[STIX]{x0394}t$
. The resulting value of
 $z_{\text{rms}}^{-}$
is
$z_{\text{rms}}^{-}$
is
 ${\sim}N^{1/2}\unicode[STIX]{x0394}z^{-}$
, or, equivalently,
${\sim}N^{1/2}\unicode[STIX]{x0394}z^{-}$
, or, equivalently,
 $$\begin{eqnarray}z_{\text{rms}}^{-}\sim \frac{L_{\bot }}{A}\left(\frac{U+v_{\text{A}}}{2v_{\text{A}}}\right)\left|\frac{\text{d}v_{\text{A}}}{\text{d}r}\right|.\end{eqnarray}$$
If
 $\unicode[STIX]{x1D712}_{\text{LF}}^{-}\gtrsim 1$
, then the outer-scale
$\unicode[STIX]{x1D712}_{\text{LF}}^{-}\gtrsim 1$
, then the outer-scale
 $\boldsymbol{z}^{-}$
fluctuations are sheared coherently throughout their lifetimes, the turbulence is strong and
$\boldsymbol{z}^{-}$
fluctuations are sheared coherently throughout their lifetimes, the turbulence is strong and
 $t_{\text{NL}}^{-}\sim L_{\bot }/(z_{\text{LF},\text{rms}}^{+}A)$
. In this case,
$t_{\text{NL}}^{-}\sim L_{\bot }/(z_{\text{LF},\text{rms}}^{+}A)$
. In this case,
 $z_{\text{rms}}^{-}$
is approximately the rate at which
$z_{\text{rms}}^{-}$
is approximately the rate at which
 $\boldsymbol{z}^{-}$
fluctuations are produced by non-WKB reflection multiplied by
$\boldsymbol{z}^{-}$
fluctuations are produced by non-WKB reflection multiplied by
 $t_{\text{NL}}^{-}$
, which again leads to (4.13). This estimate, with
$t_{\text{NL}}^{-}$
, which again leads to (4.13). This estimate, with
 $A\rightarrow 1$
, is the same as that obtained by Chandran & Hollweg (Reference Chandran and Hollweg2009) for the strong-turbulence limit. In the limits
$A\rightarrow 1$
, is the same as that obtained by Chandran & Hollweg (Reference Chandran and Hollweg2009) for the strong-turbulence limit. In the limits
 $U\rightarrow 0$
and
$U\rightarrow 0$
and
 $A\rightarrow 1$
, equation (4.13) is also the same as the estimate by Dmitruk et al. (Reference Dmitruk, Matthaeus, Milano, Oughton, Zank and Mullan2002) for the strong-turbulence limit.
$A\rightarrow 1$
, equation (4.13) is also the same as the estimate by Dmitruk et al. (Reference Dmitruk, Matthaeus, Milano, Oughton, Zank and Mullan2002) for the strong-turbulence limit.
Since (4.13) holds in both the weak and strong-turbulence regimes, we set
 $$\begin{eqnarray}z_{\text{rms}}^{-}=\frac{c^{-}L_{\bot }}{A}\left(\frac{U+v_{\text{A}}}{2v_{\text{A}}}\right)\left|\frac{\text{d}v_{\text{A}}}{\text{d}r}\right|\end{eqnarray}$$
regardless of the value of
 $\unicode[STIX]{x1D712}_{\text{LF}}^{-}$
, where
$\unicode[STIX]{x1D712}_{\text{LF}}^{-}$
, where
 $c^{-}$
is a dimensionless piecewise constant function that has one value at
$c^{-}$
is a dimensionless piecewise constant function that has one value at
 $r>r_{\text{m}}$
and a smaller value at
$r>r_{\text{m}}$
and a smaller value at
 $r\leqslant r_{\text{m}}$
, where
$r\leqslant r_{\text{m}}$
, where
 $r_{\text{m}}$
is defined in (3.12). Before discussing
$r_{\text{m}}$
is defined in (3.12). Before discussing
 $c^{-}$
further, we note an immediate consequence of (4.14), that
$c^{-}$
further, we note an immediate consequence of (4.14), that
 $z_{\text{rms}}^{-}$
increases as
$z_{\text{rms}}^{-}$
increases as
 $A$
(or equivalently
$A$
(or equivalently
 $\sin \unicode[STIX]{x1D703}$
) decreases. This is because reducing
$\sin \unicode[STIX]{x1D703}$
) decreases. This is because reducing
 $\sin \unicode[STIX]{x1D703}$
decreases the rate at which outer-scale
$\sin \unicode[STIX]{x1D703}$
decreases the rate at which outer-scale
 $\boldsymbol{z}^{-}$
fluctuations cascade without decreasing the rate at which they are produced by non-WKB reflection.
$\boldsymbol{z}^{-}$
fluctuations cascade without decreasing the rate at which they are produced by non-WKB reflection.
4.2 Suppression of inward-propagating fluctuations at
$r<r_{\text{m}}$

The reason we take
 $c^{-}$
to have a smaller value at
$c^{-}$
to have a smaller value at
 $r<r_{\text{m}}$
than at
$r<r_{\text{m}}$
than at
 $r>r_{\text{m}}$
is that the non-WKB-reflection source term for
$r>r_{\text{m}}$
is that the non-WKB-reflection source term for
 $\boldsymbol{z}^{-}$
fluctuations reverses direction at
$\boldsymbol{z}^{-}$
fluctuations reverses direction at
 $r=r_{\text{m}}$
, since
$r=r_{\text{m}}$
, since
 $\text{d}v_{\text{A}}/\text{d}r$
changes sign. Since
$\text{d}v_{\text{A}}/\text{d}r$
changes sign. Since
 $\boldsymbol{g}_{\text{LF}}$
has a large radial correlation length, when
$\boldsymbol{g}_{\text{LF}}$
has a large radial correlation length, when
 $\boldsymbol{z}^{-}$
fluctuations produced via non-WKB reflection at
$\boldsymbol{z}^{-}$
fluctuations produced via non-WKB reflection at
 $r>r_{\text{m}}$
propagate to
$r>r_{\text{m}}$
propagate to
 $r<r_{\text{m}}$
, they tend to cancel out the
$r<r_{\text{m}}$
, they tend to cancel out the
 $\boldsymbol{z}^{-}$
fluctuations that are produced via non-WKB reflection at
$\boldsymbol{z}^{-}$
fluctuations that are produced via non-WKB reflection at
 $r<r_{\text{m}}$
, reducing
$r<r_{\text{m}}$
, reducing
 $z_{\text{rms}}^{-}$
. If the
$z_{\text{rms}}^{-}$
. If the
 $\boldsymbol{z}^{-}$
fluctuations at
$\boldsymbol{z}^{-}$
fluctuations at
 $r=r_{\text{m}}$
can propagate a radial distance
$r=r_{\text{m}}$
can propagate a radial distance
 ${\sim}(r_{\text{m}}-R_{\odot })$
before cascading and dissipating, then this cancellation effect is large. On the other hand, if the
${\sim}(r_{\text{m}}-R_{\odot })$
before cascading and dissipating, then this cancellation effect is large. On the other hand, if the
 $\boldsymbol{z}^{-}$
fluctuations at
$\boldsymbol{z}^{-}$
fluctuations at
 $r=r_{\text{m}}$
can only propagate a radial distance
$r=r_{\text{m}}$
can only propagate a radial distance
 $\ll (r_{\text{m}}-R_{\odot })$
before cascading and dissipating, then little cancellation occurs. To account for this phenomenology, we set
$\ll (r_{\text{m}}-R_{\odot })$
before cascading and dissipating, then little cancellation occurs. To account for this phenomenology, we set
 $$\begin{eqnarray}c^{-}=\left\{\begin{array}{@{}ll@{}}c_{\text{I}}^{-}\quad & \text{if}~r\leqslant r_{\text{m}},\\ c_{\text{O}}^{-}\quad & \text{if}~r>r_{\text{m}},\end{array}\right.\end{eqnarray}$$
where
 $c_{\text{O}}^{-}$
is a dimensionless free parameter,
$c_{\text{O}}^{-}$
is a dimensionless free parameter,
 $$\begin{eqnarray}\displaystyle & \displaystyle c_{\text{I}}^{-}=\frac{c_{\text{O}}^{-}}{1+M}, & \displaystyle\end{eqnarray}$$
 $$\begin{eqnarray}\displaystyle & \displaystyle M=\frac{v_{\text{A}\text{m}}L_{\bot m}}{z_{\text{LFm}}^{+}L_{\unicode[STIX]{x1D735}}}, & \displaystyle\end{eqnarray}$$
 $L_{\unicode[STIX]{x1D735}}$
is a free parameter with dimensions of length, and
$L_{\unicode[STIX]{x1D735}}$
is a free parameter with dimensions of length, and
 $v_{\text{Am}}$
,
$v_{\text{Am}}$
,
 $L_{\bot m}$
, and
$L_{\bot m}$
, and
 $z_{\text{LF}\text{m}}^{+}$
are the values of
$z_{\text{LF}\text{m}}^{+}$
are the values of
 $v_{\text{A}}$
,
$v_{\text{A}}$
,
 $L_{\bot }$
and
$L_{\bot }$
and
 $z_{\text{LF},\text{rms}}^{+}$
at
$z_{\text{LF},\text{rms}}^{+}$
at
 $r=r_{\text{m}}$
. As we argue below (see (4.20)),
$r=r_{\text{m}}$
. As we argue below (see (4.20)),
 $A$
is of order unity at
$A$
is of order unity at
 $r<r_{\text{m}}$
, which means that
$r<r_{\text{m}}$
, which means that
 $M$
is the approximate radial distance an outer-scale
$M$
is the approximate radial distance an outer-scale
 $\boldsymbol{z}^{-}$
fluctuation at
$\boldsymbol{z}^{-}$
fluctuation at
 $r=r_{\text{m}}$
propagates before cascading to smaller scales, divided by
$r=r_{\text{m}}$
propagates before cascading to smaller scales, divided by
 $L_{\unicode[STIX]{x1D735}}$
. We can rewrite
$L_{\unicode[STIX]{x1D735}}$
. We can rewrite
 $M$
in terms of quantities evaluated at
$M$
in terms of quantities evaluated at
 $r=r_{\text{b}}$
by making the approximations that
$r=r_{\text{b}}$
by making the approximations that
 $v_{\text{A}}\gg U$
at
$v_{\text{A}}\gg U$
at
 $r\leqslant r_{\text{m}}$
and
$r\leqslant r_{\text{m}}$
and
 $g_{\text{LF},\text{rms}}(r_{\text{m}})\simeq g_{\text{LF},\text{rms}}(r_{\text{b}})$
and by using (2.17). This yields
$g_{\text{LF},\text{rms}}(r_{\text{m}})\simeq g_{\text{LF},\text{rms}}(r_{\text{b}})$
and by using (2.17). This yields
 $$\begin{eqnarray}M=\frac{v_{\text{Ab}}L_{\bot \text{b}}}{z_{\text{LF}\text{b}}^{+}L_{\unicode[STIX]{x1D735}}}\left(\frac{v_{\text{A}\text{m}}}{v_{\text{Ab}}}\right)^{1/2},\end{eqnarray}$$
where
 $v_{\text{Ab}}$
,
$v_{\text{Ab}}$
,
 $L_{\bot b}$
and
$L_{\bot b}$
and
 $z_{\text{LF}\text{b}}^{+}$
are the values of
$z_{\text{LF}\text{b}}^{+}$
are the values of
 $v_{\text{A}}$
,
$v_{\text{A}}$
,
 $L_{\bot }$
and
$L_{\bot }$
and
 $z_{\text{LF},\text{rms}}^{+}$
at
$z_{\text{LF},\text{rms}}^{+}$
at
 $r=r_{\text{b}}$
.
$r=r_{\text{b}}$
.
4.3 Alignment factor and critical-balance parameter
To estimate the alignment factor
 $A$
introduced in (4.7), we first note that nonlinear interactions between counter-propagating AWs produce negative residual energy, with
$A$
introduced in (4.7), we first note that nonlinear interactions between counter-propagating AWs produce negative residual energy, with
 $\boldsymbol{z}^{-}$
anti-parallel to
$\boldsymbol{z}^{-}$
anti-parallel to
 $\boldsymbol{z}^{+}$
(i.e. an excess of magnetic energy over kinetic energy) (Müller & Grappin Reference Müller and Grappin2005; Boldyrev et al.
Reference Boldyrev, Perez, Borovsky and Podesta2011). At
$\boldsymbol{z}^{+}$
(i.e. an excess of magnetic energy over kinetic energy) (Müller & Grappin Reference Müller and Grappin2005; Boldyrev et al.
Reference Boldyrev, Perez, Borovsky and Podesta2011). At
 $r>r_{\text{m}}$
,
$r>r_{\text{m}}$
,
 $\text{d}v_{\text{A}}/\text{d}r<0$
, and it follows from (2.15) and (2.20) that non-WKB reflection also acts to produce negative residual energy. On the other hand, at
$\text{d}v_{\text{A}}/\text{d}r<0$
, and it follows from (2.15) and (2.20) that non-WKB reflection also acts to produce negative residual energy. On the other hand, at
 $r<r_{\text{m}}$
,
$r<r_{\text{m}}$
,
 $\text{d}v_{\text{A}}/\text{d}r>0$
, and non-WKB reflection acts to produce positive residual energy. In other words, at
$\text{d}v_{\text{A}}/\text{d}r>0$
, and non-WKB reflection acts to produce positive residual energy. In other words, at
 $r<r_{\text{m}}$
, linear processes (non-WKB reflection) and nonlinear processes have competing effects on the alignment of
$r<r_{\text{m}}$
, linear processes (non-WKB reflection) and nonlinear processes have competing effects on the alignment of
 $\boldsymbol{z}^{-}$
. Based on these arguments, we conjecture that at
$\boldsymbol{z}^{-}$
. Based on these arguments, we conjecture that at
 $r<r_{\text{m}}$
the outer-scale fluctuations do not develop significant alignment, and that at
$r<r_{\text{m}}$
the outer-scale fluctuations do not develop significant alignment, and that at
 $r>r_{\text{m}}$
the outer-scale
$r>r_{\text{m}}$
the outer-scale
 $\boldsymbol{z}_{\text{LF}}^{+}$
and
$\boldsymbol{z}_{\text{LF}}^{+}$
and
 $\boldsymbol{z}^{-}$
fluctuations become increasingly aligned as the
$\boldsymbol{z}^{-}$
fluctuations become increasingly aligned as the
 $\boldsymbol{z}_{\text{LF}}^{+}$
fluctuations ‘decay’ via nonlinear interactions. We also conjecture that
$\boldsymbol{z}_{\text{LF}}^{+}$
fluctuations ‘decay’ via nonlinear interactions. We also conjecture that
 $A$
is a decreasing function of
$A$
is a decreasing function of
 $\unicode[STIX]{x1D70F}_{v}^{\text{(ph)}}$
, because a larger
$\unicode[STIX]{x1D70F}_{v}^{\text{(ph)}}$
, because a larger
 $\unicode[STIX]{x1D70F}_{v}^{\text{(ph)}}$
increases the efficiency of non-WKB reflection, which produces
$\unicode[STIX]{x1D70F}_{v}^{\text{(ph)}}$
increases the efficiency of non-WKB reflection, which produces
 $\boldsymbol{z}^{-}$
fluctuations that are aligned with
$\boldsymbol{z}^{-}$
fluctuations that are aligned with
 $\boldsymbol{z}_{\text{LF}}^{+}$
. In addition, we conjecture that
$\boldsymbol{z}_{\text{LF}}^{+}$
. In addition, we conjecture that
 $A$
is a decreasing function of
$A$
is a decreasing function of
 $$\begin{eqnarray}\unicode[STIX]{x1D6E4}=\frac{z_{\text{LF},\text{rms}}^{+}L_{r,\text{LF}}^{+}}{L_{\bot }v_{\text{A}}},\end{eqnarray}$$
which is the critical-balance parameter
 $\unicode[STIX]{x1D712}_{\text{LF}}^{-}$
in (4.9) without the factor of
$\unicode[STIX]{x1D712}_{\text{LF}}^{-}$
in (4.9) without the factor of
 $A$
. There are two reasons for taking
$A$
. There are two reasons for taking
 $A$
to decrease with increasing
$A$
to decrease with increasing
 $\unicode[STIX]{x1D6E4}$
. The first is that when
$\unicode[STIX]{x1D6E4}$
. The first is that when
 $\unicode[STIX]{x1D6E4}\ll 1$
, outer-scale
$\unicode[STIX]{x1D6E4}\ll 1$
, outer-scale
 $\boldsymbol{z}^{-}$
fluctuations can propagate through many different outer-scale
$\boldsymbol{z}^{-}$
fluctuations can propagate through many different outer-scale
 $\boldsymbol{z}_{\text{LF}}^{+}$
fluctuations before cascading to smaller scales. The
$\boldsymbol{z}_{\text{LF}}^{+}$
fluctuations before cascading to smaller scales. The
 $\boldsymbol{z}^{-}$
fluctuations that are co-located with a particular outer-scale
$\boldsymbol{z}^{-}$
fluctuations that are co-located with a particular outer-scale
 $\boldsymbol{z}_{\text{LF}}^{+}$
‘eddy’ of radial extent
$\boldsymbol{z}_{\text{LF}}^{+}$
‘eddy’ of radial extent
 ${\sim}L_{r,\text{LF}}^{+}$
are thus a mixture of the
${\sim}L_{r,\text{LF}}^{+}$
are thus a mixture of the
 $\boldsymbol{z}^{-}$
fluctuations produced by the non-WKB reflection of that
$\boldsymbol{z}^{-}$
fluctuations produced by the non-WKB reflection of that
 $\boldsymbol{z}_{\text{LF}}^{+}$
eddy and
$\boldsymbol{z}_{\text{LF}}^{+}$
eddy and
 $\boldsymbol{z}^{-}$
fluctuations that were initially produced by the non-WKB reflection of
$\boldsymbol{z}^{-}$
fluctuations that were initially produced by the non-WKB reflection of
 $\boldsymbol{z}_{\text{LF}}^{+}$
eddies located farther from the Sun. The greater the number of distinct outer-scale
$\boldsymbol{z}_{\text{LF}}^{+}$
eddies located farther from the Sun. The greater the number of distinct outer-scale
 $\boldsymbol{z}_{\text{LF}}^{+}$
eddies whose reflections contribute to the value of
$\boldsymbol{z}_{\text{LF}}^{+}$
eddies whose reflections contribute to the value of
 $\boldsymbol{z}^{-}$
at any single point, the less aligned the
$\boldsymbol{z}^{-}$
at any single point, the less aligned the
 $\boldsymbol{z}^{-}$
field will be with any individual
$\boldsymbol{z}^{-}$
field will be with any individual
 $\boldsymbol{z}_{\text{LF}}^{+}$
eddy. Moreover, when
$\boldsymbol{z}_{\text{LF}}^{+}$
eddy. Moreover, when
 $\unicode[STIX]{x1D6E4}>1$
, shearing of the
$\unicode[STIX]{x1D6E4}>1$
, shearing of the
 $\boldsymbol{z}^{-}$
fluctuations by
$\boldsymbol{z}^{-}$
fluctuations by
 $\boldsymbol{z}_{\text{LF}}^{+}$
rotates the
$\boldsymbol{z}_{\text{LF}}^{+}$
rotates the
 $\boldsymbol{z}^{-}$
fluctuations into alignment with
$\boldsymbol{z}^{-}$
fluctuations into alignment with
 $\boldsymbol{z}_{\text{LF}}^{+}$
, and the resulting value of
$\boldsymbol{z}_{\text{LF}}^{+}$
, and the resulting value of
 $A$
is a decreasing function of
$A$
is a decreasing function of
 $\unicode[STIX]{x1D6E4}$
(Chandran et al.
Reference Chandran, Schekochihin and Mallet2015b
). We quantify the foregoing conjectures by setting
$\unicode[STIX]{x1D6E4}$
(Chandran et al.
Reference Chandran, Schekochihin and Mallet2015b
). We quantify the foregoing conjectures by setting
 $$\begin{eqnarray}A=\left\{\begin{array}{@{}ll@{}}A_{0}\quad & \text{if }r<r_{\text{m}},\\ \displaystyle A_{0}\left[1+\frac{\unicode[STIX]{x1D70F}_{v}^{\text{(ph)}}\unicode[STIX]{x1D6E4}}{\unicode[STIX]{x1D70F}_{\unicode[STIX]{x1D703}}}\ln \left(\frac{g_{\text{LFm}}^{2}}{g_{\text{LF},\text{rms}}^{2}}\right)\right]^{-1}\quad & \text{if}~r>r_{\text{m}},\end{array}\right.\end{eqnarray}$$
where the dimensionless constant
 $A_{0}$
and the time constant
$A_{0}$
and the time constant
 $\unicode[STIX]{x1D70F}_{\unicode[STIX]{x1D703}}$
are free parameters.
$\unicode[STIX]{x1D70F}_{\unicode[STIX]{x1D703}}$
are free parameters.
In the linear, short-wavelength, AW propagation problem, if an AW is launched into a coronal hole by a boundary condition imposed at the transition region and photosphere, and if the AW period is
 $P$
, then the radial wavelength of the AW at radius
$P$
, then the radial wavelength of the AW at radius
 $r$
is
$r$
is
 $(U+v_{\text{A}})P$
. That is, the wave period remains constant as the wave propagates away from the Sun, and the radial wavelength varies in proportion to the wave phase velocity. We take nonlinear, non-WKB
$(U+v_{\text{A}})P$
. That is, the wave period remains constant as the wave propagates away from the Sun, and the radial wavelength varies in proportion to the wave phase velocity. We take nonlinear, non-WKB
 $\boldsymbol{z}^{+}$
fluctuations to behave in the same way, setting
$\boldsymbol{z}^{+}$
fluctuations to behave in the same way, setting
 $$\begin{eqnarray}\frac{L_{r,\text{LF}}^{+}}{L_{r,\text{LFb}}^{+}}=\frac{U+v_{\text{A}}}{U_{\text{b}}+v_{\text{Ab}}},\end{eqnarray}$$
where
 $L_{r,\text{LFb}}^{+}$
,
$L_{r,\text{LFb}}^{+}$
,
 $U_{\text{b}}$
and
$U_{\text{b}}$
and
 $v_{\text{Ab}}$
are the values, respectively, of
$v_{\text{Ab}}$
are the values, respectively, of
 $L_{r,\text{LF}}^{+}$
,
$L_{r,\text{LF}}^{+}$
,
 $U$
and
$U$
and
 $v_{\text{A}}$
evaluated at
$v_{\text{A}}$
evaluated at
 $r=r_{\text{b}}$
, and likewise for
$r=r_{\text{b}}$
, and likewise for
 $L_{r,\text{HF}}^{+}$
. It then follows from (2.17), (3.3), (3.23) and (4.21) that
$L_{r,\text{HF}}^{+}$
. It then follows from (2.17), (3.3), (3.23) and (4.21) that
 $$\begin{eqnarray}\unicode[STIX]{x1D6E4}=\unicode[STIX]{x1D6E4}_{\text{b}}\frac{g_{\text{LF},\text{rms}}}{g_{\text{LF}\text{b}}}\sqrt{\frac{v_{\text{A}}}{v_{\text{Ab}}}},\end{eqnarray}$$
where
 $\unicode[STIX]{x1D6E4}_{\text{b}}$
is the value of
$\unicode[STIX]{x1D6E4}_{\text{b}}$
is the value of
 $\unicode[STIX]{x1D6E4}$
at
$\unicode[STIX]{x1D6E4}$
at
 $r=r_{\text{b}}$
.
$r=r_{\text{b}}$
.
4.4 Solving for the fluctuation-amplitude profiles
Upon combining (4.6), (4.7), (4.14) and (4.15), we obtain
 $$\begin{eqnarray}\frac{\text{d}}{\text{d}r}\ln g_{\text{LF},\text{rms}}^{2}=\left\{\begin{array}{@{}ll@{}}\displaystyle -c_{\text{I}}\frac{\text{d}}{\text{d}r}\ln v_{\text{A}}\quad & \text{if}~r\leqslant r_{\text{m}},\\ \displaystyle c_{\text{O}}\frac{\text{d}}{\text{d}r}\ln v_{\text{A}}\quad & \text{if}~r>r_{\text{m}},\end{array}\right.\end{eqnarray}$$
where
 $$\begin{eqnarray}c_{\text{I}}\equiv c_{\text{diss}}c_{\text{I}}^{-}\quad c_{\text{O}}\equiv c_{\text{diss}}c_{\text{O}}^{-}.\end{eqnarray}$$
After integrating (4.23), we find that
 $$\begin{eqnarray}\frac{g_{\text{LF},\text{rms}}^{2}}{g_{\text{LFb}}^{2}}=\left\{\begin{array}{@{}ll@{}}\displaystyle \left(\frac{v_{\text{Ab}}}{v_{\text{A}}}\right)^{c_{\text{I}}} & \text{if}~r_{\text{b}}<r<r_{\text{m}},\\ \displaystyle \left(\frac{v_{\text{Ab}}}{v_{\text{A}\text{m}}}\right)^{c_{\text{I}}}\left(\frac{v_{\text{A}}}{v_{\text{A}\text{m}}}\right)^{c_{\text{O}}} & \text{if}~r>r_{\text{m}},\end{array}\right.,\end{eqnarray}$$
where
 $g_{\text{LF}\text{b}}$
is the value of
$g_{\text{LF}\text{b}}$
is the value of
 $g_{\text{LF},\text{rms}}$
at
$g_{\text{LF},\text{rms}}$
at
 $r=r_{\text{b}}$
. Upon combining (4.4), (4.5), (4.14) and (4.15), we obtain
$r=r_{\text{b}}$
. Upon combining (4.4), (4.5), (4.14) and (4.15), we obtain
 $$\begin{eqnarray}\frac{\text{d}}{\text{d}r}\ln g_{\text{HF},\text{rms}}^{2}=\left\{\begin{array}{@{}ll@{}}\displaystyle -\frac{c_{\text{I}}}{A}\frac{\text{d}}{\text{d}r}\ln v_{\text{A}} & \text{if}~r\leqslant r_{\text{m}}\\ \displaystyle \frac{c_{\text{O}}}{A}\frac{\text{d}}{\text{d}r}\ln v_{\text{A}} & \text{if}~r>r_{\text{m}}.\end{array}\right.\end{eqnarray}$$
With the aid of (4.20) and (4.22), we integrate (4.26) to obtain
 $$\begin{eqnarray}\frac{g_{\text{HF},\text{rms}}^{2}}{g_{\text{HFb}}^{2}}=\left\{\begin{array}{@{}ll@{}}\displaystyle \left(\frac{v_{\text{Ab}}}{v_{\text{A}}}\right)^{c_{\text{I}}/A_{0}} & \text{if}~r<r_{\text{m}},\\ \displaystyle \left(\frac{v_{\text{Ab}}}{v_{\text{Am}}}\right)^{c_{\text{I}}/A_{0}}w^{c_{\text{O}}/A_{0}}\text{e}^{-H} & \text{if}~r>r_{\text{m}},\end{array}\right.\end{eqnarray}$$
where
 $$\begin{eqnarray}H=\frac{c_{\unicode[STIX]{x1D703}}c_{\text{O}}^{2}\unicode[STIX]{x1D6E4}_{\text{b}}}{\unicode[STIX]{x1D70E}^{2}A_{0}}\left(\frac{v_{\text{Am}}}{v_{\text{Ab}}}\right)^{(1-c_{\text{I}})/2}(\unicode[STIX]{x1D70E}w^{\unicode[STIX]{x1D70E}}\ln w-w^{\unicode[STIX]{x1D70E}}+1),\end{eqnarray}$$
 $$\begin{eqnarray}w=\frac{v_{\text{A}}}{v_{\text{A}\text{m}}}\quad \unicode[STIX]{x1D70E}=\frac{1+c_{\text{O}}}{2},\end{eqnarray}$$
 $g_{\text{HFb}}$
is the value of
$g_{\text{HFb}}$
is the value of
 $g_{\text{HF},\text{rms}}$
at
$g_{\text{HF},\text{rms}}$
at
 $r=r_{\text{b}}$
and
$r=r_{\text{b}}$
and
 $c_{\unicode[STIX]{x1D703}}=\unicode[STIX]{x1D70F}_{v}^{\text{(ph)}}/\unicode[STIX]{x1D70F}_{\unicode[STIX]{x1D703}}$
.
$c_{\unicode[STIX]{x1D703}}=\unicode[STIX]{x1D70F}_{v}^{\text{(ph)}}/\unicode[STIX]{x1D70F}_{\unicode[STIX]{x1D703}}$
.
4.5 Turbulent-heating rate
The turbulent-heating rate in our model is
 $$\begin{eqnarray}Q=\frac{\unicode[STIX]{x1D70C}}{2}\left[\unicode[STIX]{x1D6FE}_{\text{HF}}^{+}(z_{\text{HF},\text{rms}}^{+})^{2}+\unicode[STIX]{x1D6FE}_{\text{LF}}^{+}(z_{\text{LF},\text{rms}}^{+})^{2}+\unicode[STIX]{x1D6FE}^{-}(z_{\text{rms}}^{-})^{2}\right],\end{eqnarray}$$
where
 $$\begin{eqnarray}\unicode[STIX]{x1D6FE}^{-}=\unicode[STIX]{x1D6FE}_{\text{LF}}^{-}+\unicode[STIX]{x1D6FE}_{\text{HF}}^{-}\end{eqnarray}$$
is the cascade rate of the outer-scale
 $\boldsymbol{z}^{-}$
fluctuations, and
$\boldsymbol{z}^{-}$
fluctuations, and
 $\unicode[STIX]{x1D6FE}_{\text{LF}}^{-}$
(
$\unicode[STIX]{x1D6FE}_{\text{LF}}^{-}$
(
 $\unicode[STIX]{x1D6FE}_{\text{HF}}^{-}$
) is the contribution to
$\unicode[STIX]{x1D6FE}_{\text{HF}}^{-}$
) is the contribution to
 $\unicode[STIX]{x1D6FE}^{-}$
from interactions between
$\unicode[STIX]{x1D6FE}^{-}$
from interactions between
 $\boldsymbol{z}^{-}$
fluctuations and LF (HF)
$\boldsymbol{z}^{-}$
fluctuations and LF (HF)
 $\boldsymbol{z}^{+}$
fluctuations. To allow for either weakly turbulent (
$\boldsymbol{z}^{+}$
fluctuations. To allow for either weakly turbulent (
 $\unicode[STIX]{x1D712}_{\text{LF}}^{-}<1$
) or strongly turbulent (
$\unicode[STIX]{x1D712}_{\text{LF}}^{-}<1$
) or strongly turbulent (
 $\unicode[STIX]{x1D712}_{\text{LF}}^{-}\geqslant 1$
) shearing of
$\unicode[STIX]{x1D712}_{\text{LF}}^{-}\geqslant 1$
) shearing of
 $\boldsymbol{z}^{-}$
fluctuations by
$\boldsymbol{z}^{-}$
fluctuations by
 $\boldsymbol{z}_{\text{LF}}^{+}$
fluctuations, we set
$\boldsymbol{z}_{\text{LF}}^{+}$
fluctuations, we set
 $$\begin{eqnarray}\unicode[STIX]{x1D6FE}_{\text{LF}}^{-}=\frac{c_{\text{diss}}z_{\text{LF},\text{rms}}^{+}A}{L_{\bot }}\times \left\{\begin{array}{@{}ll@{}}\unicode[STIX]{x1D712}_{\text{LF}}^{-} & \text{if}~\unicode[STIX]{x1D712}_{\text{LF}}^{-}\leqslant 1,\\ 1 & \text{if}~\unicode[STIX]{x1D712}_{\text{LF}}^{-}>1.\end{array}\right.\end{eqnarray}$$
In analogy to (4.9), we define the critical-balance parameter for the shearing of
 $\boldsymbol{z}^{-}$
fluctuations by
$\boldsymbol{z}^{-}$
fluctuations by
 $\boldsymbol{z}_{\text{HF}}^{+}$
fluctuations to be
$\boldsymbol{z}_{\text{HF}}^{+}$
fluctuations to be
 $$\begin{eqnarray}\unicode[STIX]{x1D712}_{\text{HF}}^{-}=\frac{z_{\text{HF},\text{rms}}^{+}L_{r,\text{HF}}^{+}}{L_{\bot }v_{\text{A}}},\end{eqnarray}$$
where we have omitted the factor of
 $A$
, because we take
$A$
, because we take
 $\boldsymbol{z}^{-}$
to be aligned with
$\boldsymbol{z}^{-}$
to be aligned with
 $\boldsymbol{z}_{\text{LF}}^{+}$
but not with
$\boldsymbol{z}_{\text{LF}}^{+}$
but not with
 $\boldsymbol{z}_{\text{HF}}^{+}$
. We then set
$\boldsymbol{z}_{\text{HF}}^{+}$
. We then set
 $$\begin{eqnarray}\unicode[STIX]{x1D6FE}_{\text{HF}}^{-}=\frac{c_{\text{diss}}z_{\text{HF},\text{rms}}^{+}}{L_{\bot }}\times \left\{\begin{array}{@{}ll@{}}\unicode[STIX]{x1D712}_{\text{HF}}^{-} & \text{if}~\unicode[STIX]{x1D712}_{\text{HF}}^{-}\leqslant 1,\\ 1 & \text{if}~\unicode[STIX]{x1D712}_{\text{HF}}^{-}>1,\end{array}\right.\end{eqnarray}$$
4.6 Comparison with simulation results
To compare our model with one of our numerical simulations, we treat
 $L_{\bot }(r_{\text{b}})=L_{\text{box}}(r_{\text{b}})/3$
,
$L_{\bot }(r_{\text{b}})=L_{\text{box}}(r_{\text{b}})/3$
,
 $L_{r,\text{LF}}^{+}(r_{\text{b}})$
,
$L_{r,\text{LF}}^{+}(r_{\text{b}})$
,
 $L_{r,\text{HF}}^{+}(r_{\text{b}})$
and
$L_{r,\text{HF}}^{+}(r_{\text{b}})$
and
 $z_{\text{rms}}^{+}(r_{\text{b}})$
as boundary conditions in our model, which we determine using the measured values of these quantities in that particular simulation. Also, motivated by figure 4, we set
$z_{\text{rms}}^{+}(r_{\text{b}})$
as boundary conditions in our model, which we determine using the measured values of these quantities in that particular simulation. Also, motivated by figure 4, we set
 $$\begin{eqnarray}\frac{g_{\text{HFb}}^{2}}{g_{\text{LFb}}^{2}}=1\end{eqnarray}$$
in all our model solutions. We take
 $L_{r,\text{HF}}^{+}(r_{\text{b}})$
in our simulations to be the radial separation
$L_{r,\text{HF}}^{+}(r_{\text{b}})$
in our simulations to be the radial separation
 $\unicode[STIX]{x0394}r$
at which
$\unicode[STIX]{x0394}r$
at which
 $C(r_{\text{b}},\unicode[STIX]{x0394}r)=1/2$
, where
$C(r_{\text{b}},\unicode[STIX]{x0394}r)=1/2$
, where
 $$\begin{eqnarray}C(r,\unicode[STIX]{x0394}r)=\frac{\langle \boldsymbol{g}(\tilde{x},{\tilde{y}},r,t)\boldsymbol{\cdot }\boldsymbol{g}(\tilde{x},{\tilde{y}},r+\unicode[STIX]{x0394}r,t)\rangle }{\langle |\boldsymbol{g}(\tilde{x},{\tilde{y}},r,t)|^{2}\rangle }\end{eqnarray}$$
is the radial autocorrelation function of the
 $\boldsymbol{g}$
fluctuations and
$\boldsymbol{g}$
fluctuations and
 $\tilde{x}$
and
$\tilde{x}$
and
 ${\tilde{y}}$
are defined following (3.28). On the other hand, because figure 4 shows that the LF fluctuations are energetically dominant at
${\tilde{y}}$
are defined following (3.28). On the other hand, because figure 4 shows that the LF fluctuations are energetically dominant at
 $r=r_{\text{max}}$
, we define
$r=r_{\text{max}}$
, we define
 $L_{r,\text{LF}}^{+}(r_{\text{max}})$
to be the value of
$L_{r,\text{LF}}^{+}(r_{\text{max}})$
to be the value of
 $\unicode[STIX]{x0394}r$
at which
$\unicode[STIX]{x0394}r$
at which
 $C(r_{\text{max}},-\unicode[STIX]{x0394}r)=1/2$
. Applying (4.21), we then set
$C(r_{\text{max}},-\unicode[STIX]{x0394}r)=1/2$
. Applying (4.21), we then set
 $L_{r,\text{LF}}^{+}(r_{\text{b}})=L_{r,\text{LF}}^{+}(r_{\text{max}})(U_{\text{b}}+v_{\text{Ab}})/[U(r_{\text{max}})+v_{\text{A}}(r_{\text{max}})]=0.886L_{\text{LF}}^{+}(r_{\text{max}})$
. The values of
$L_{r,\text{LF}}^{+}(r_{\text{b}})=L_{r,\text{LF}}^{+}(r_{\text{max}})(U_{\text{b}}+v_{\text{Ab}})/[U(r_{\text{max}})+v_{\text{A}}(r_{\text{max}})]=0.886L_{\text{LF}}^{+}(r_{\text{max}})$
. The values of
 $L_{\text{box}}(r_{\text{b}})$
,
$L_{\text{box}}(r_{\text{b}})$
,
 $L_{r,\text{LF}}^{+}(r_{\text{b}})$
,
$L_{r,\text{LF}}^{+}(r_{\text{b}})$
,
 $L_{r,\text{HF}}^{+}(r_{\text{b}})$
and
$L_{r,\text{HF}}^{+}(r_{\text{b}})$
and
 $z_{\text{rms}}^{+}(r_{\text{b}})$
in our three simulations are listed in table 3.
$z_{\text{rms}}^{+}(r_{\text{b}})$
in our three simulations are listed in table 3.
Table 3. Boundary conditions in our analytic model for matching Runs 1 through 3.
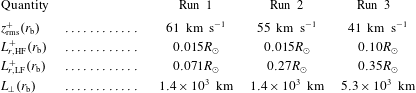
Note:
 $z_{\text{rms}}^{+}$
is the r.m.s. amplitude of the outward-propagating Elsasser variable,
$z_{\text{rms}}^{+}$
is the r.m.s. amplitude of the outward-propagating Elsasser variable,
 $L_{r,\text{LF}}^{+}$
is the radial correlation length of the low-frequency outward-propagating Heinemann–Olbert variable
$L_{r,\text{LF}}^{+}$
is the radial correlation length of the low-frequency outward-propagating Heinemann–Olbert variable
 $\boldsymbol{g}_{\text{LF}}$
,
$\boldsymbol{g}_{\text{LF}}$
,
 $L_{r,\text{HF}}^{+}$
is the radial correlation length of the high-frequency outward-propagating Heinemann–Olbert variable
$L_{r,\text{HF}}^{+}$
is the radial correlation length of the high-frequency outward-propagating Heinemann–Olbert variable
 $\boldsymbol{g}_{\text{HF}}$
,
$\boldsymbol{g}_{\text{HF}}$
,
 $L_{\bot }$
is the perpendicular outer scale (see (3.23)) and
$L_{\bot }$
is the perpendicular outer scale (see (3.23)) and
 $r_{\text{b}}$
is the radius of the coronal base defined in (3.10).
$r_{\text{b}}$
is the radius of the coronal base defined in (3.10).
Table 4. Best-fit free parameters in our analytic model.

Note: The quantity
 $c_{\text{diss}}$
is a coefficient appearing in the cascade/damping rates
$c_{\text{diss}}$
is a coefficient appearing in the cascade/damping rates
 $\unicode[STIX]{x1D6FE}_{\text{HF}}^{+}$
and
$\unicode[STIX]{x1D6FE}_{\text{HF}}^{+}$
and
 $\unicode[STIX]{x1D6FE}_{\text{LF}}^{+}$
((4.5) and (4.7)),
$\unicode[STIX]{x1D6FE}_{\text{LF}}^{+}$
((4.5) and (4.7)),
 $c_{\text{O}}^{-}$
is a coefficient in our estimate of
$c_{\text{O}}^{-}$
is a coefficient in our estimate of
 $z_{\text{rms}}^{-}$
(see (4.14) through (4.16)),
$z_{\text{rms}}^{-}$
(see (4.14) through (4.16)),
 $\unicode[STIX]{x1D70F}_{\unicode[STIX]{x1D703}}$
and
$\unicode[STIX]{x1D70F}_{\unicode[STIX]{x1D703}}$
and
 $A_{0}$
are constants appearing in our estimate of the alignment angle (4.20) and
$A_{0}$
are constants appearing in our estimate of the alignment angle (4.20) and
 $L_{\unicode[STIX]{x1D735}}$
is a length scale that affects the degree to which
$L_{\unicode[STIX]{x1D735}}$
is a length scale that affects the degree to which
 $\boldsymbol{z}^{-}$
fluctuations produced by non-WKB reflection at
$\boldsymbol{z}^{-}$
fluctuations produced by non-WKB reflection at
 $r>r_{\text{m}}\simeq 1.7R_{\odot }$
cancel out the
$r>r_{\text{m}}\simeq 1.7R_{\odot }$
cancel out the
 $\boldsymbol{z}^{-}$
fluctuations produced by non-WKB reflection at
$\boldsymbol{z}^{-}$
fluctuations produced by non-WKB reflection at
 $r<r_{\text{m}}$
(see (4.14) through (4.17)).
$r<r_{\text{m}}$
(see (4.14) through (4.17)).
We take the free parameters
 $c_{\text{diss}}$
,
$c_{\text{diss}}$
,
 $c_{\text{O}}^{-}$
,
$c_{\text{O}}^{-}$
,
 $\unicode[STIX]{x1D70F}_{\unicode[STIX]{x1D703}}$
,
$\unicode[STIX]{x1D70F}_{\unicode[STIX]{x1D703}}$
,
 $A_{0}$
and
$A_{0}$
and
 $L_{\unicode[STIX]{x1D735}}$
to be the same regardless of the simulation with which we are comparing our model. We then vary these free parameters to optimize the agreement between our model and all three simulations. We list the resulting parameters in table 4.
$L_{\unicode[STIX]{x1D735}}$
to be the same regardless of the simulation with which we are comparing our model. We then vary these free parameters to optimize the agreement between our model and all three simulations. We list the resulting parameters in table 4.
Figures 3 through 6 show the radial profiles of
 $z_{\text{rms}}^{+}$
,
$z_{\text{rms}}^{+}$
,
 $z_{\text{rms}}^{-}$
,
$z_{\text{rms}}^{-}$
,
 $z_{\text{HF},\text{rms}}^{+}$
,
$z_{\text{HF},\text{rms}}^{+}$
,
 $z_{\text{LF},\text{rms}}^{+}$
,
$z_{\text{LF},\text{rms}}^{+}$
,
 $\sin \unicode[STIX]{x1D703}$
and
$\sin \unicode[STIX]{x1D703}$
and
 $Q$
that result from our model using the best-fit parameters in table 4 and the boundary conditions in table 3. As these figures show, our model reproduces a number of trends seen in the simulations. For example, in both the model and simulations,
$Q$
that result from our model using the best-fit parameters in table 4 and the boundary conditions in table 3. As these figures show, our model reproduces a number of trends seen in the simulations. For example, in both the model and simulations,
 $z_{\text{HF},\text{rms}}^{+}/z_{\text{LF},\text{rms}}^{+}$
and
$z_{\text{HF},\text{rms}}^{+}/z_{\text{LF},\text{rms}}^{+}$
and
 $\sin \unicode[STIX]{x1D703}$
decrease with increasing
$\sin \unicode[STIX]{x1D703}$
decrease with increasing
 $r$
, particularly in Run 2. The radial decrease in
$r$
, particularly in Run 2. The radial decrease in
 $z_{\text{HF}}^{+}/z_{\text{LF}}^{+}$
is consistent with our expectation that high-frequency
$z_{\text{HF}}^{+}/z_{\text{LF}}^{+}$
is consistent with our expectation that high-frequency
 $\boldsymbol{z}^{+}$
fluctuations cascade and dissipate more rapidly than low-frequency
$\boldsymbol{z}^{+}$
fluctuations cascade and dissipate more rapidly than low-frequency
 $\boldsymbol{z}^{+}$
fluctuations, because high-frequency
$\boldsymbol{z}^{+}$
fluctuations, because high-frequency
 $\boldsymbol{z}^{+}$
fluctuations are not aligned with
$\boldsymbol{z}^{+}$
fluctuations are not aligned with
 $\boldsymbol{z}^{-}$
. In our model, the radial decrease in
$\boldsymbol{z}^{-}$
. In our model, the radial decrease in
 $\sin \unicode[STIX]{x1D703}$
is related both to the comparatively rapid cascade of the unaligned high-frequency
$\sin \unicode[STIX]{x1D703}$
is related both to the comparatively rapid cascade of the unaligned high-frequency
 $\boldsymbol{z}^{+}$
fluctuations and the fact that the low-frequency
$\boldsymbol{z}^{+}$
fluctuations and the fact that the low-frequency
 $\boldsymbol{z}^{+}$
fluctuations become increasingly aligned with
$\boldsymbol{z}^{+}$
fluctuations become increasingly aligned with
 $\boldsymbol{z}^{-}$
as they interact nonlinearly with
$\boldsymbol{z}^{-}$
as they interact nonlinearly with
 $\boldsymbol{z}^{-}$
. We note that the decrease in
$\boldsymbol{z}^{-}$
. We note that the decrease in
 $\sin \unicode[STIX]{x1D703}$
coincides with an increase in
$\sin \unicode[STIX]{x1D703}$
coincides with an increase in
 $z_{\text{rms}}^{-}$
for the reasons described following (4.14). The model reproduces the
$z_{\text{rms}}^{-}$
for the reasons described following (4.14). The model reproduces the
 $z_{\text{rms}}^{\pm }$
profiles in the simulations fairly accurately. The turbulent-heating rates in the model and simulations also agree quite well, but the heating rate in the model is somewhat smaller than in Run 3 at
$z_{\text{rms}}^{\pm }$
profiles in the simulations fairly accurately. The turbulent-heating rates in the model and simulations also agree quite well, but the heating rate in the model is somewhat smaller than in Run 3 at
 $r>3R_{\odot }$
. The most notable failing of the model is that
$r>3R_{\odot }$
. The most notable failing of the model is that
 $z_{\text{rms}}^{-}=Q=0$
at
$z_{\text{rms}}^{-}=Q=0$
at
 $r=r_{\text{m}}$
, because our estimate of
$r=r_{\text{m}}$
, because our estimate of
 $z_{\text{rms}}^{-}$
is proportional to the local value of
$z_{\text{rms}}^{-}$
is proportional to the local value of
 $\text{d}v_{\text{A}}/\text{d}r$
, which vanishes at
$\text{d}v_{\text{A}}/\text{d}r$
, which vanishes at
 $r=r_{\text{m}}$
. A more realistic model would account for the fact that
$r=r_{\text{m}}$
. A more realistic model would account for the fact that
 $\boldsymbol{z}^{-}$
fluctuations propagate a finite distance before cascading and dissipating, which would smooth out the profiles of
$\boldsymbol{z}^{-}$
fluctuations propagate a finite distance before cascading and dissipating, which would smooth out the profiles of
 $z_{\text{rms}}^{-}$
and
$z_{\text{rms}}^{-}$
and
 $Q$
in the vicinity of
$Q$
in the vicinity of
 $r=r_{\text{m}}$
. Importantly, despite the aforementioned differences between the model and our numerical results, varying the boundary conditions in the model to match the measured conditions in the simulations largely accounts for the differences between the
$r=r_{\text{m}}$
. Importantly, despite the aforementioned differences between the model and our numerical results, varying the boundary conditions in the model to match the measured conditions in the simulations largely accounts for the differences between the
 $z_{\text{rms}}^{\pm }$
and
$z_{\text{rms}}^{\pm }$
and
 $Q$
profiles in Runs 1, 2, and 3 without any modification to the free parameters in table 4. This suggests that the model provides a reasonably accurate representation of the dominant physical processes that control these radial profiles.
$Q$
profiles in Runs 1, 2, and 3 without any modification to the free parameters in table 4. This suggests that the model provides a reasonably accurate representation of the dominant physical processes that control these radial profiles.
5 Previous studies of the Elsasser power spectra in MHD turbulence
In this section, we review previous studies of the Elsasser power spectra in homogeneous RMHD turbulence and reflection-driven MHD turbulence. The reader already familiar with this literature may wish to skip directly to § 6. We follow the convention of describing the turbulent
 $\boldsymbol{z}^{\pm }$
fluctuations as collections of AW packets, using
$\boldsymbol{z}^{\pm }$
fluctuations as collections of AW packets, using
 $\unicode[STIX]{x1D706}$
to denote the length scale of a wave packet measured perpendicular to the magnetic field,
$\unicode[STIX]{x1D706}$
to denote the length scale of a wave packet measured perpendicular to the magnetic field,
 $l_{\unicode[STIX]{x1D706}}^{\pm }$
to denote the correlation length measured along the magnetic field of
$l_{\unicode[STIX]{x1D706}}^{\pm }$
to denote the correlation length measured along the magnetic field of
 $\boldsymbol{z}^{\pm }$
wave packets with perpendicular scale
$\boldsymbol{z}^{\pm }$
wave packets with perpendicular scale
 $\unicode[STIX]{x1D706}$
, and
$\unicode[STIX]{x1D706}$
, and
 $\unicode[STIX]{x1D6FF}z_{\unicode[STIX]{x1D706}}^{\pm }$
to denote the amplitude of wave packets at scale
$\unicode[STIX]{x1D6FF}z_{\unicode[STIX]{x1D706}}^{\pm }$
to denote the amplitude of wave packets at scale
 $\unicode[STIX]{x1D706}$
– i.e. the r.m.s. increment in
$\unicode[STIX]{x1D706}$
– i.e. the r.m.s. increment in
 $\boldsymbol{z}^{\pm }$
across a distance
$\boldsymbol{z}^{\pm }$
across a distance
 $\unicode[STIX]{x1D706}$
perpendicular to the magnetic field.
$\unicode[STIX]{x1D706}$
perpendicular to the magnetic field.
5.1 Balanced, homogeneous RMHD turbulence
In ‘balanced turbulence’, the statistical properties of
 $\boldsymbol{z}^{+}$
and
$\boldsymbol{z}^{+}$
and
 $\boldsymbol{z}^{-}$
fluctuations are identical. In particular,
$\boldsymbol{z}^{-}$
fluctuations are identical. In particular,
 $$\begin{eqnarray}\unicode[STIX]{x1D6FF}z_{\unicode[STIX]{x1D706}}^{+}=\unicode[STIX]{x1D6FF}z_{\unicode[STIX]{x1D706}}^{-}\quad l_{\unicode[STIX]{x1D706}}^{+}=l_{\unicode[STIX]{x1D706}}^{-},\end{eqnarray}$$
and the cross-helicity (the difference between the energies per unit mass of
 $\boldsymbol{z}^{+}$
and
$\boldsymbol{z}^{+}$
and
 $\boldsymbol{z}^{-}$
fluctuations) is zero. In homogeneous RMHD turbulence, the strongest nonlinear interactions are local in scale, meaning that
$\boldsymbol{z}^{-}$
fluctuations) is zero. In homogeneous RMHD turbulence, the strongest nonlinear interactions are local in scale, meaning that
 $\unicode[STIX]{x1D6FF}z_{\unicode[STIX]{x1D706}}^{\pm }$
fluctuations are cascaded primarily by
$\unicode[STIX]{x1D6FF}z_{\unicode[STIX]{x1D706}}^{\pm }$
fluctuations are cascaded primarily by
 $\boldsymbol{z}^{\mp }$
fluctuations at perpendicular scales comparable to
$\boldsymbol{z}^{\mp }$
fluctuations at perpendicular scales comparable to
 $\unicode[STIX]{x1D706}$
. To understand how a
$\unicode[STIX]{x1D706}$
. To understand how a
 $\unicode[STIX]{x1D6FF}z_{\unicode[STIX]{x1D706}}^{\pm }$
wave packet cascades, it is helpful to consider a propagating ‘slice’ of the wave packet – i.e. a single cross-section of the wave packet in the plane perpendicular to the background magnetic field (see, e.g. Lithwick et al.
Reference Lithwick, Goldreich and Sridhar2007). This slice ‘collides’ with a series of counter-propagating
$\unicode[STIX]{x1D6FF}z_{\unicode[STIX]{x1D706}}^{\pm }$
wave packet cascades, it is helpful to consider a propagating ‘slice’ of the wave packet – i.e. a single cross-section of the wave packet in the plane perpendicular to the background magnetic field (see, e.g. Lithwick et al.
Reference Lithwick, Goldreich and Sridhar2007). This slice ‘collides’ with a series of counter-propagating
 $\unicode[STIX]{x1D6FF}z_{\unicode[STIX]{x1D706}}^{\mp }$
wave packets. Each collision has a duration of
$\unicode[STIX]{x1D6FF}z_{\unicode[STIX]{x1D706}}^{\mp }$
wave packets. Each collision has a duration of
 $$\begin{eqnarray}t_{\unicode[STIX]{x1D706}}^{\pm }\sim \frac{l_{\unicode[STIX]{x1D706}}^{\mp }}{v_{\text{A}}}.\end{eqnarray}$$
The instantaneous rate at which
 $\unicode[STIX]{x1D6FF}z_{\unicode[STIX]{x1D706}}^{\mp }$
wave packets shear
$\unicode[STIX]{x1D6FF}z_{\unicode[STIX]{x1D706}}^{\mp }$
wave packets shear
 $\unicode[STIX]{x1D6FF}z_{\unicode[STIX]{x1D706}}^{\pm }$
wave packets is
$\unicode[STIX]{x1D6FF}z_{\unicode[STIX]{x1D706}}^{\pm }$
wave packets is
 ${\sim}\unicode[STIX]{x1D6FF}z_{\unicode[STIX]{x1D706}}^{\mp }/\unicode[STIX]{x1D706}$
. During a single collision, the aforementioned ‘slice’ of the
${\sim}\unicode[STIX]{x1D6FF}z_{\unicode[STIX]{x1D706}}^{\mp }/\unicode[STIX]{x1D706}$
. During a single collision, the aforementioned ‘slice’ of the
 $\unicode[STIX]{x1D6FF}z_{\unicode[STIX]{x1D706}}^{\pm }$
fluctuation undergoes a fractional distortion of order (Goldreich & Sridhar Reference Goldreich and Sridhar1995; Goldreich & Sridhar Reference Goldreich and Sridhar1997; Lithwick et al.
Reference Lithwick, Goldreich and Sridhar2007)
$\unicode[STIX]{x1D6FF}z_{\unicode[STIX]{x1D706}}^{\pm }$
fluctuation undergoes a fractional distortion of order (Goldreich & Sridhar Reference Goldreich and Sridhar1995; Goldreich & Sridhar Reference Goldreich and Sridhar1997; Lithwick et al.
Reference Lithwick, Goldreich and Sridhar2007)
 $$\begin{eqnarray}\unicode[STIX]{x1D712}_{\unicode[STIX]{x1D706}}^{\pm }=\frac{\unicode[STIX]{x1D6FF}z_{\unicode[STIX]{x1D706}}^{\mp }l_{\unicode[STIX]{x1D706}}^{\mp }}{\unicode[STIX]{x1D706}v_{\text{A}}}.\end{eqnarray}$$
5.1.1 Weak balanced turbulence
If
 $\unicode[STIX]{x1D712}_{\unicode[STIX]{x1D706}}^{\pm }\ll 1$
, a
$\unicode[STIX]{x1D712}_{\unicode[STIX]{x1D706}}^{\pm }\ll 1$
, a
 $\unicode[STIX]{x1D6FF}z_{\unicode[STIX]{x1D706}}^{\pm }$
wave packet undergoes only a small fractional change during each collision, and the turbulence is weak. Ng & Bhattacharjee (Reference Ng and Bhattacharjee1996, Reference Ng and Bhattacharjee1997) and Goldreich & Sridhar (Reference Goldreich and Sridhar1997) advanced a phenomenological model of weak, incompressible, MHD turbulence in which the effects of consecutive collisions are uncorrelated and add like a random walk. After
$\unicode[STIX]{x1D6FF}z_{\unicode[STIX]{x1D706}}^{\pm }$
wave packet undergoes only a small fractional change during each collision, and the turbulence is weak. Ng & Bhattacharjee (Reference Ng and Bhattacharjee1996, Reference Ng and Bhattacharjee1997) and Goldreich & Sridhar (Reference Goldreich and Sridhar1997) advanced a phenomenological model of weak, incompressible, MHD turbulence in which the effects of consecutive collisions are uncorrelated and add like a random walk. After
 $N$
collisions, the r.m.s. fractional change in a
$N$
collisions, the r.m.s. fractional change in a
 $\unicode[STIX]{x1D6FF}z_{\unicode[STIX]{x1D706}}^{\pm }$
wave packet is
$\unicode[STIX]{x1D6FF}z_{\unicode[STIX]{x1D706}}^{\pm }$
wave packet is
 ${\sim}N^{1/2}\unicode[STIX]{x1D712}_{\unicode[STIX]{x1D706}}^{\pm }$
. After
${\sim}N^{1/2}\unicode[STIX]{x1D712}_{\unicode[STIX]{x1D706}}^{\pm }$
. After
 $N\sim (\unicode[STIX]{x1D712}_{\unicode[STIX]{x1D706}}^{\pm })^{-2}$
collisions, the r.m.s. fractional distortion of the wave packet grows to a value of order unity, and the energy contained within the wave packet cascades to smaller scales. The cascade time scale is thus
$N\sim (\unicode[STIX]{x1D712}_{\unicode[STIX]{x1D706}}^{\pm })^{-2}$
collisions, the r.m.s. fractional distortion of the wave packet grows to a value of order unity, and the energy contained within the wave packet cascades to smaller scales. The cascade time scale is thus
 $$\begin{eqnarray}\unicode[STIX]{x1D70F}_{\unicode[STIX]{x1D706}}^{\pm }\sim (\unicode[STIX]{x1D712}_{\unicode[STIX]{x1D706}}^{\pm })^{-2}t_{\unicode[STIX]{x1D706}}^{\pm }\sim \frac{\unicode[STIX]{x1D706}^{2}v_{\text{A}}}{(\unicode[STIX]{x1D6FF}z_{\unicode[STIX]{x1D706}}^{\mp })^{2}l_{\unicode[STIX]{x1D706}}^{\mp }}.\end{eqnarray}$$
Because neither the
 $\unicode[STIX]{x1D6FF}z_{\unicode[STIX]{x1D706}}^{+}$
nor
$\unicode[STIX]{x1D6FF}z_{\unicode[STIX]{x1D706}}^{+}$
nor
 $\unicode[STIX]{x1D6FF}z_{\unicode[STIX]{x1D706}}^{-}$
wave packet is altered significantly during any single collision, the leading and trailing edges of a
$\unicode[STIX]{x1D6FF}z_{\unicode[STIX]{x1D706}}^{-}$
wave packet is altered significantly during any single collision, the leading and trailing edges of a
 $\unicode[STIX]{x1D6FF}z_{\unicode[STIX]{x1D706}}^{\pm }$
wave packet are sheared in virtually the same way during each collision, and the parallel length scale of the wave packets does not change as the fluctuation energy cascades to smaller
$\unicode[STIX]{x1D6FF}z_{\unicode[STIX]{x1D706}}^{\pm }$
wave packet are sheared in virtually the same way during each collision, and the parallel length scale of the wave packets does not change as the fluctuation energy cascades to smaller
 $\unicode[STIX]{x1D706}$
(Shebalin, Matthaeus & Montgomery Reference Shebalin, Matthaeus and Montgomery1983); i.e.
$\unicode[STIX]{x1D706}$
(Shebalin, Matthaeus & Montgomery Reference Shebalin, Matthaeus and Montgomery1983); i.e.
 $$\begin{eqnarray}l_{\unicode[STIX]{x1D706}}^{\pm }\propto \unicode[STIX]{x1D706}^{0}.\end{eqnarray}$$
In the inertial range, the
 $\boldsymbol{z}^{\pm }$
energy-cascade rate (per unit mass),
$\boldsymbol{z}^{\pm }$
energy-cascade rate (per unit mass),
 $\unicode[STIX]{x1D716}^{\pm }$
, is independent of scale:
$\unicode[STIX]{x1D716}^{\pm }$
, is independent of scale:
 $$\begin{eqnarray}\unicode[STIX]{x1D716}^{\pm }\sim \frac{(\unicode[STIX]{x1D6FF}z_{\unicode[STIX]{x1D706}}^{\pm })^{2}}{\unicode[STIX]{x1D70F}_{\unicode[STIX]{x1D706}}^{\pm }}\propto \unicode[STIX]{x1D706}^{0}.\end{eqnarray}$$
Equations (5.1), (5.4), (5.5) and (5.6) imply that
 $$\begin{eqnarray}\unicode[STIX]{x1D6FF}z_{\unicode[STIX]{x1D706}}^{\pm }\propto \unicode[STIX]{x1D706}^{1/2}.\end{eqnarray}$$
The scaling of the one-dimensional power spectrum of the
 $\boldsymbol{z}^{\pm }$
fluctuations, denoted
$\boldsymbol{z}^{\pm }$
fluctuations, denoted
 $E^{\pm }(k_{\bot })$
, follows from the relation
$E^{\pm }(k_{\bot })$
, follows from the relation
 $$\begin{eqnarray}k_{\bot }E^{\pm }(k_{\bot })\sim (\unicode[STIX]{x1D6FF}z_{\unicode[STIX]{x1D706}}^{\pm })^{2}|_{\unicode[STIX]{x1D706}=k_{\bot }^{-1}},\end{eqnarray}$$
where
 $k_{\bot }$
is the component of the wave vector perpendicular to the background magnetic field. Equations (5.7) and (5.8) imply that
$k_{\bot }$
is the component of the wave vector perpendicular to the background magnetic field. Equations (5.7) and (5.8) imply that
 $$\begin{eqnarray}E^{\pm }(k_{\bot })\propto k_{\bot }^{-2}.\end{eqnarray}$$
The scaling in (5.9) has been found in direct numerical simulations (Perez & Boldyrev Reference Perez and Boldyrev2008) as well as in exact solutions to the weak-turbulence wave kinetic equations for incompressible MHD turbulence (Galtier et al.
Reference Galtier, Nazarenko, Newell and Pouquet2000). It is worth noting, however, that in weak-turbulence theory all AWs are cascaded by
 $k_{\Vert }=0$
modes, where
$k_{\Vert }=0$
modes, where
 $k_{\Vert }$
is the wave-vector component along
$k_{\Vert }$
is the wave-vector component along
 $\boldsymbol{B}_{0}$
, and these zero-frequency modes violate the assumptions of weak-turbulence theory. Several studies have addressed this issue, as well as its consequences for imbalanced turbulence (Boldyrev & Perez Reference Boldyrev and Perez2009; Schekochihin, Nazarenko & Yousef Reference Schekochihin, Nazarenko and Yousef2012; Meyrand, Kiyani & Galtier Reference Meyrand, Kiyani and Galtier2015), as discussed further in § 5.2.1.
$\boldsymbol{B}_{0}$
, and these zero-frequency modes violate the assumptions of weak-turbulence theory. Several studies have addressed this issue, as well as its consequences for imbalanced turbulence (Boldyrev & Perez Reference Boldyrev and Perez2009; Schekochihin, Nazarenko & Yousef Reference Schekochihin, Nazarenko and Yousef2012; Meyrand, Kiyani & Galtier Reference Meyrand, Kiyani and Galtier2015), as discussed further in § 5.2.1.
5.1.2 Strong balanced turbulence
If
 $\unicode[STIX]{x1D712}_{\unicode[STIX]{x1D706}}^{\pm }\gtrsim 1$
, then each slice of a
$\unicode[STIX]{x1D712}_{\unicode[STIX]{x1D706}}^{\pm }\gtrsim 1$
, then each slice of a
 $\unicode[STIX]{x1D6FF}z_{\unicode[STIX]{x1D706}}^{\pm }$
wave packet is strongly distorted during a single collision, the turbulence is strong and
$\unicode[STIX]{x1D6FF}z_{\unicode[STIX]{x1D706}}^{\pm }$
wave packet is strongly distorted during a single collision, the turbulence is strong and
 $\boldsymbol{z}^{\pm }$
energy at scale
$\boldsymbol{z}^{\pm }$
energy at scale
 $\unicode[STIX]{x1D706}$
cascades to smaller scales on the time scale
$\unicode[STIX]{x1D706}$
cascades to smaller scales on the time scale
 $$\begin{eqnarray}\unicode[STIX]{x1D70F}_{\unicode[STIX]{x1D706}}^{\pm }\sim \frac{\unicode[STIX]{x1D706}}{\unicode[STIX]{x1D6FF}z_{\unicode[STIX]{x1D706}}^{\mp }},\end{eqnarray}$$
leading to a scale-independent energy-cascade rate
 $$\begin{eqnarray}\unicode[STIX]{x1D716}^{\pm }\sim \frac{(\unicode[STIX]{x1D6FF}z_{\unicode[STIX]{x1D706}}^{\pm })^{2}\unicode[STIX]{x1D6FF}z_{\unicode[STIX]{x1D706}}^{\mp }}{\unicode[STIX]{x1D706}}\propto \unicode[STIX]{x1D706}^{0}.\end{eqnarray}$$
Equations (5.1) and (5.11) imply that
 $$\begin{eqnarray}\unicode[STIX]{x1D6FF}z_{\unicode[STIX]{x1D706}}^{\pm }\propto \unicode[STIX]{x1D706}^{1/3},\end{eqnarray}$$
which implies via (5.8) that
 $$\begin{eqnarray}E^{\pm }(k_{\bot })\propto k_{\bot }^{-5/3}.\end{eqnarray}$$
Goldreich & Sridhar (Reference Goldreich and Sridhar1995) conjectured that in strong, balanced, RMHD turbulence (and also in anisotropic, incompressible, MHD turbulence), the linear and nonlinear time scales of each wave packet are comparable, i.e.
 $$\begin{eqnarray}\unicode[STIX]{x1D712}_{\unicode[STIX]{x1D706}}^{\pm }\sim 1.\end{eqnarray}$$
Numerical simulations confirm that this ‘critical-balance’ conjecture describes strong RMHD turbulence not only on average (Cho & Vishniac Reference Cho and Vishniac2000), but structure by structure (Mallet, Schekochihin & Chandran Reference Mallet, Schekochihin and Chandran2015). Together, equations (5.12) and (5.14) imply that
 $$\begin{eqnarray}l_{\unicode[STIX]{x1D706}}^{\pm }\propto \unicode[STIX]{x1D706}^{2/3}.\end{eqnarray}$$
Several studies have argued, on the basis of numerical simulations and theoretical arguments, that the inertial-range power spectrum in strong, balanced, RMHD turbulence is flatter than in the Goldreich–Sridhar model and closer to
 $k_{\bot }^{-3/2}$
, because of scale-dependent dynamic alignment (Boldyrev Reference Boldyrev2005, Reference Boldyrev2006; Mason et al.
Reference Mason, Cattaneo and Boldyrev2008; Perez et al.
Reference Perez, Mason, Boldyrev and Cattaneo2012) and/or intermittency (Maron & Goldreich Reference Maron and Goldreich2001; Chandran et al.
Reference Chandran, Schekochihin and Mallet2015b
; Mallet & Schekochihin Reference Mallet and Schekochihin2017). On the other hand, Beresnyak (Reference Beresnyak2012, Reference Beresnyak2014) argued for a scaling closer to
$k_{\bot }^{-3/2}$
, because of scale-dependent dynamic alignment (Boldyrev Reference Boldyrev2005, Reference Boldyrev2006; Mason et al.
Reference Mason, Cattaneo and Boldyrev2008; Perez et al.
Reference Perez, Mason, Boldyrev and Cattaneo2012) and/or intermittency (Maron & Goldreich Reference Maron and Goldreich2001; Chandran et al.
Reference Chandran, Schekochihin and Mallet2015b
; Mallet & Schekochihin Reference Mallet and Schekochihin2017). On the other hand, Beresnyak (Reference Beresnyak2012, Reference Beresnyak2014) argued for a scaling closer to
 $k_{\bot }^{-5/3}$
based on the Reynolds-number scaling of the amplitude of dissipation-scale structures. A possible resolution of the disagreement between these two sets of studies was provided by Loureiro & Boldyrev (Reference Loureiro and Boldyrev2017a
), Loureiro & Boldyrev (Reference Loureiro and Boldyrev2017b
) and Mallet, Schekochihin & Chandran (Reference Mallet, Schekochihin and Chandran2017a
), Mallet, Schekochihin & Chandran (Reference Mallet, Schekochihin and Chandran2017b
), who investigated the disruption of sheet-like structures in RMHD turbulence by the tearing instability and magnetic reconnection (see also Pucci & Velli Reference Pucci and Velli2014; Pucci et al.
Reference Pucci, Velli, Tenerani and Del Sarto2018; Vech et al.
Reference Vech, Mallet, Klein and Kasper2018).
$k_{\bot }^{-5/3}$
based on the Reynolds-number scaling of the amplitude of dissipation-scale structures. A possible resolution of the disagreement between these two sets of studies was provided by Loureiro & Boldyrev (Reference Loureiro and Boldyrev2017a
), Loureiro & Boldyrev (Reference Loureiro and Boldyrev2017b
) and Mallet, Schekochihin & Chandran (Reference Mallet, Schekochihin and Chandran2017a
), Mallet, Schekochihin & Chandran (Reference Mallet, Schekochihin and Chandran2017b
), who investigated the disruption of sheet-like structures in RMHD turbulence by the tearing instability and magnetic reconnection (see also Pucci & Velli Reference Pucci and Velli2014; Pucci et al.
Reference Pucci, Velli, Tenerani and Del Sarto2018; Vech et al.
Reference Vech, Mallet, Klein and Kasper2018).
5.2 Imbalanced RMHD turbulence in homogeneous plasmas
In ‘imbalanced turbulence’, one of the Elsasser variables, say
 $\boldsymbol{z}^{+}$
, has a substantially higher r.m.s. amplitude than the other,
$\boldsymbol{z}^{+}$
, has a substantially higher r.m.s. amplitude than the other,
 $$\begin{eqnarray}z_{\text{rms}}^{+}>z_{\text{rms}}^{-}.\end{eqnarray}$$
Equation (5.16) includes the highly imbalanced case, in which
 $z_{\text{rms}}^{+}\gg z_{\text{rms}}^{-}$
, as well as moderately imbalanced turbulence, in which, e.g.
$z_{\text{rms}}^{+}\gg z_{\text{rms}}^{-}$
, as well as moderately imbalanced turbulence, in which, e.g.
 $z_{\text{rms}}^{+}\simeq 2z_{\text{rms}}^{-}$
.
$z_{\text{rms}}^{+}\simeq 2z_{\text{rms}}^{-}$
.
5.2.1 Weak imbalanced turbulence
When (5.16) is satisfied and
 $$\begin{eqnarray}\unicode[STIX]{x1D712}_{\unicode[STIX]{x1D706}}^{+}\ll 1\quad \unicode[STIX]{x1D712}_{\unicode[STIX]{x1D706}}^{-}\ll 1,\end{eqnarray}$$
the turbulence is both imbalanced and weak. Galtier et al. (Reference Galtier, Nazarenko, Newell and Pouquet2000) showed that in the weak-turbulence theory of imbalanced incompressible MHD turbulence,
 $$\begin{eqnarray}\unicode[STIX]{x1D6FC}^{+}+\unicode[STIX]{x1D6FC}^{-}=4,\end{eqnarray}$$
where
 $$\begin{eqnarray}E^{\pm }(k_{\bot })\propto k_{\bot }^{-\unicode[STIX]{x1D6FC}^{\pm }},\end{eqnarray}$$
the homogeneous-turbulence version of (3.35). Lithwick & Goldreich (Reference Lithwick and Goldreich2003) argued that in weak incompressible MHD turbulence, the spectra are ‘pinned’ at the dissipation wavenumber
 $k_{\bot d}$
, with
$k_{\bot d}$
, with
 $E^{+}(k_{\bot d})=E^{-}(k_{\bot d})$
, and that the more energetic Elsasser variable has the steeper inertial-range power spectrum. Boldyrev & Perez (Reference Boldyrev and Perez2009) espoused a different picture, in which a ‘condensate’ of magnetic fluctuations at
$E^{+}(k_{\bot d})=E^{-}(k_{\bot d})$
, and that the more energetic Elsasser variable has the steeper inertial-range power spectrum. Boldyrev & Perez (Reference Boldyrev and Perez2009) espoused a different picture, in which a ‘condensate’ of magnetic fluctuations at
 $k_{\Vert }=0$
dominates the energy cascade, leading to a state in which
$k_{\Vert }=0$
dominates the energy cascade, leading to a state in which
 $\unicode[STIX]{x1D6FC}^{+}=\unicode[STIX]{x1D6FC}^{-}=2$
. Schekochihin et al. (Reference Schekochihin, Nazarenko and Yousef2012) developed a theory accounting for both weakly turbulent AWs with non-zero
$\unicode[STIX]{x1D6FC}^{+}=\unicode[STIX]{x1D6FC}^{-}=2$
. Schekochihin et al. (Reference Schekochihin, Nazarenko and Yousef2012) developed a theory accounting for both weakly turbulent AWs with non-zero
 $k_{\Vert }$
and two-dimensional modes with
$k_{\Vert }$
and two-dimensional modes with
 $k_{\Vert }=0$
, and found that
$k_{\Vert }=0$
, and found that
 $\unicode[STIX]{x1D6FC}^{+}=\unicode[STIX]{x1D6FC}^{-}=2$
for the weakly turbulent modes and
$\unicode[STIX]{x1D6FC}^{+}=\unicode[STIX]{x1D6FC}^{-}=2$
for the weakly turbulent modes and
 $\unicode[STIX]{x1D6FC}^{+}=\unicode[STIX]{x1D6FC}^{-}=1$
for the two-dimensional modes in the imbalanced case.
$\unicode[STIX]{x1D6FC}^{+}=\unicode[STIX]{x1D6FC}^{-}=1$
for the two-dimensional modes in the imbalanced case.
5.2.2 Strong imbalanced turbulence
When (5.16) is satisfied and
 $\unicode[STIX]{x1D712}_{\unicode[STIX]{x1D706}}^{+}$
or
$\unicode[STIX]{x1D712}_{\unicode[STIX]{x1D706}}^{+}$
or
 $\unicode[STIX]{x1D712}_{\unicode[STIX]{x1D706}}^{-}$
is
$\unicode[STIX]{x1D712}_{\unicode[STIX]{x1D706}}^{-}$
is
 ${\gtrsim}1$
, the turbulence is considered strong. A number of authors have developed models of strong imbalanced MHD turbulence (e.g. Beresnyak & Lazarian Reference Beresnyak and Lazarian2008; Chandran Reference Chandran2008a
; Beresnyak & Lazarian Reference Beresnyak and Lazarian2009; Perez & Boldyrev Reference Perez and Boldyrev2009; Perez & Boldyrev Reference Perez and Boldyrev2010; Podesta & Bhattacharjee Reference Podesta and Bhattacharjee2010). Here we focus on the study by Lithwick et al. (Reference Lithwick, Goldreich and Sridhar2007) (hereafter LGS), who explored an assumption about the forcing of outer-scale
${\gtrsim}1$
, the turbulence is considered strong. A number of authors have developed models of strong imbalanced MHD turbulence (e.g. Beresnyak & Lazarian Reference Beresnyak and Lazarian2008; Chandran Reference Chandran2008a
; Beresnyak & Lazarian Reference Beresnyak and Lazarian2009; Perez & Boldyrev Reference Perez and Boldyrev2009; Perez & Boldyrev Reference Perez and Boldyrev2010; Podesta & Bhattacharjee Reference Podesta and Bhattacharjee2010). Here we focus on the study by Lithwick et al. (Reference Lithwick, Goldreich and Sridhar2007) (hereafter LGS), who explored an assumption about the forcing of outer-scale
 $\boldsymbol{z}^{-}$
fluctuations that turns out to be particularly relevant to inhomogeneous reflection-driven MHD turbulence in the solar wind.
$\boldsymbol{z}^{-}$
fluctuations that turns out to be particularly relevant to inhomogeneous reflection-driven MHD turbulence in the solar wind.
LGS assumed, in addition to (5.16), that
 $$\begin{eqnarray}\unicode[STIX]{x1D712}_{\unicode[STIX]{x1D706}}^{-}\gtrsim 1.\end{eqnarray}$$
Equation (5.20) implies that
 $\unicode[STIX]{x1D6FF}z_{\unicode[STIX]{x1D706}}^{-}$
fluctuations are sheared on a time scale
$\unicode[STIX]{x1D6FF}z_{\unicode[STIX]{x1D706}}^{-}$
fluctuations are sheared on a time scale
 $\unicode[STIX]{x1D706}/\unicode[STIX]{x1D6FF}z_{\unicode[STIX]{x1D706}}^{+}$
that is comparable to or less than the time
$\unicode[STIX]{x1D706}/\unicode[STIX]{x1D6FF}z_{\unicode[STIX]{x1D706}}^{+}$
that is comparable to or less than the time
 $l_{\unicode[STIX]{x1D706}}^{+}/v_{\text{A}}$
for a slice of a
$l_{\unicode[STIX]{x1D706}}^{+}/v_{\text{A}}$
for a slice of a
 $\unicode[STIX]{x1D6FF}z_{\unicode[STIX]{x1D706}}^{-}$
wave packet to pass through a counter-propagating
$\unicode[STIX]{x1D6FF}z_{\unicode[STIX]{x1D706}}^{-}$
wave packet to pass through a counter-propagating
 $\unicode[STIX]{x1D6FF}z_{\unicode[STIX]{x1D706}}^{+}$
wave packet. The cascade time scale for
$\unicode[STIX]{x1D6FF}z_{\unicode[STIX]{x1D706}}^{+}$
wave packet. The cascade time scale for
 $\unicode[STIX]{x1D6FF}z_{\unicode[STIX]{x1D706}}^{-}$
wave packets is therefore
$\unicode[STIX]{x1D6FF}z_{\unicode[STIX]{x1D706}}^{-}$
wave packets is therefore
 $$\begin{eqnarray}\unicode[STIX]{x1D70F}_{\unicode[STIX]{x1D706}}^{-}\sim \frac{\unicode[STIX]{x1D706}}{\unicode[STIX]{x1D6FF}z_{\unicode[STIX]{x1D706}}^{+}}.\end{eqnarray}$$
LGS argued that, since a
 $\unicode[STIX]{x1D6FF}z_{\unicode[STIX]{x1D706}}^{-}$
wave packet cascades after it has propagated along the background magnetic field for a distance
$\unicode[STIX]{x1D6FF}z_{\unicode[STIX]{x1D706}}^{-}$
wave packet cascades after it has propagated along the background magnetic field for a distance
 ${\sim}v_{\text{A}}\unicode[STIX]{x1D70F}_{\unicode[STIX]{x1D706}}^{-}$
, the parallel correlation length of the
${\sim}v_{\text{A}}\unicode[STIX]{x1D70F}_{\unicode[STIX]{x1D706}}^{-}$
, the parallel correlation length of the
 $\unicode[STIX]{x1D6FF}z_{\unicode[STIX]{x1D706}}^{-}$
wave packet is
$\unicode[STIX]{x1D6FF}z_{\unicode[STIX]{x1D706}}^{-}$
wave packet is
 $$\begin{eqnarray}l_{\unicode[STIX]{x1D706}}^{-}\sim v_{\text{A}}\unicode[STIX]{x1D70F}_{\unicode[STIX]{x1D706}}^{-}\sim \frac{v_{\text{A}}\unicode[STIX]{x1D706}}{\unicode[STIX]{x1D6FF}z_{\unicode[STIX]{x1D706}}^{+}}.\end{eqnarray}$$
LGS further argued that, since
 $\unicode[STIX]{x1D6FF}z_{\unicode[STIX]{x1D706}}^{+}$
wave packets separated by a distance
$\unicode[STIX]{x1D6FF}z_{\unicode[STIX]{x1D706}}^{+}$
wave packets separated by a distance
 $l_{\unicode[STIX]{x1D706}}^{-}$
along the magnetic field are sheared by uncorrelated
$l_{\unicode[STIX]{x1D706}}^{-}$
along the magnetic field are sheared by uncorrelated
 $\unicode[STIX]{x1D6FF}z_{\unicode[STIX]{x1D706}}^{-}$
fluctuations,
$\unicode[STIX]{x1D6FF}z_{\unicode[STIX]{x1D706}}^{-}$
fluctuations,
 $$\begin{eqnarray}l_{\unicode[STIX]{x1D706}}^{+}\sim l_{\unicode[STIX]{x1D706}}^{-}.\end{eqnarray}$$
It follows from (5.3), (5.22) and (5.23) that
 $$\begin{eqnarray}\unicode[STIX]{x1D712}_{\unicode[STIX]{x1D706}}^{-}\sim 1\quad \unicode[STIX]{x1D712}_{\unicode[STIX]{x1D706}}^{+}\sim \frac{\unicode[STIX]{x1D6FF}z_{\unicode[STIX]{x1D706}}^{-}}{\unicode[STIX]{x1D6FF}z_{\unicode[STIX]{x1D706}}^{+}}<1.\end{eqnarray}$$
The apparent implication of the second half of (5.24a,b
), particularly when
 $\unicode[STIX]{x1D6FF}z_{\unicode[STIX]{x1D706}}^{-}/\unicode[STIX]{x1D6FF}z_{\unicode[STIX]{x1D706}}^{+}\ll 1$
, is that
$\unicode[STIX]{x1D6FF}z_{\unicode[STIX]{x1D706}}^{-}/\unicode[STIX]{x1D6FF}z_{\unicode[STIX]{x1D706}}^{+}\ll 1$
, is that
 $\unicode[STIX]{x1D6FF}z_{\unicode[STIX]{x1D706}}^{+}$
wave packets cascade in a weakly turbulent manner, through multiple, uncorrelated collisions with
$\unicode[STIX]{x1D6FF}z_{\unicode[STIX]{x1D706}}^{+}$
wave packets cascade in a weakly turbulent manner, through multiple, uncorrelated collisions with
 $\unicode[STIX]{x1D6FF}z_{\unicode[STIX]{x1D706}}^{-}$
wave packets, each of which leads to a small fractional change in the
$\unicode[STIX]{x1D6FF}z_{\unicode[STIX]{x1D706}}^{-}$
wave packets, each of which leads to a small fractional change in the
 $\unicode[STIX]{x1D6FF}z_{\unicode[STIX]{x1D706}}^{+}$
wave packet of order
$\unicode[STIX]{x1D6FF}z_{\unicode[STIX]{x1D706}}^{+}$
wave packet of order
 $\unicode[STIX]{x1D712}_{\unicode[STIX]{x1D706}}^{+}$
(see § 5.1.1). LGS argued, however, that each
$\unicode[STIX]{x1D712}_{\unicode[STIX]{x1D706}}^{+}$
(see § 5.1.1). LGS argued, however, that each
 $\unicode[STIX]{x1D6FF}z_{\unicode[STIX]{x1D706}}^{+}$
wave packet is in fact sheared coherently throughout its lifetime, even when
$\unicode[STIX]{x1D6FF}z_{\unicode[STIX]{x1D706}}^{+}$
wave packet is in fact sheared coherently throughout its lifetime, even when
 $\unicode[STIX]{x1D712}_{\unicode[STIX]{x1D706}}^{+}\sim \unicode[STIX]{x1D6FF}z_{\unicode[STIX]{x1D706}}^{-}/\unicode[STIX]{x1D6FF}z_{\unicode[STIX]{x1D706}}^{+}\ll 1$
. To establish this conclusion, LGS considered the ‘
$\unicode[STIX]{x1D712}_{\unicode[STIX]{x1D706}}^{+}\sim \unicode[STIX]{x1D6FF}z_{\unicode[STIX]{x1D706}}^{-}/\unicode[STIX]{x1D6FF}z_{\unicode[STIX]{x1D706}}^{+}\ll 1$
. To establish this conclusion, LGS considered the ‘
 $\boldsymbol{z}^{+}$
frame’, which moves with
$\boldsymbol{z}^{+}$
frame’, which moves with
 $\boldsymbol{z}^{+}$
fluctuations at speed
$\boldsymbol{z}^{+}$
fluctuations at speed
 $v_{\text{A}}$
along
$v_{\text{A}}$
along
 $\boldsymbol{B}_{0}$
relative to the background plasma. They then proposed a thought experiment in which the amplitude of
$\boldsymbol{B}_{0}$
relative to the background plasma. They then proposed a thought experiment in which the amplitude of
 $\boldsymbol{z}^{-}$
is infinitesimal, so that
$\boldsymbol{z}^{-}$
is infinitesimal, so that
 $\boldsymbol{z}^{-}$
has negligible effect upon
$\boldsymbol{z}^{-}$
has negligible effect upon
 $\boldsymbol{z}^{+}$
. The
$\boldsymbol{z}^{+}$
. The
 $\boldsymbol{z}^{+}$
vector field is then time-independent in the
$\boldsymbol{z}^{+}$
vector field is then time-independent in the
 $\boldsymbol{z}^{+}$
frame. If the
$\boldsymbol{z}^{+}$
frame. If the
 $\boldsymbol{z}^{+}$
fluctuations are initialized with a power-law spectrum spanning the entire inertial range, and if
$\boldsymbol{z}^{+}$
fluctuations are initialized with a power-law spectrum spanning the entire inertial range, and if
 $\boldsymbol{z}^{-}$
fluctuations are continuously injected at the outer scale with an arbitrarily long coherence time
$\boldsymbol{z}^{-}$
fluctuations are continuously injected at the outer scale with an arbitrarily long coherence time
 $T$
in the
$T$
in the
 $\boldsymbol{z}^{+}$
frame, then the
$\boldsymbol{z}^{+}$
frame, then the
 $\boldsymbol{z}^{-}$
fluctuations will cascade to small scales and set up not just a statistical steady state, but an actual steady state in the
$\boldsymbol{z}^{-}$
fluctuations will cascade to small scales and set up not just a statistical steady state, but an actual steady state in the
 $\boldsymbol{z}^{+}$
frame in which the
$\boldsymbol{z}^{+}$
frame in which the
 $\boldsymbol{z}^{-}$
vector field is independent of time. This latter conclusion follows because
$\boldsymbol{z}^{-}$
vector field is independent of time. This latter conclusion follows because
 $\boldsymbol{z}^{-}$
is nonlinearly distorted by
$\boldsymbol{z}^{-}$
is nonlinearly distorted by
 $\boldsymbol{z}^{+}$
, which is constant in time in the
$\boldsymbol{z}^{+}$
, which is constant in time in the
 $\boldsymbol{z}^{+}$
frame. The
$\boldsymbol{z}^{+}$
frame. The
 $\unicode[STIX]{x1D6FF}z_{\unicode[STIX]{x1D706}}^{-}$
fluctuations encountered by a
$\unicode[STIX]{x1D6FF}z_{\unicode[STIX]{x1D706}}^{-}$
fluctuations encountered by a
 $\unicode[STIX]{x1D6FF}z_{\unicode[STIX]{x1D706}}^{+}$
wave packet are therefore coherent for an arbitrarily long time, and in particular for a time much longer than the crossing time
$\unicode[STIX]{x1D6FF}z_{\unicode[STIX]{x1D706}}^{+}$
wave packet are therefore coherent for an arbitrarily long time, and in particular for a time much longer than the crossing time
 $$\begin{eqnarray}t_{\text{cross},\unicode[STIX]{x1D706}}^{+}\sim \frac{l_{\unicode[STIX]{x1D706}}^{-}}{v_{\text{A}}}\end{eqnarray}$$
required for a slice of the
 $\unicode[STIX]{x1D6FF}z_{\unicode[STIX]{x1D706}}^{+}$
wave packet to propagate through a
$\unicode[STIX]{x1D6FF}z_{\unicode[STIX]{x1D706}}^{+}$
wave packet to propagate through a
 $\unicode[STIX]{x1D6FF}z_{\unicode[STIX]{x1D706}}^{-}$
wave packet.
$\unicode[STIX]{x1D6FF}z_{\unicode[STIX]{x1D706}}^{-}$
wave packet.
Building upon this thought experiment, LGS proceeded to consider the more realistic case in which
 $\unicode[STIX]{x1D6FF}z_{\unicode[STIX]{x1D706}}^{-}$
is finite, but still small compared to
$\unicode[STIX]{x1D6FF}z_{\unicode[STIX]{x1D706}}^{-}$
is finite, but still small compared to
 $\unicode[STIX]{x1D6FF}z_{\unicode[STIX]{x1D706}}^{+}$
at all
$\unicode[STIX]{x1D6FF}z_{\unicode[STIX]{x1D706}}^{+}$
at all
 $\unicode[STIX]{x1D706}$
. They made a key assumption, which we call the ‘coherence assumption’, that the coherence time
$\unicode[STIX]{x1D706}$
. They made a key assumption, which we call the ‘coherence assumption’, that the coherence time
 $T$
(at a fixed position in the
$T$
(at a fixed position in the
 $\boldsymbol{z}^{+}$
frame) of the forcing of outer-scale
$\boldsymbol{z}^{+}$
frame) of the forcing of outer-scale
 $\boldsymbol{z}^{-}$
fluctuations is at least as long as the
$\boldsymbol{z}^{-}$
fluctuations is at least as long as the
 $\boldsymbol{z}^{+}$
cascade time at the outer scale, as was the case in the thought experiment above. When the coherence assumption holds, the dominant mechanism for decorrelating the
$\boldsymbol{z}^{+}$
cascade time at the outer scale, as was the case in the thought experiment above. When the coherence assumption holds, the dominant mechanism for decorrelating the
 $\unicode[STIX]{x1D6FF}z_{\unicode[STIX]{x1D706}}^{-}$
fluctuations encountered by a
$\unicode[STIX]{x1D6FF}z_{\unicode[STIX]{x1D706}}^{-}$
fluctuations encountered by a
 $\unicode[STIX]{x1D6FF}z_{\unicode[STIX]{x1D706}}^{+}$
wave packet is the variation of the
$\unicode[STIX]{x1D6FF}z_{\unicode[STIX]{x1D706}}^{+}$
wave packet is the variation of the
 $\boldsymbol{z}^{+}$
vector field, not the crossing of counter-propagating wave packets, and the
$\boldsymbol{z}^{+}$
vector field, not the crossing of counter-propagating wave packets, and the
 $\unicode[STIX]{x1D6FF}z_{\unicode[STIX]{x1D706}}^{+}$
wave packet is sheared coherently throughout its lifetime. The
$\unicode[STIX]{x1D6FF}z_{\unicode[STIX]{x1D706}}^{+}$
wave packet is sheared coherently throughout its lifetime. The
 $\boldsymbol{z}^{+}$
cascade time scale at scale
$\boldsymbol{z}^{+}$
cascade time scale at scale
 $\unicode[STIX]{x1D706}$
then becomes
$\unicode[STIX]{x1D706}$
then becomes
 $$\begin{eqnarray}\unicode[STIX]{x1D70F}_{\unicode[STIX]{x1D706}}^{+}\sim \frac{\unicode[STIX]{x1D706}}{\unicode[STIX]{x1D6FF}z_{\unicode[STIX]{x1D706}}^{-}},\end{eqnarray}$$
and
 $$\begin{eqnarray}\unicode[STIX]{x1D716}^{+}\sim \frac{(\unicode[STIX]{x1D6FF}z_{\unicode[STIX]{x1D706}}^{+})^{2}}{\unicode[STIX]{x1D70F}_{\unicode[STIX]{x1D706}}^{+}}\sim \frac{(\unicode[STIX]{x1D6FF}z_{\unicode[STIX]{x1D706}}^{+})^{2}\unicode[STIX]{x1D6FF}z_{\unicode[STIX]{x1D706}}^{-}}{\unicode[STIX]{x1D706}}.\end{eqnarray}$$
Because of (5.24a,b
),
 $\unicode[STIX]{x1D70F}_{\unicode[STIX]{x1D706}}^{-}\sim \unicode[STIX]{x1D706}/\unicode[STIX]{x1D6FF}z_{\unicode[STIX]{x1D706}}^{+}$
and
$\unicode[STIX]{x1D70F}_{\unicode[STIX]{x1D706}}^{-}\sim \unicode[STIX]{x1D706}/\unicode[STIX]{x1D6FF}z_{\unicode[STIX]{x1D706}}^{+}$
and
 $$\begin{eqnarray}\unicode[STIX]{x1D716}^{-}\sim \frac{(\unicode[STIX]{x1D6FF}z_{\unicode[STIX]{x1D706}}^{-})^{2}}{\unicode[STIX]{x1D70F}_{\unicode[STIX]{x1D706}}^{-}}\sim \frac{(\unicode[STIX]{x1D6FF}z_{\unicode[STIX]{x1D706}}^{-})^{2}\unicode[STIX]{x1D6FF}z_{\unicode[STIX]{x1D706}}^{+}}{\unicode[STIX]{x1D706}}.\end{eqnarray}$$
Setting
 $\unicode[STIX]{x1D716}^{\pm }\propto \unicode[STIX]{x1D706}^{0}$
, LGS combined equations (5.27) and (5.28) to obtain
$\unicode[STIX]{x1D716}^{\pm }\propto \unicode[STIX]{x1D706}^{0}$
, LGS combined equations (5.27) and (5.28) to obtain
 $$\begin{eqnarray}\unicode[STIX]{x1D6FF}z_{\unicode[STIX]{x1D706}}^{+}\propto \unicode[STIX]{x1D6FF}z_{\unicode[STIX]{x1D706}}^{-}\propto \unicode[STIX]{x1D706}^{1/3},\end{eqnarray}$$
which, via (5.8), implies that
 $$\begin{eqnarray}E^{\pm }(k_{\bot })\propto k_{\bot }^{-5/3}.\end{eqnarray}$$
5.3 Anomalous coherence in reflection-driven MHD turbulence
Velli et al. (Reference Velli, Grappin and Mangeney1989) (hereafter VGM) proposed a model of reflection-driven MHD turbulence in which the Elsasser power spectra were isotropic functions of the wavenumber
 $k$
, denoted
$k$
, denoted
 $E^{\pm }(k)$
. They divided the
$E^{\pm }(k)$
. They divided the
 $\boldsymbol{z}^{\pm }$
fluctuations into ‘primary’ and ‘secondary’ components, where the primary components of
$\boldsymbol{z}^{\pm }$
fluctuations into ‘primary’ and ‘secondary’ components, where the primary components of
 $\boldsymbol{z}^{\pm }$
had the usual phase velocities of
$\boldsymbol{z}^{\pm }$
had the usual phase velocities of
 $\boldsymbol{U}\pm \boldsymbol{v}_{\text{A}}$
. The secondary components of
$\boldsymbol{U}\pm \boldsymbol{v}_{\text{A}}$
. The secondary components of
 $\boldsymbol{z}^{\pm }$
were driven modes produced by the reflection of
$\boldsymbol{z}^{\pm }$
were driven modes produced by the reflection of
 $\boldsymbol{z}^{\mp }$
fluctuations and as a consequence had phase velocities of
$\boldsymbol{z}^{\mp }$
fluctuations and as a consequence had phase velocities of
 $\boldsymbol{U}\mp \boldsymbol{v}_{\text{A}}$
. VGM considered the super-Alfvénic solar wind at
$\boldsymbol{U}\mp \boldsymbol{v}_{\text{A}}$
. VGM considered the super-Alfvénic solar wind at
 $r>r_{\text{A}}$
and took
$r>r_{\text{A}}$
and took
 $\boldsymbol{z}^{-}$
to be dominated by secondary fluctuations. VGM estimated the r.m.s. amplitude of the secondary component of
$\boldsymbol{z}^{-}$
to be dominated by secondary fluctuations. VGM estimated the r.m.s. amplitude of the secondary component of
 $\boldsymbol{z}^{-}$
at scale
$\boldsymbol{z}^{-}$
at scale
 $k^{-1}$
, which we denote
$k^{-1}$
, which we denote
 $z_{k,\text{s}}^{-}$
, to be
$z_{k,\text{s}}^{-}$
, to be
 $$\begin{eqnarray}z_{k,\text{s}}^{-}\sim \frac{z_{k,\text{p}}^{+}}{kv_{\text{A}}\unicode[STIX]{x1D70F}_{\text{r}}},\end{eqnarray}$$
where
 $z_{k,\text{p}}^{+}$
is the r.m.s. amplitude of the primary component of
$z_{k,\text{p}}^{+}$
is the r.m.s. amplitude of the primary component of
 $\boldsymbol{z}^{+}$
at scale
$\boldsymbol{z}^{+}$
at scale
 $1/k$
,
$1/k$
,
 $\unicode[STIX]{x1D70F}_{\text{r}}$
is the reflection time scale (which depends only on the radial profile of the background flow),
$\unicode[STIX]{x1D70F}_{\text{r}}$
is the reflection time scale (which depends only on the radial profile of the background flow),
 $z_{k,p}^{+}/\unicode[STIX]{x1D70F}_{\text{r}}$
is the rate at which
$z_{k,p}^{+}/\unicode[STIX]{x1D70F}_{\text{r}}$
is the rate at which
 $z_{k,\text{s}}^{-}$
fluctuations are produced by the reflection of
$z_{k,\text{s}}^{-}$
fluctuations are produced by the reflection of
 $z_{k,\text{p}}^{+}$
fluctuations and
$z_{k,\text{p}}^{+}$
fluctuations and
 $1/(kv_{\text{A}})$
is the time it takes for the secondary
$1/(kv_{\text{A}})$
is the time it takes for the secondary
 $\boldsymbol{z}^{-}$
fluctuations at scale
$\boldsymbol{z}^{-}$
fluctuations at scale
 $1/k$
to propagate out of the primary
$1/k$
to propagate out of the primary
 $\boldsymbol{z}^{+}$
fluctuations that produced them. VGM argued that the secondary
$\boldsymbol{z}^{+}$
fluctuations that produced them. VGM argued that the secondary
 $\boldsymbol{z}^{-}$
fluctuations shear the
$\boldsymbol{z}^{-}$
fluctuations shear the
 $\boldsymbol{z}^{+}$
fluctuations coherently in time, since both fluctuation types have phase velocities of
$\boldsymbol{z}^{+}$
fluctuations coherently in time, since both fluctuation types have phase velocities of
 $\boldsymbol{U}+\boldsymbol{v}_{\text{A}}$
. They then set the
$\boldsymbol{U}+\boldsymbol{v}_{\text{A}}$
. They then set the
 $\boldsymbol{z}^{+}$
cascade power to be
$\boldsymbol{z}^{+}$
cascade power to be
 $$\begin{eqnarray}\unicode[STIX]{x1D716}^{+}\sim kz_{k,\text{s}}^{-}(z_{k,\text{p}}^{+})^{2}\sim \frac{(z_{k,\text{p}}^{+})^{3}}{v_{\text{A}}\unicode[STIX]{x1D70F}_{\text{r}}}\end{eqnarray}$$
and took
 $\unicode[STIX]{x1D716}^{+}$
to be independent of
$\unicode[STIX]{x1D716}^{+}$
to be independent of
 $k$
, obtaining
$k$
, obtaining
 $z_{k,\text{p}}^{+}\propto k^{0}$
. Equations (5.8) and (5.31) then yield
$z_{k,\text{p}}^{+}\propto k^{0}$
. Equations (5.8) and (5.31) then yield
 $$\begin{eqnarray}E^{+}(k)\propto k^{-1}\quad E^{-}(k)\propto k^{-3}.\end{eqnarray}$$
It is useful to compare the VGM model with the LGS model discussed in § 5.2.2. In both models, the
 $\boldsymbol{z}^{-}$
fluctuations are anomalously coherent in the reference frame of the
$\boldsymbol{z}^{-}$
fluctuations are anomalously coherent in the reference frame of the
 $\boldsymbol{z}^{+}$
fluctuations. In the LGS model, this coherence is introduced via the ‘coherence assumption’ discussed in § 5.2.2. VGM argued that this coherence arises because of the physics of AW reflection. A key difference between the models is that VGM neglected the ‘tertiary’ small-scale
$\boldsymbol{z}^{+}$
fluctuations. In the LGS model, this coherence is introduced via the ‘coherence assumption’ discussed in § 5.2.2. VGM argued that this coherence arises because of the physics of AW reflection. A key difference between the models is that VGM neglected the ‘tertiary’ small-scale
 $\boldsymbol{z}^{-}$
fluctuations that are produced as secondary
$\boldsymbol{z}^{-}$
fluctuations that are produced as secondary
 $\boldsymbol{z}^{-}$
fluctuations cascade to small scales. In the LGS model, these tertiary
$\boldsymbol{z}^{-}$
fluctuations cascade to small scales. In the LGS model, these tertiary
 $\boldsymbol{z}^{-}$
fluctuations are anomalously coherent in the
$\boldsymbol{z}^{-}$
fluctuations are anomalously coherent in the
 $\boldsymbol{z}^{+}$
reference frame and drive the Elsasser spectra towards a
$\boldsymbol{z}^{+}$
reference frame and drive the Elsasser spectra towards a
 $k_{\bot }^{-5/3}$
scaling rather than a
$k_{\bot }^{-5/3}$
scaling rather than a
 $k^{-1}$
scaling.
$k^{-1}$
scaling.
5.4 Inverse cascade in reflection-driven MHD turbulence
van Ballegooijen & Asgari-Targhi (Reference van Ballegooijen and Asgari-Targhi2017) carried out direct numerical simulations of reflection-driven MHD turbulence in the solar corona and solar wind using a methodology similar to the one we have employed. Using their simulation data, they computed the rate
 $\unicode[STIX]{x1D716}^{\pm }(k_{\bot },r,t)$
at which nonlinear interactions transfer
$\unicode[STIX]{x1D716}^{\pm }(k_{\bot },r,t)$
at which nonlinear interactions transfer
 $\boldsymbol{z}^{\pm }$
energy from perpendicular wavenumbers less than
$\boldsymbol{z}^{\pm }$
energy from perpendicular wavenumbers less than
 $k_{\bot }$
to perpendicular wavenumbers greater than
$k_{\bot }$
to perpendicular wavenumbers greater than
 $k_{\bot }$
(their equation (17) divided by
$k_{\bot }$
(their equation (17) divided by
 $\unicode[STIX]{x1D70C}$
, with
$\unicode[STIX]{x1D70C}$
, with
 $R\rightarrow L_{\text{box}}/2$
,
$R\rightarrow L_{\text{box}}/2$
,
 $f_{\pm ,k}\rightarrow \unicode[STIX]{x1D719}_{\pm ,k}$
and
$f_{\pm ,k}\rightarrow \unicode[STIX]{x1D719}_{\pm ,k}$
and
 $a\rightarrow k_{\bot }L_{\text{box}}/2$
),
$a\rightarrow k_{\bot }L_{\text{box}}/2$
),
 $$\begin{eqnarray}\unicode[STIX]{x1D716}^{\pm }(k_{\bot },r,t)=\frac{1}{[L_{\text{box}}(r)]^{2}}\mathop{\sum }_{k_{\bot l}>k_{\bot }}\mathop{\sum }_{k_{\bot j}<k_{\bot }}\mathop{\sum }_{k_{\bot i}}M_{lji}(k_{\bot i}^{2}-k_{\bot j}^{2}-k_{\bot l}^{2})\unicode[STIX]{x1D719}_{\pm ,l}\unicode[STIX]{x1D719}_{\pm ,j}\unicode[STIX]{x1D719}_{\mp ,i},\end{eqnarray}$$
where
 $\unicode[STIX]{x1D719}_{\pm k}$
is the Fourier transform (in
$\unicode[STIX]{x1D719}_{\pm k}$
is the Fourier transform (in
 $x$
and
$x$
and
 $y$
) of the Elsasser streamfunction
$y$
) of the Elsasser streamfunction
 $\unicode[STIX]{x1D719}_{\pm }$
(defined such that
$\unicode[STIX]{x1D719}_{\pm }$
(defined such that
 $\boldsymbol{z}^{\pm }=\unicode[STIX]{x1D735}\unicode[STIX]{x1D719}_{\pm }\times \boldsymbol{B}_{0}/B_{0}$
), and
$\boldsymbol{z}^{\pm }=\unicode[STIX]{x1D735}\unicode[STIX]{x1D719}_{\pm }\times \boldsymbol{B}_{0}/B_{0}$
), and
 $M_{lji}$
is a dimensionless mode-coupling coefficient that depends upon
$M_{lji}$
is a dimensionless mode-coupling coefficient that depends upon
 $k_{\bot l}$
,
$k_{\bot l}$
,
 $k_{\bot j}$
and
$k_{\bot j}$
and
 $k_{\bot i}$
, but not upon the mode amplitudes. They found that
$k_{\bot i}$
, but not upon the mode amplitudes. They found that
 $\unicode[STIX]{x1D716}^{+}(k_{\bot },r,t)$
became negative across a broad range of
$\unicode[STIX]{x1D716}^{+}(k_{\bot },r,t)$
became negative across a broad range of
 $k_{\bot }$
within a modest range of radii just larger than the radius (or radii) at which
$k_{\bot }$
within a modest range of radii just larger than the radius (or radii) at which
 $\text{d}v_{\text{A}}/\text{d}r$
changes signs – e.g. just beyond the Alfvén-speed maximum at
$\text{d}v_{\text{A}}/\text{d}r$
changes signs – e.g. just beyond the Alfvén-speed maximum at
 $r=r_{\text{m}}$
in the subset of their simulations in which the background density was smooth.
$r=r_{\text{m}}$
in the subset of their simulations in which the background density was smooth.
To explain their findings, they considered two locations, one just inside the
 $r=r_{\text{m}}$
surface at
$r=r_{\text{m}}$
surface at
 $r=r_{1}$
and one just outside the
$r=r_{1}$
and one just outside the
 $r=r_{\text{m}}$
surface at
$r=r_{\text{m}}$
surface at
 $r=r_{2}$
, such that
$r=r_{2}$
, such that
 $|\text{d}v_{\text{A}}/\text{d}r|$
was the same at the two radii. They noted that, because
$|\text{d}v_{\text{A}}/\text{d}r|$
was the same at the two radii. They noted that, because
 $z_{\text{rms}}^{+}\gg z_{\text{rms}}^{-}$
,
$z_{\text{rms}}^{+}\gg z_{\text{rms}}^{-}$
,
 $\boldsymbol{z}^{-}$
fluctuations cascade much more rapidly than
$\boldsymbol{z}^{-}$
fluctuations cascade much more rapidly than
 $\boldsymbol{z}^{+}$
fluctuations. There thus exists a range of values of
$\boldsymbol{z}^{+}$
fluctuations. There thus exists a range of values of
 $r_{2}-r_{1}$
for which the time
$r_{2}-r_{1}$
for which the time
 $\unicode[STIX]{x0394}t_{12}$
required for
$\unicode[STIX]{x0394}t_{12}$
required for
 $\boldsymbol{z}^{+}$
fluctuations to propagate from
$\boldsymbol{z}^{+}$
fluctuations to propagate from
 $r_{1}$
to
$r_{1}$
to
 $r_{2}$
is small compared to the outer-scale
$r_{2}$
is small compared to the outer-scale
 $\boldsymbol{z}^{+}$
cascade time scale but large compared to the outer-scale
$\boldsymbol{z}^{+}$
cascade time scale but large compared to the outer-scale
 $\boldsymbol{z}^{-}$
cascade time scale. For values of
$\boldsymbol{z}^{-}$
cascade time scale. For values of
 $r_{2}-r_{1}$
in this range,
$r_{2}-r_{1}$
in this range,
 $$\begin{eqnarray}\displaystyle \unicode[STIX]{x1D719}_{+,k}(r_{2},t) & \simeq & \displaystyle \unicode[STIX]{x1D719}_{+,k}(r_{1},t-\unicode[STIX]{x0394}t_{12})\end{eqnarray}$$
 $$\begin{eqnarray}\displaystyle \unicode[STIX]{x1D719}_{-,k}(r_{2},t) & \simeq & \displaystyle -\unicode[STIX]{x1D719}_{-,k}(r_{1},t-\unicode[STIX]{x0394}t_{12}),\end{eqnarray}$$
where
 $\unicode[STIX]{x0394}t_{12}$
is the
$\unicode[STIX]{x0394}t_{12}$
is the
 $\boldsymbol{z}^{+}$
propagation time between
$\boldsymbol{z}^{+}$
propagation time between
 $r_{1}$
and
$r_{1}$
and
 $r_{2}$
. Equation (5.35) holds because nonlinear interactions do not have enough time to substantially alter the
$r_{2}$
. Equation (5.35) holds because nonlinear interactions do not have enough time to substantially alter the
 $\boldsymbol{z}^{+}$
fluctuations during their transit from
$\boldsymbol{z}^{+}$
fluctuations during their transit from
 $r_{1}$
to
$r_{1}$
to
 $r_{2}$
. Equation (5.36) follows from the change in sign of
$r_{2}$
. Equation (5.36) follows from the change in sign of
 $\text{d}v_{\text{A}}/\text{d}r$
at
$\text{d}v_{\text{A}}/\text{d}r$
at
 $r=r_{\text{m}}$
.Footnote
8
Because
$r=r_{\text{m}}$
.Footnote
8
Because
 $\unicode[STIX]{x1D719}_{-,k}$
changes sign and
$\unicode[STIX]{x1D719}_{-,k}$
changes sign and
 $\unicode[STIX]{x1D719}_{+,k}$
remains almost unchanged,
$\unicode[STIX]{x1D719}_{+,k}$
remains almost unchanged,
 $\unicode[STIX]{x1D716}^{+}$
in (5.34) changes sign between
$\unicode[STIX]{x1D716}^{+}$
in (5.34) changes sign between
 $r_{1}$
and
$r_{1}$
and
 $r_{2}$
. Between the coronal base and the Alfvén-speed maximum, nonlinear interactions set up the usual direct cascade of energy from large scales to small scales, causing
$r_{2}$
. Between the coronal base and the Alfvén-speed maximum, nonlinear interactions set up the usual direct cascade of energy from large scales to small scales, causing
 $\unicode[STIX]{x1D716}^{+}$
to be positive at
$\unicode[STIX]{x1D716}^{+}$
to be positive at
 $r_{1}$
. At
$r_{1}$
. At
 $r_{2}$
,
$r_{2}$
,
 $\unicode[STIX]{x1D716}^{+}$
thus becomes negative, indicating an inverse cascade.
$\unicode[STIX]{x1D716}^{+}$
thus becomes negative, indicating an inverse cascade.
van Ballegooijen & Asgari-Targhi (Reference van Ballegooijen and Asgari-Targhi2017) found that as the
 $\boldsymbol{z}^{+}$
fluctuations propagate farther beyond
$\boldsymbol{z}^{+}$
fluctuations propagate farther beyond
 $r=r_{\text{m}}$
, they gradually adjust to the new value of
$r=r_{\text{m}}$
, they gradually adjust to the new value of
 $\boldsymbol{z}^{-}$
, and the direct cascade of energy from large scales to small scales resumes. This transition back to a direct cascade occurs first at large
$\boldsymbol{z}^{-}$
, and the direct cascade of energy from large scales to small scales resumes. This transition back to a direct cascade occurs first at large
 $k_{\bot }$
(at which the nonlinear time is short) and later at small
$k_{\bot }$
(at which the nonlinear time is short) and later at small
 $k_{\bot }$
. In one of their simulations, there is an inverse cascade of
$k_{\bot }$
. In one of their simulations, there is an inverse cascade of
 $\boldsymbol{z}^{+}$
energy throughout the region between the Alfvén-speed maximum at
$\boldsymbol{z}^{+}$
energy throughout the region between the Alfvén-speed maximum at
 $1.4R_{\odot }$
and an outer radius of
$1.4R_{\odot }$
and an outer radius of
 $r=2.5R_{\odot }$
. In a second simulation, there is an inverse cascade between the Alfvén-speed maximum at
$r=2.5R_{\odot }$
. In a second simulation, there is an inverse cascade between the Alfvén-speed maximum at
 $1.6R_{\odot }$
and an outer radius of
$1.6R_{\odot }$
and an outer radius of
 $4R_{\odot }$
. Since the outer-scale
$4R_{\odot }$
. Since the outer-scale
 $\boldsymbol{z}^{+}$
cascade time is comparable to the time required for
$\boldsymbol{z}^{+}$
cascade time is comparable to the time required for
 $v_{\text{A}}$
to change by a factor of 2 in the
$v_{\text{A}}$
to change by a factor of 2 in the
 $\boldsymbol{z}^{+}$
reference frame (Dmitruk et al.
Reference Dmitruk, Matthaeus, Milano, Oughton, Zank and Mullan2002; Chandran & Hollweg Reference Chandran and Hollweg2009), the above results indicate that the inverse cascade persists (in the
$\boldsymbol{z}^{+}$
reference frame (Dmitruk et al.
Reference Dmitruk, Matthaeus, Milano, Oughton, Zank and Mullan2002; Chandran & Hollweg Reference Chandran and Hollweg2009), the above results indicate that the inverse cascade persists (in the
 $\boldsymbol{z}^{+}$
reference frame) for a time comparable to the outer-scale
$\boldsymbol{z}^{+}$
reference frame) for a time comparable to the outer-scale
 $\boldsymbol{z}^{+}$
energy-cascade time scale.
$\boldsymbol{z}^{+}$
energy-cascade time scale.
Although
 $\unicode[STIX]{x1D716}^{+}$
became negative between
$\unicode[STIX]{x1D716}^{+}$
became negative between
 $r\simeq r_{\text{m}}$
and
$r\simeq r_{\text{m}}$
and
 $r\simeq 2r_{\text{m}}$
in the numerical simulations of van Ballegooijen & Asgari-Targhi (Reference van Ballegooijen and Asgari-Targhi2017), the energy-dissipation rate (computed from the dissipation terms added to the governing equations) decreased by only a factor of
$r\simeq 2r_{\text{m}}$
in the numerical simulations of van Ballegooijen & Asgari-Targhi (Reference van Ballegooijen and Asgari-Targhi2017), the energy-dissipation rate (computed from the dissipation terms added to the governing equations) decreased by only a factor of
 $\simeq 2$
within the inverse-cascade region. The reason for this is that the direct-cascade region at
$\simeq 2$
within the inverse-cascade region. The reason for this is that the direct-cascade region at
 $r<r_{\text{m}}$
had already ‘done the work’ of transporting
$r<r_{\text{m}}$
had already ‘done the work’ of transporting
 $\boldsymbol{z}^{+}$
energy to large
$\boldsymbol{z}^{+}$
energy to large
 $k_{\bot }$
, and the inverse cascade between
$k_{\bot }$
, and the inverse cascade between
 $r\simeq r_{\text{m}}$
and
$r\simeq r_{\text{m}}$
and
 $r\simeq 2r_{\text{m}}$
was unable to completely evacuate the high-
$r\simeq 2r_{\text{m}}$
was unable to completely evacuate the high-
 $k_{\bot }$
part of the spectrum.
$k_{\bot }$
part of the spectrum.
6 The Elsasser power spectra in our numerical simulations
In our numerical simulations,
 $\unicode[STIX]{x1D6FC}^{+}$
and
$\unicode[STIX]{x1D6FC}^{+}$
and
 $\unicode[STIX]{x1D6FC}^{-}$
approach
$\unicode[STIX]{x1D6FC}^{-}$
approach
 $\simeq 3/2$
as
$\simeq 3/2$
as
 $r$
increases to values
$r$
increases to values
 ${\gtrsim}r_{\text{A}}$
, as illustrated in figure 7. These spectral indices are broadly consistent with the LGS model of strong imbalanced turbulence. As discussed in § 5.2.2, the central assumption of the LGS model is the ‘coherence assumption’ – that outer-scale
${\gtrsim}r_{\text{A}}$
, as illustrated in figure 7. These spectral indices are broadly consistent with the LGS model of strong imbalanced turbulence. As discussed in § 5.2.2, the central assumption of the LGS model is the ‘coherence assumption’ – that outer-scale
 $\boldsymbol{z}^{-}$
fluctuations are injected in a manner that remains coherent over the lifetime of the outer-scale
$\boldsymbol{z}^{-}$
fluctuations are injected in a manner that remains coherent over the lifetime of the outer-scale
 $\boldsymbol{z}^{+}$
fluctuations when viewed in the ‘
$\boldsymbol{z}^{+}$
fluctuations when viewed in the ‘
 $\boldsymbol{z}^{+}$
reference frame’, which moves along
$\boldsymbol{z}^{+}$
reference frame’, which moves along
 $\boldsymbol{B}_{0}$
at the same velocity (
$\boldsymbol{B}_{0}$
at the same velocity (
 $\boldsymbol{U}+\boldsymbol{v}_{\text{A}}$
) as the
$\boldsymbol{U}+\boldsymbol{v}_{\text{A}}$
) as the
 $\boldsymbol{z}^{+}$
fluctuations. It is difficult, at least for us, to justify this assumption with any generality for homogeneous RMHD turbulence. However, the coherence assumption is often satisfied in reflection-driven MHD turbulence, because the outer-scale
$\boldsymbol{z}^{+}$
fluctuations. It is difficult, at least for us, to justify this assumption with any generality for homogeneous RMHD turbulence. However, the coherence assumption is often satisfied in reflection-driven MHD turbulence, because the outer-scale
 $\boldsymbol{z}^{-}$
fluctuations are produced by the reflection of outer-scale
$\boldsymbol{z}^{-}$
fluctuations are produced by the reflection of outer-scale
 $\boldsymbol{z}^{+}$
fluctuations, and by definition these
$\boldsymbol{z}^{+}$
fluctuations, and by definition these
 $\boldsymbol{z}^{+}$
fluctuations remain coherent in the
$\boldsymbol{z}^{+}$
fluctuations remain coherent in the
 $\boldsymbol{z}^{+}$
reference frame throughout their lifetimes. A second requirement of the LGS model is that
$\boldsymbol{z}^{+}$
reference frame throughout their lifetimes. A second requirement of the LGS model is that
 $\unicode[STIX]{x1D712}_{\unicode[STIX]{x1D706}}^{-}\gtrsim 1$
. This requirement is marginally satisfied at
$\unicode[STIX]{x1D712}_{\unicode[STIX]{x1D706}}^{-}\gtrsim 1$
. This requirement is marginally satisfied at
 $r\gtrsim r_{\text{A}}$
in all three simulations, as we will document in greater detail in a separate publication. The LGS model thus provides a credible explanation for the Elsasser power spectra at
$r\gtrsim r_{\text{A}}$
in all three simulations, as we will document in greater detail in a separate publication. The LGS model thus provides a credible explanation for the Elsasser power spectra at
 $r\gtrsim r_{\text{A}}$
in Runs 1 through 3. The discrepancy between the predicted
$r\gtrsim r_{\text{A}}$
in Runs 1 through 3. The discrepancy between the predicted
 $\unicode[STIX]{x1D6FC}^{\pm }=5/3$
scaling and the measured
$\unicode[STIX]{x1D6FC}^{\pm }=5/3$
scaling and the measured
 $\unicode[STIX]{x1D6FC}^{\pm }\simeq 3/2$
scaling may result from some combination of intermittency and scale-dependent dynamic alignment, as in homogeneous RMHD turbulence (see § 5.1.2).
$\unicode[STIX]{x1D6FC}^{\pm }\simeq 3/2$
scaling may result from some combination of intermittency and scale-dependent dynamic alignment, as in homogeneous RMHD turbulence (see § 5.1.2).
As discussed in § 3.10 (see also Velli Reference Velli1993; Réville et al.
Reference Réville, Tenerani and Velli2018), the steep Alfvén-speed gradient in the upper chromosphere acts as a high-pass filter. High-
 $k_{\bot }$
 $\boldsymbol{z}^{+}$
fluctuations, which have large nonlinear frequencies and hence large linear frequencies (Goldreich & Sridhar Reference Goldreich and Sridhar1995), can propagate through this region with minimal reflection. In contrast, low-
$\boldsymbol{z}^{+}$
fluctuations, which have large nonlinear frequencies and hence large linear frequencies (Goldreich & Sridhar Reference Goldreich and Sridhar1995), can propagate through this region with minimal reflection. In contrast, low-
 $k_{\bot }$
 $\boldsymbol{z}^{+}$
fluctuations undergo strong non-WKB reflection as they propagate from the lower chromosphere to the transition region. This selective transmission accounts for the very small value of
$\boldsymbol{z}^{+}$
fluctuations undergo strong non-WKB reflection as they propagate from the lower chromosphere to the transition region. This selective transmission accounts for the very small value of
 $\unicode[STIX]{x1D6FC}^{+}$
just above the transition region in Runs 1 and 2. The
$\unicode[STIX]{x1D6FC}^{+}$
just above the transition region in Runs 1 and 2. The
 $\boldsymbol{z}^{+}$
spectrum in Run 3 does not flatten in the same way, presumably because the nonlinear time scale is larger than in Runs 1 and 2 because of the larger value of
$\boldsymbol{z}^{+}$
spectrum in Run 3 does not flatten in the same way, presumably because the nonlinear time scale is larger than in Runs 1 and 2 because of the larger value of
 $L_{\bot }$
, causing all the
$L_{\bot }$
, causing all the
 $\boldsymbol{z}^{+}$
fluctuations in Run 3 to undergo significant reflection in the upper chromosphere.
$\boldsymbol{z}^{+}$
fluctuations in Run 3 to undergo significant reflection in the upper chromosphere.
As discussed in § 5.4, van Ballegooijen & Asgari-Targhi (Reference van Ballegooijen and Asgari-Targhi2017) showed that the
 $\boldsymbol{z}^{+}$
fluctuations undergo a transient inverse cascade at
$\boldsymbol{z}^{+}$
fluctuations undergo a transient inverse cascade at
 $r_{\text{m}}\lesssim r\lesssim 2r_{\text{m}}$
, where
$r_{\text{m}}\lesssim r\lesssim 2r_{\text{m}}$
, where
 $r_{\text{m}}$
is the location of the Alfvén-speed maximum (
$r_{\text{m}}$
is the location of the Alfvén-speed maximum (
 $1.71R_{\odot }$
in our simulations). This inverse cascade results from the change in sign of
$1.71R_{\odot }$
in our simulations). This inverse cascade results from the change in sign of
 $\text{d}v_{\text{A}}/\text{d}r$
at
$\text{d}v_{\text{A}}/\text{d}r$
at
 $r=r_{\text{m}}$
, which reverses the direction of the fast-cascading
$r=r_{\text{m}}$
, which reverses the direction of the fast-cascading
 $\boldsymbol{z}^{-}$
fluctuations, which in turn reverses the sign of
$\boldsymbol{z}^{-}$
fluctuations, which in turn reverses the sign of
 $\unicode[STIX]{x1D716}^{+}$
in (5.34). The tendency for
$\unicode[STIX]{x1D716}^{+}$
in (5.34). The tendency for
 $\boldsymbol{z}^{-}$
fluctuations to reverse direction at
$\boldsymbol{z}^{-}$
fluctuations to reverse direction at
 $r=r_{\text{m}}$
destroys the anomalous coherence of the
$r=r_{\text{m}}$
destroys the anomalous coherence of the
 $\boldsymbol{z}^{-}$
fluctuations in the
$\boldsymbol{z}^{-}$
fluctuations in the
 $\boldsymbol{z}^{+}$
reference frame near
$\boldsymbol{z}^{+}$
reference frame near
 $r=r_{\text{m}}$
, making the LGS model inapplicable. We do not have a detailed theory for how the spectra should scale between
$r=r_{\text{m}}$
, making the LGS model inapplicable. We do not have a detailed theory for how the spectra should scale between
 $r=r_{\text{m}}$
and
$r=r_{\text{m}}$
and
 $r=2r_{\text{m}}$
in the presence of this inverse cascade, but the simulation results indicates that the
$r=2r_{\text{m}}$
in the presence of this inverse cascade, but the simulation results indicates that the
 $\boldsymbol{z}^{+}$
spectrum flattens significantly in this region relative to the LGS prediction.
$\boldsymbol{z}^{+}$
spectrum flattens significantly in this region relative to the LGS prediction.
7 Other parameter regimes and lack of universality
One of the principal sources of uncertainty in modelling MHD turbulence in the solar-wind acceleration region concerns the dominant length scales and time scales of the AWs launched by the Sun. For the correlation lengths and correlation times that we have considered in this work, the two-component analytic model developed in § 4 reasonably approximates our simulation results, and the Elsasser power spectra in our simulations evolve, at least approximately, towards the scalings of the LGS model at
 $r\gtrsim r_{\text{A}}$
. However, we have also carried out another simulation with higher-frequency photospheric forcing and the same perpendicular correlation length as in Run 3. This additional simulation is not well described by either our two-component model or the LGS model. For example, at very large
$r\gtrsim r_{\text{A}}$
. However, we have also carried out another simulation with higher-frequency photospheric forcing and the same perpendicular correlation length as in Run 3. This additional simulation is not well described by either our two-component model or the LGS model. For example, at very large
 $r$
, the
$r$
, the
 $z^{+}$
power spectrum evolves towards a
$z^{+}$
power spectrum evolves towards a
 $k_{\bot }^{-1}$
scaling, albeit at radii for which
$k_{\bot }^{-1}$
scaling, albeit at radii for which
 $\unicode[STIX]{x1D6FF}B\simeq B_{0}$
. We will describe this simulation in more detail in a future publication, but we mention it now to caution the reader that the picture we have developed in this paper does not apply universally for all combinations of correlation times and correlation lengths at the photosphere.
$\unicode[STIX]{x1D6FF}B\simeq B_{0}$
. We will describe this simulation in more detail in a future publication, but we mention it now to caution the reader that the picture we have developed in this paper does not apply universally for all combinations of correlation times and correlation lengths at the photosphere.
8 Phase mixing
By focusing on transverse, non-compressive fluctuations and neglecting density fluctuations, we neglect ‘phase mixing’ (Heyvaerts & Priest Reference Heyvaerts and Priest1983), by which we mean the process in which an initially planar AW phase front becomes corrugated as it propagates through a medium in which
 $v_{\text{A}}$
(or
$v_{\text{A}}$
(or
 $U$
) varies across the magnetic field. This corrugation corresponds to a transfer of fluctuation energy to larger
$U$
) varies across the magnetic field. This corrugation corresponds to a transfer of fluctuation energy to larger
 $k_{\bot }$
. Phase mixing could provide the additional heating that seems to be needed (see figure 6) to power the fast solar wind at
$k_{\bot }$
. Phase mixing could provide the additional heating that seems to be needed (see figure 6) to power the fast solar wind at
 $r\lesssim 1.3R_{\odot }$
over and above the heating provided by reflection-driven MHD turbulence. Observations of comet Lovejoy show that the density varies by a factor of
$r\lesssim 1.3R_{\odot }$
over and above the heating provided by reflection-driven MHD turbulence. Observations of comet Lovejoy show that the density varies by a factor of
 ${\sim}6$
over distances of a few thousand km perpendicular to
${\sim}6$
over distances of a few thousand km perpendicular to
 $\boldsymbol{B}_{0}$
at
$\boldsymbol{B}_{0}$
at
 $r=1.3R_{\odot }$
in both closed-field regions and open-field regions (Raymond et al.
Reference Raymond, McCauley, Cranmer and Downs2014). On the other hand, Helios radio occultation data indicate that the fractional density variations are
$r=1.3R_{\odot }$
in both closed-field regions and open-field regions (Raymond et al.
Reference Raymond, McCauley, Cranmer and Downs2014). On the other hand, Helios radio occultation data indicate that the fractional density variations are
 $\simeq 0.1-0.2$
at
$\simeq 0.1-0.2$
at
 $5R_{\odot }<r<20R_{\odot }$
(Hollweg et al.
Reference Hollweg, Cranmer and Chandran2010). We conjecture that the transition from large
$5R_{\odot }<r<20R_{\odot }$
(Hollweg et al.
Reference Hollweg, Cranmer and Chandran2010). We conjecture that the transition from large
 $\unicode[STIX]{x1D6FF}n/n_{0}$
at
$\unicode[STIX]{x1D6FF}n/n_{0}$
at
 $r\simeq 1.3R_{\odot }$
to small
$r\simeq 1.3R_{\odot }$
to small
 $\unicode[STIX]{x1D6FF}n/n_{0}$
at
$\unicode[STIX]{x1D6FF}n/n_{0}$
at
 $r\gtrsim 5R_{\odot }$
results from mixing of density fluctuations by the non-compressive component of the turbulence, which acts to reduce
$r\gtrsim 5R_{\odot }$
results from mixing of density fluctuations by the non-compressive component of the turbulence, which acts to reduce
 $\unicode[STIX]{x1D6FF}n/n_{0}$
as plasma flows away from the Sun. The limited radial extent of the large-
$\unicode[STIX]{x1D6FF}n/n_{0}$
as plasma flows away from the Sun. The limited radial extent of the large-
 $\unicode[STIX]{x1D6FF}n/n_{0}$
region suggests that most of the phase mixing occurs close to the Sun. Moreover, since phase mixing is more effective for AWs with larger parallel wavenumbers and frequencies, phase mixing at
$\unicode[STIX]{x1D6FF}n/n_{0}$
region suggests that most of the phase mixing occurs close to the Sun. Moreover, since phase mixing is more effective for AWs with larger parallel wavenumbers and frequencies, phase mixing at
 $r\lesssim 5R_{\odot }$
may act as a low-pass filter, by preferentially removing high-frequency AW fluctuation energy. Future investigations of reflection-driven MHD turbulence that account for phase mixing will be important for developing a more complete understanding of solar-wind turbulence and its role in the origin of the solar wind.
$r\lesssim 5R_{\odot }$
may act as a low-pass filter, by preferentially removing high-frequency AW fluctuation energy. Future investigations of reflection-driven MHD turbulence that account for phase mixing will be important for developing a more complete understanding of solar-wind turbulence and its role in the origin of the solar wind.
9 Conclusion
We have carried out three direct numerical simulations of reflection-driven MHD turbulence within a narrow magnetic flux tube that extends from the photosphere, through the chromosphere, through a coronal hole and out to a maximum heliocentric distance of
 $21R_{\odot }$
. Our simulations assume fixed, observationally motivated profiles for
$21R_{\odot }$
. Our simulations assume fixed, observationally motivated profiles for
 $\unicode[STIX]{x1D70C}$
,
$\unicode[STIX]{x1D70C}$
,
 $U$
and
$U$
and
 $B_{0}$
and solve only for the non-compressive, transverse components of the fluctuating magnetic field and velocity. In each simulation, the turbulence is driven by an imposed, randomly evolving, photospheric velocity field that has a single characteristic time scale and length scale. Because outward-propagating AWs undergo strong reflection at the transition region, there is an approximately equal mix of
$B_{0}$
and solve only for the non-compressive, transverse components of the fluctuating magnetic field and velocity. In each simulation, the turbulence is driven by an imposed, randomly evolving, photospheric velocity field that has a single characteristic time scale and length scale. Because outward-propagating AWs undergo strong reflection at the transition region, there is an approximately equal mix of
 $\boldsymbol{z}^{+}$
and
$\boldsymbol{z}^{+}$
and
 $\boldsymbol{z}^{-}$
fluctuations in the chromosphere, and vigorous turbulence develops within the chromosphere (van Ballegooijen et al.
Reference van Ballegooijen, Asgari-Targhi, Cranmer and DeLuca2011). As a result, the waves that escape into the corona have a broad spectrum of wavenumbers and frequencies. In the corona and solar wind, outward-propagating
$\boldsymbol{z}^{-}$
fluctuations in the chromosphere, and vigorous turbulence develops within the chromosphere (van Ballegooijen et al.
Reference van Ballegooijen, Asgari-Targhi, Cranmer and DeLuca2011). As a result, the waves that escape into the corona have a broad spectrum of wavenumbers and frequencies. In the corona and solar wind, outward-propagating
 $\boldsymbol{z}^{+}$
fluctuations undergo partial non-WKB reflection, thereby generating inward-propagating
$\boldsymbol{z}^{+}$
fluctuations undergo partial non-WKB reflection, thereby generating inward-propagating
 $\boldsymbol{z}^{-}$
fluctuations, but
$\boldsymbol{z}^{-}$
fluctuations, but
 $z_{\text{rms}}^{+}\gg z_{\text{rms}}^{-}$
.
$z_{\text{rms}}^{+}\gg z_{\text{rms}}^{-}$
.
In order to explain the radial profiles of
 $z_{\text{rms}}^{\pm }$
and the turbulent-heating rate in our simulations, we have developed an analytic model of reflection-driven MHD turbulence that relies on the following conjectures: (i) the Sun launches two populations of
$z_{\text{rms}}^{\pm }$
and the turbulent-heating rate in our simulations, we have developed an analytic model of reflection-driven MHD turbulence that relies on the following conjectures: (i) the Sun launches two populations of
 $\boldsymbol{z}^{+}$
fluctuations into the corona, a short-radial-correlation-length (HF) population and a long-radial-correlation-length (LF) population; (ii) non-WKB reflection of LF
$\boldsymbol{z}^{+}$
fluctuations into the corona, a short-radial-correlation-length (HF) population and a long-radial-correlation-length (LF) population; (ii) non-WKB reflection of LF
 $\boldsymbol{z}^{+}$
fluctuations is the dominant source of
$\boldsymbol{z}^{+}$
fluctuations is the dominant source of
 $\boldsymbol{z}^{-}$
fluctuations; (iii) LF
$\boldsymbol{z}^{-}$
fluctuations; (iii) LF
 $\boldsymbol{z}^{+}$
fluctuations become aligned with
$\boldsymbol{z}^{+}$
fluctuations become aligned with
 $\boldsymbol{z}^{-}$
at
$\boldsymbol{z}^{-}$
at
 $r>r_{\text{m}}$
, where
$r>r_{\text{m}}$
, where
 $r_{\text{m}}$
is defined in (3.12), causing LF
$r_{\text{m}}$
is defined in (3.12), causing LF
 $\boldsymbol{z}^{+}$
fluctuations to cascade and dissipate more slowly than HF
$\boldsymbol{z}^{+}$
fluctuations to cascade and dissipate more slowly than HF
 $\boldsymbol{z}^{+}$
fluctuations; (iv) the change in sign of
$\boldsymbol{z}^{+}$
fluctuations; (iv) the change in sign of
 $\text{d}v_{\text{A}}/\text{d}r$
at
$\text{d}v_{\text{A}}/\text{d}r$
at
 $r=r_{\text{m}}$
leads to a reduction in
$r=r_{\text{m}}$
leads to a reduction in
 $z_{\text{rms}}^{-}$
at
$z_{\text{rms}}^{-}$
at
 $r<r_{\text{m}}$
; and (v)
$r<r_{\text{m}}$
; and (v)
 $\boldsymbol{z}^{-}$
fluctuations are anomalously coherent in a reference frame that moves outward with the
$\boldsymbol{z}^{-}$
fluctuations are anomalously coherent in a reference frame that moves outward with the
 $\boldsymbol{z}^{+}$
fluctuations, because the
$\boldsymbol{z}^{+}$
fluctuations, because the
 $\boldsymbol{z}^{-}$
fluctuations are produced by the outward-propagating
$\boldsymbol{z}^{-}$
fluctuations are produced by the outward-propagating
 $\boldsymbol{z}^{+}$
fluctuations via non-WKB reflection (Velli et al.
Reference Velli, Grappin and Mangeney1989; Verdini et al.
Reference Verdini, Velli and Buchlin2009).
$\boldsymbol{z}^{+}$
fluctuations via non-WKB reflection (Velli et al.
Reference Velli, Grappin and Mangeney1989; Verdini et al.
Reference Verdini, Velli and Buchlin2009).
To compare our analytic model and numerical results, we determine the inner boundary conditions in our model by setting the quantities listed in the left column of table 3 equal to their measured or inferred values at the coronal base in our simulations. We then vary the five free parameters in our model (see table 4) to maximize the agreement between the model and simulations, using a single set of free-parameter values to match all three simulations. The resulting best-fit profiles of
 $z_{\text{rms}}^{\pm }$
and
$z_{\text{rms}}^{\pm }$
and
 $Q$
in our model agree reasonably well with our numerical results. The turbulent heating rate in our simulations is also comparable to the turbulent heating rate in the solar-wind model of Chandran et al. (Reference Chandran, Dennis, Quataert and Bale2011) at
$Q$
in our model agree reasonably well with our numerical results. The turbulent heating rate in our simulations is also comparable to the turbulent heating rate in the solar-wind model of Chandran et al. (Reference Chandran, Dennis, Quataert and Bale2011) at
 $r\gtrsim 1.3R_{\odot }$
, which agreed with a number of observational constraints. This suggests that MHD turbulence can account for much of the heating that occurs in the fast solar wind.
$r\gtrsim 1.3R_{\odot }$
, which agreed with a number of observational constraints. This suggests that MHD turbulence can account for much of the heating that occurs in the fast solar wind.
The inertial-range Elsasser power spectra in our simulations vary with radius. In the lower chromosphere, the spectral indices
 $\unicode[STIX]{x1D6FC}^{+}$
and
$\unicode[STIX]{x1D6FC}^{+}$
and
 $\unicode[STIX]{x1D6FC}^{-}$
(defined in (3.35)) are
$\unicode[STIX]{x1D6FC}^{-}$
(defined in (3.35)) are
 $\simeq 3/2$
, consistent with theories of balanced RMHD turbulence (§ 5.1). In Runs 1 and 2,
$\simeq 3/2$
, consistent with theories of balanced RMHD turbulence (§ 5.1). In Runs 1 and 2,
 $\unicode[STIX]{x1D6FC}^{+}$
drops with increasing
$\unicode[STIX]{x1D6FC}^{+}$
drops with increasing
 $r$
in the upper chromosphere, reaching values less than 1 just above the transition region. We attribute this spectral flattening to the steep Alfvén-speed gradient in the upper chromosphere, which acts as a high-pass filter (Velli Reference Velli1993; Réville et al.
Reference Réville, Tenerani and Velli2018), as discussed in § 3.10. Much farther from the Sun, at
$r$
in the upper chromosphere, reaching values less than 1 just above the transition region. We attribute this spectral flattening to the steep Alfvén-speed gradient in the upper chromosphere, which acts as a high-pass filter (Velli Reference Velli1993; Réville et al.
Reference Réville, Tenerani and Velli2018), as discussed in § 3.10. Much farther from the Sun, at
 $r\gtrsim 10R_{\odot }$
,
$r\gtrsim 10R_{\odot }$
,
 $\unicode[STIX]{x1D6FC}^{+}$
and
$\unicode[STIX]{x1D6FC}^{+}$
and
 $\unicode[STIX]{x1D6FC}^{-}$
are reasonably close to
$\unicode[STIX]{x1D6FC}^{-}$
are reasonably close to
 $3/2$
in all three runs, in approximate agreement with the LGS model of strong imbalanced turbulence, which is reviewed in § 5.2.2. However, at smaller radii, between
$3/2$
in all three runs, in approximate agreement with the LGS model of strong imbalanced turbulence, which is reviewed in § 5.2.2. However, at smaller radii, between
 $r\simeq r_{\text{m}}=1.7R_{\odot }$
and
$r\simeq r_{\text{m}}=1.7R_{\odot }$
and
 $r\simeq 2r_{\text{m}}$
,
$r\simeq 2r_{\text{m}}$
,
 $\unicode[STIX]{x1D6FC}^{+}$
hovers near unity in Runs 1 and 2. We attribute this latter behaviour to a disruption of the anomalous coherence of inertial-range
$\unicode[STIX]{x1D6FC}^{+}$
hovers near unity in Runs 1 and 2. We attribute this latter behaviour to a disruption of the anomalous coherence of inertial-range
 $\boldsymbol{z}^{-}$
fluctuations in the
$\boldsymbol{z}^{-}$
fluctuations in the
 $\boldsymbol{z}^{+}$
reference frame. This disruption is caused by the sign change in
$\boldsymbol{z}^{+}$
reference frame. This disruption is caused by the sign change in
 $\text{d}v_{\text{A}}/\text{d}r$
at
$\text{d}v_{\text{A}}/\text{d}r$
at
 $r=r_{\text{m}}$
, which, as shown by van Ballegooijen & Asgari-Targhi (Reference van Ballegooijen and Asgari-Targhi2017), leads to an inverse cascade of
$r=r_{\text{m}}$
, which, as shown by van Ballegooijen & Asgari-Targhi (Reference van Ballegooijen and Asgari-Targhi2017), leads to an inverse cascade of
 $\boldsymbol{z}^{+}$
energy in this same region (§ 5.4).
$\boldsymbol{z}^{+}$
energy in this same region (§ 5.4).
As mentioned in § 7, we have carried out additional, as-yet-unpublished numerical simulations similar to the ones we report here, but with different photospheric boundary conditions. For some values of the correlation length and correlation time of the photospheric velocity field, the fluctuations at
 $r\gtrsim 10R_{\odot }$
conform to neither the analytic model of § 4 nor the LGS model described in § 5.2.2. Determining how the properties of non-compressive turbulence at
$r\gtrsim 10R_{\odot }$
conform to neither the analytic model of § 4 nor the LGS model described in § 5.2.2. Determining how the properties of non-compressive turbulence at
 $r\gtrsim 10R_{\odot }$
depend upon the photospheric boundary conditions remains an open problem. Further work is also needed to determine how compressive and non-compressive fluctuations interact and evolve as they propagate away from the Sun and also to investigate the role of non-transverse (e.g. spherically polarized) fluctuations (see, e.g. Vasquez & Hollweg Reference Vasquez and Hollweg1996; Horbury, Matteini & Stansby Reference Horbury, Matteini and Stansby2018; Squire et al.
Reference Squire, Schekochihin, Quataert and Kunz2019).
$r\gtrsim 10R_{\odot }$
depend upon the photospheric boundary conditions remains an open problem. Further work is also needed to determine how compressive and non-compressive fluctuations interact and evolve as they propagate away from the Sun and also to investigate the role of non-transverse (e.g. spherically polarized) fluctuations (see, e.g. Vasquez & Hollweg Reference Vasquez and Hollweg1996; Horbury, Matteini & Stansby Reference Horbury, Matteini and Stansby2018; Squire et al.
Reference Squire, Schekochihin, Quataert and Kunz2019).
Observations have led to a detailed picture of solar-wind turbulence at
 $r\simeq 1~\text{au}$
(e.g. Belcher & Davis Reference Belcher and Davis1971; Matthaeus & Goldstein Reference Matthaeus and Goldstein1982; Bruno & Carbone Reference Bruno and Carbone2005; Podesta, Roberts & Goldstein Reference Podesta, Roberts and Goldstein2007; Horbury, Forman & Oughton Reference Horbury, Forman and Oughton2008; Chen et al.
Reference Chen, Mallet, Schekochihin, Horbury, Wicks and Bale2012; Wicks et al.
Reference Wicks, Mallet, Horbury, Chen, Schekochihin and Mitchell2013a
). With the recent launch of NASA’s Parker Solar Probe (Fox et al.
Reference Fox, Velli, Bale, Decker, Driesman, Howard, Kasper, Kinnison, Kusterer and Lario2016), it will soon become possible to measure velocity and density fluctuations (Kasper et al.
Reference Kasper, Abiad, Austin, Balat-Pichelin, Bale, Belcher, Berg, Bergner, Berthomier and Bookbinder2016) as well as electric-field and magnetic-field fluctuations (Bale et al.
Reference Bale, Goetz, Harvey, Turin, Bonnell, Dudok de Wit, Ergun, MacDowall, Pulupa and Andre2016) at heliocentric distances as small as
$r\simeq 1~\text{au}$
(e.g. Belcher & Davis Reference Belcher and Davis1971; Matthaeus & Goldstein Reference Matthaeus and Goldstein1982; Bruno & Carbone Reference Bruno and Carbone2005; Podesta, Roberts & Goldstein Reference Podesta, Roberts and Goldstein2007; Horbury, Forman & Oughton Reference Horbury, Forman and Oughton2008; Chen et al.
Reference Chen, Mallet, Schekochihin, Horbury, Wicks and Bale2012; Wicks et al.
Reference Wicks, Mallet, Horbury, Chen, Schekochihin and Mitchell2013a
). With the recent launch of NASA’s Parker Solar Probe (Fox et al.
Reference Fox, Velli, Bale, Decker, Driesman, Howard, Kasper, Kinnison, Kusterer and Lario2016), it will soon become possible to measure velocity and density fluctuations (Kasper et al.
Reference Kasper, Abiad, Austin, Balat-Pichelin, Bale, Belcher, Berg, Bergner, Berthomier and Bookbinder2016) as well as electric-field and magnetic-field fluctuations (Bale et al.
Reference Bale, Goetz, Harvey, Turin, Bonnell, Dudok de Wit, Ergun, MacDowall, Pulupa and Andre2016) at heliocentric distances as small as
 $9.8R_{\odot }$
. Such measurements will provide critical tests for numerical and theoretical models such as the ones we have presented here.
$9.8R_{\odot }$
. Such measurements will provide critical tests for numerical and theoretical models such as the ones we have presented here.
Acknowledgement
We thank M. Asgari-Targhi, A. Schekochihin and A. van Ballegooijen for helpful discussions. We also thank the three reviewers for their comments and suggestions, which helped improve the manuscript. This work was supported in part by NASA grants NNX11AJ37G, NNX15AI80, NNX16AG81G, NNX16AH92G, NNX17AI18G and 80NSSC19K0829, NASA grant NNN06AA01C to the Parker Solar Probe FIELDS Experiment and NSF grant PHY-1500041. High-performance-computing resources were provided by the Argonne Leadership Computing Facility (ALCF) at Argonne National Laboratory, which is supported by the Office of Science of the U.S. Department of Energy under contract DE-AC02-06CH11357. The ALCF resources were granted under INCITE projects from 2012 to 2014. High-performance computing resources were also provided by the Texas Advanced Computing Center under the NSF-XSEDE Project TG-ATM100031.


 Open access