


Introduction
Breast cancer continues to pose a considerable challenge to global health, as evidenced by GLOBOCAN 2022 data, which ranks it as the most commonly diagnosed cancer among women, representing 11·6% of all cancer cases and 6·9% of cancer-related fatalities worldwide. Reference Sung, Ferlay, Siegel, Laversanne, Soerjomataram, Jemal and Bray1 Post-mastectomy radiation therapy (PMRT) has been shown to effectively decrease rates of locoregional recurrence and enhance overall survival among breast cancer patients. Reference McGale, Taylor, Correa, Cutter, Duane, Ewertz, Gray, Mannu, Peto, Whelan, Wang, Wang and Darby2 Nevertheless, the intricacies of PMRT, especially in cases of left-sided breast cancer, involve the challenge of accurately targeting the treatment area while minimising radiation exposure to vital organs at risk (OAR), including the heart and lungs. Reference Darby, Ewertz, McGale, Bennet, Blom-Goldman, Brønnum, Correa, Cutter, Gagliardi, Gigante, Jensen, Nisbet, Peto, Rahimi, Taylor and Hall3,Reference Grantzau and Overgaard4
Advanced radiation techniques, such as intensity-modulated radiation therapy (IMRT) and VMAT, have shown effectiveness in enhancing dose conformity and reducing cardiac exposure for patients with left-sided breast cancer. Reference Moorthy, Sakr and Hasan5,Reference Hall and Wuu6 However, the use of these advanced techniques may result in a larger volume of healthy tissue receiving low-dose radiation, thereby potentially increasing the likelihood of secondary malignancies. Reference Donovan, James, Bonora, Yarnold and Evans7,Reference Lin, Yeh, Yeh, Chang and Lin8
Recent studies have explored the integration of IMRT and VMAT through hybrid techniques, aiming to combine the precision of IMRT with the efficiency of VMAT. Reference Lin, Yeh, Yeh, Chang and Lin8,Reference Akbas, Koksal, Kesen, Ozkaya, Bilge and Altun9 Despite these advancements, the challenge of selecting the optimal technique for individual patients continues, as varying dosimetric indices may favour different approaches. Reference Wagner, Bova, Friedman, Buatti, Bouchet and Meeks10,Reference Hernandez, Hansen, Widesott, Bäck, Canters, Fusella, Götstedt, Jurado-Bruggeman, Mukumoto, Kaplan, Koniarová, Piotrowski, Placidi, Vaniqui and Jornet11
The plan evaluation process requires an analysis of dosimetric indices for planning target volumes (PTVs), an assessment of dose–volume criteria for OARs and a review of treatment parameters along with clinical factors. Various methods have been developed to support the evaluation of treatment plans, aiming to quantify and compare the quality of different radiotherapy plans.
These approaches are typically classified into two primary categories: unified dosimetric index (UDI) methodologies and scoring systems. UDI methods, as defined by Akpati et al. Reference Akpati, Kim, Kim, Park and Meek12 and Mambretti et al., Reference Mambretti, Romanò, Marvaso, Comi, Cambria, Ciardo, Emiro, Fodor, Zerini, Riva, Petralia, De Cobelli, Orecchia, Cattani and Jereczek-Fossa13 consolidate multiple dosimetric parameters into a single metric, enabling a comprehensive evaluation of treatment plans. Scoring systems, as discussed in the studies, Reference Leung, Kan and Cheng14–Reference Alfonso, Herrero and Núñez17 offer an in-depth analysis of plan quality across various parameters, often allowing for more personalised assessments.
Building on these concepts, Leung et al. Reference Leung, Kan and Cheng14 presented an innovative dose–volume-based Plan Quality Index aimed at facilitating the comparison of IMRT plans. Ruan et al. Reference Ruan, Shao and Demarco15 illustrated the progression of treatment plan quality criteria derived from the specific experiences of various institutions. Song et al. Reference Song, Staub and Chen16 suggested the implementation of patient-specific dosimetric endpoints to enhance quality control in radiotherapy treatment planning. Additionally, Alfonso et al. Reference Alfonso, Herrero and Núñez17 created a decision-support system based on dose–volume histograms (DVH) to assist in the dosimetric comparison of radiotherapy treatment plans. Balaji et al. Reference Balaji and Ramasubramanian18 introduced an extensive scoring formula that combines dosimetric indices for PTVs and OARs, incorporating designated penalties and applying a consistent weighting factor of one across all dosimetric indices. In addition to these dosimetric evaluation methods, Ansari et al. Reference Ansari, Zope and Yadav19 presented a novel approach for evaluating risk factors (RFs) associated with OAR, which considers radiobiological elements.
The aim of this research is to thoroughly assess and compare advanced radiotherapy methods for treating left-sided breast cancer, with a particular emphasis on Five Partial Arc (5P)-VMAT, VMAT in conjunction with IMRT (VMAT+IMRT) and IMRT in conjunction with VMAT (IMRT+VMAT). By utilising the innovative scoring formula introduced by Balaji et al. Reference Balaji and Ramasubramanian18 alongside the risk-assessment strategies suggested by Ansari et al., Reference Ansari, Zope and Yadav19 we seek to create a robust evaluation framework tailored to individual patients. This innovative methodology not only improves the optimisation of treatment plans but also has the potential to enhance patient outcomes by offering a more detailed and comprehensive approach to selecting radiotherapy techniques. To our knowledge, this study represents the first systematic exploration that integrates these advanced evaluation methods in radiotherapy, signifying a notable advancement in personalised cancer treatment approaches.
Methods and Materials
Patient’s selection, characteristics and simulation
A retrospective analysis was conducted involving 41 female patients diagnosed with left-sided breast cancer who underwent VMAT radiotherapy at the State Cancer Institute, Indira Gandhi Institute of Medical Science, Patna, between December 2022 and June 2024. The criteria for inclusion required patients to be at least 18 years of age, possess histologically confirmed left-sided breast cancer and have complete medical records pertaining to their VMAT treatment. Exclusion criteria encompassed male patients, those with right-sided breast cancer, metastatic disease, incomplete medical documentation or treatment and individuals who were pregnant. The median age of the participants was 47 years, with an age range of 29 to 76 years, and tumor stages ranging from T1 to T4, along with nodal involvement classified as N0 to N3 (either N2b or N3b were not present) following modified radical mastectomy. Patients received neoadjuvant or adjuvant chemotherapy according to stage hormone receptor and HER-2 status.
CT simulation was performed using a Revolution EVO (GE healthcare) CT simulator with a slice thickness of 2·5 mm. Patients were positioned supine on an all-in-one base plate breast board, secured with a two-clamp thermoplastic mask. The affected arm was elevated to at least 90 degrees, and the head was rotated to the opposite side. The CT images were subsequently imported into the eclipse treatment planning system (Varian Medical Systems, Palo Alto, USA), where the clinical target volume, PTV and OARs, including the heart and lungs, were delineated in accordance with RTOG guidelines. 20 The study received approval from the institutional review board.
Target dose and treatment planning
The Eclipse treatment planning system (version 16.1, Varian Medical Systems, USA) was utilised to create and refine treatment plans, which were delivered on a Varian TrueBeam SVC linear accelerator featuring Millennium 120 multileaf collimators (MLC). Three different planning methodologies were employed: VMAT, VMAT+IMRT and IMRT+VMAT with a 6MV photon beam. The cumulative prescribed dose to the PTV was 40·05 Gy in 15 fractions, with each fraction delivering 2·67 Gy over duration of 3 weeks. Two hybrid strategies were developed: IMRT+VMAT and VMAT+IMRT. In all these hybrid plans, the prescribed dose was allocated between the IMRT (70%, 1·9 Gy) and VMAT (30%, 0.8 Gy) components. For the IMRT+VMAT approach, the IMRT component employed four beam angles (300°, 315°, 120° and 135°) with collimation angles set at 30° and 330°. The VMAT component included two partial arcs: one spanning from 305° to 50° in a clockwise direction and the other from 160° to 60° in counterclockwise direction, both maintaining a collimation angle of ±30°. In the VMAT+IMRT configuration, the dose distribution was inverted, with VMAT delivering 1·9 Gy and IMRT providing 0.8 Gy, while retaining the same beam arrangement for the IMRT component. Furthermore, a five-partial arc VMAT plan was created, which included jaw splitting and the following arc configurations: 310°–41° (collimator 17°), 81°–160° (343°), 331°–160° (80°), 160°–81° (357°) and 41°–310° (3°). This beam arrangement, as detailed in Patil et al., Reference Patil, Zope, Madhawi, Raj, Kishor, Devi, Singh and Singh21 has demonstrated effectiveness in enhancing dose delivery while reducing exposure to critical organs in my previous studies. All VMAT plans underwent optimisation using the photon optimiser (PO), and final dose calculations were conducted with the anisotropic analytical algorithm (AAA), utilising a grid of 2·5 mm. The optimisation process for the hybrid plans involved establishing a base plan, optimising the second component with reference to the base plan, integrating the components and normalising to 100% of the target mean dose. Consistent optimisation constraints were applied across all plans, with adjustments made to PTV’s priority, weights as necessary to ensure sufficient coverage.
Plan evaluation method
A DVH analysis was performed to assess the dosimetric characteristics of PTVs and OARs across all treatment plans. Essential dosimetric metrics for PTVs, such as the coverage index (COI), uniformity index (UI), conformity index (CI) and gradient index (GI), were utilised alongside dose–volume parameters for OARs, as detailed in Table 1, for comparative evaluation. Furthermore, monitor units (MU) were analysed to determine the efficiency of the treatment delivery process.
Table 1. Dosimetric parameters and organ at risks constraints for left-sided breast cancer
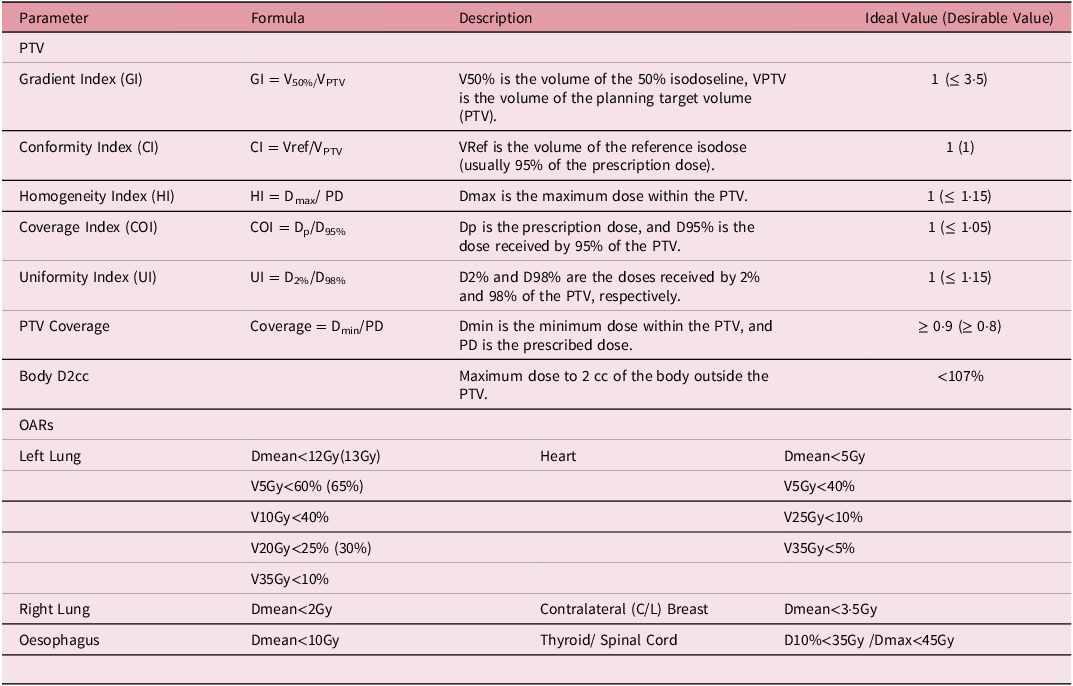
VxGy: volume of an organ receiving a dose of x Gray (Gy); Dmean represents the mean dose; Dmax represents the maximum dose; D10% represents the dose received by 10% of the volume.
Integrating scoring method
An integrated scoring approach, akin to that utilised by Balaji et al. Reference Balaji and Ramasubramanian18 was employed to amalgamate all dosimetric indices pertaining to the PTVs, OARs and delivery parameters such as MU and TT into a unified score. The calculation of the integrated score was as follows:
 $$Integrated \;score={\sum_ {i=1}^n{Individual \;score_i}\over n}$$
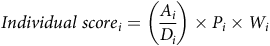 $$Individual \;score_i=\left({{A_i} \over {D_i}}\right)\times P_i \times W_i$$
In this context, Ai represents the achieved value of the ithdosimetric index, while Di denotes the desired value, and n indicates the total number of indices evaluated. The penalty function Pi serves to double the score for results that are deemed unacceptable or exhibit statistically significant differences between treatment plans. The weighting factor Wi , which ranges from 0.1 to 1, enables clinicians to modify the importance of each index according to specific clinical requirements. For instance, in elderly patients, a reduced weighting factor may be applied to high-dose parameters (such as V35Gy) to mitigate toxicity risks to the lung and heart. In contrast, for younger patients (those under 45 years of age), a lower weighting factor might be assigned to low-dose parameters (like V5Gy) to decrease the likelihood of secondary cancer development.
Risk assessment method
The risk factor (RF) assessment methodology developed by Ansari et al. Reference Ansari, Zope and Yadav19 examines the potential toxicity to healthy organs adjacent to the target volume during irradiation, taking into account the organ’s tolerance dose (TD). The likelihood of injury to an organ at risk (OAR) is influenced by its total volume (VTVO), the specific type of organ and the degree of its irradiated subvolumes. The formula used to compute the RF is as follows:
RF = DP × {(VVOI)/(VTVO ×DTDO)}
In this context, DP represents the prescribed dose to the planning target volume (PTV), VVOI denotes the volume of the organ that has been irradiated (calculated as the total organ volume minus the volume corresponding to the reference isodose), VTVO refers to the total volume of the organ and DTDO indicates the tolerance dose of the organ. This approach aids in assessing the potential risk of toxicity by considering the volume effect of the organ during the irradiation process.
Definition of performance thresholds
In order to assess the quality of treatment plans, performance thresholds for PTV coverage and OAR sparing were determined through a statistical distribution-based methodology. For each planning technique (VMAT, V+I and I+V), the mean (μ) and standard deviation (σ) of dosimetric metrics were computed. The thresholds were classified into four performance categories: Excellent (below μ − σ), Good (from μ − σ to μ), Average (from μ to μ + σ) and Poor (above μ + σ). This approach facilitated an objective and uniform evaluation of plan quality across all techniques.
Integral dose (ID)
The integral dose represents the total energy absorbed by an organ. To calculate the ID, the mean organ dose, mean organ density and mean organ volume are utilised, as defined by the formula:
ID = Dmean * Vmean * ρmean (Gy-L)Reference Shi, Peñagarícano and Papanikolaou22,Reference Zope, Patil and Saroj23
In this equation, Dmean signifies the mean organ dose, Vmean denotes the organ volume and ρmean indicates the mean organ density. In this study, all organs are assumed to have a uniform density (ρ = 1); thus, the ID is computed using the following formula:
ID = Dmean * Vmean (Gy-L)Reference Shi, Peñagarícano and Papanikolaou22,Reference Zope, Patil and Saroj23
Results
This study evaluated three distinct treatment planning method including VMAT, VMAT+IMRT and IMRT+VMAT in relation to dosimetric parameters associated with the planning target volume (PTV) and OARs, utilising individual scoring methods as outlined by Balaji et al. Reference Balaji and Ramasubramanian18 and RF assessment methods as outlined by Ansari et al. Reference Ansari, Zope and Yadav19
Figure 1 presents a comparative analysis of the three treatment planning techniques. In Figure 1, the colour wash isodose distribution patterns are shown, ranging from maximum to 20%, across the three planning methods (VMAT, VMAT+IMRT and IMRT+VMAT) utilised for the treatment of left-sided breast cancer. Figure 2 illustrates the associated DVH for the three techniques, offering a quantitative assessment of dose distribution within target volumes and critical structures.
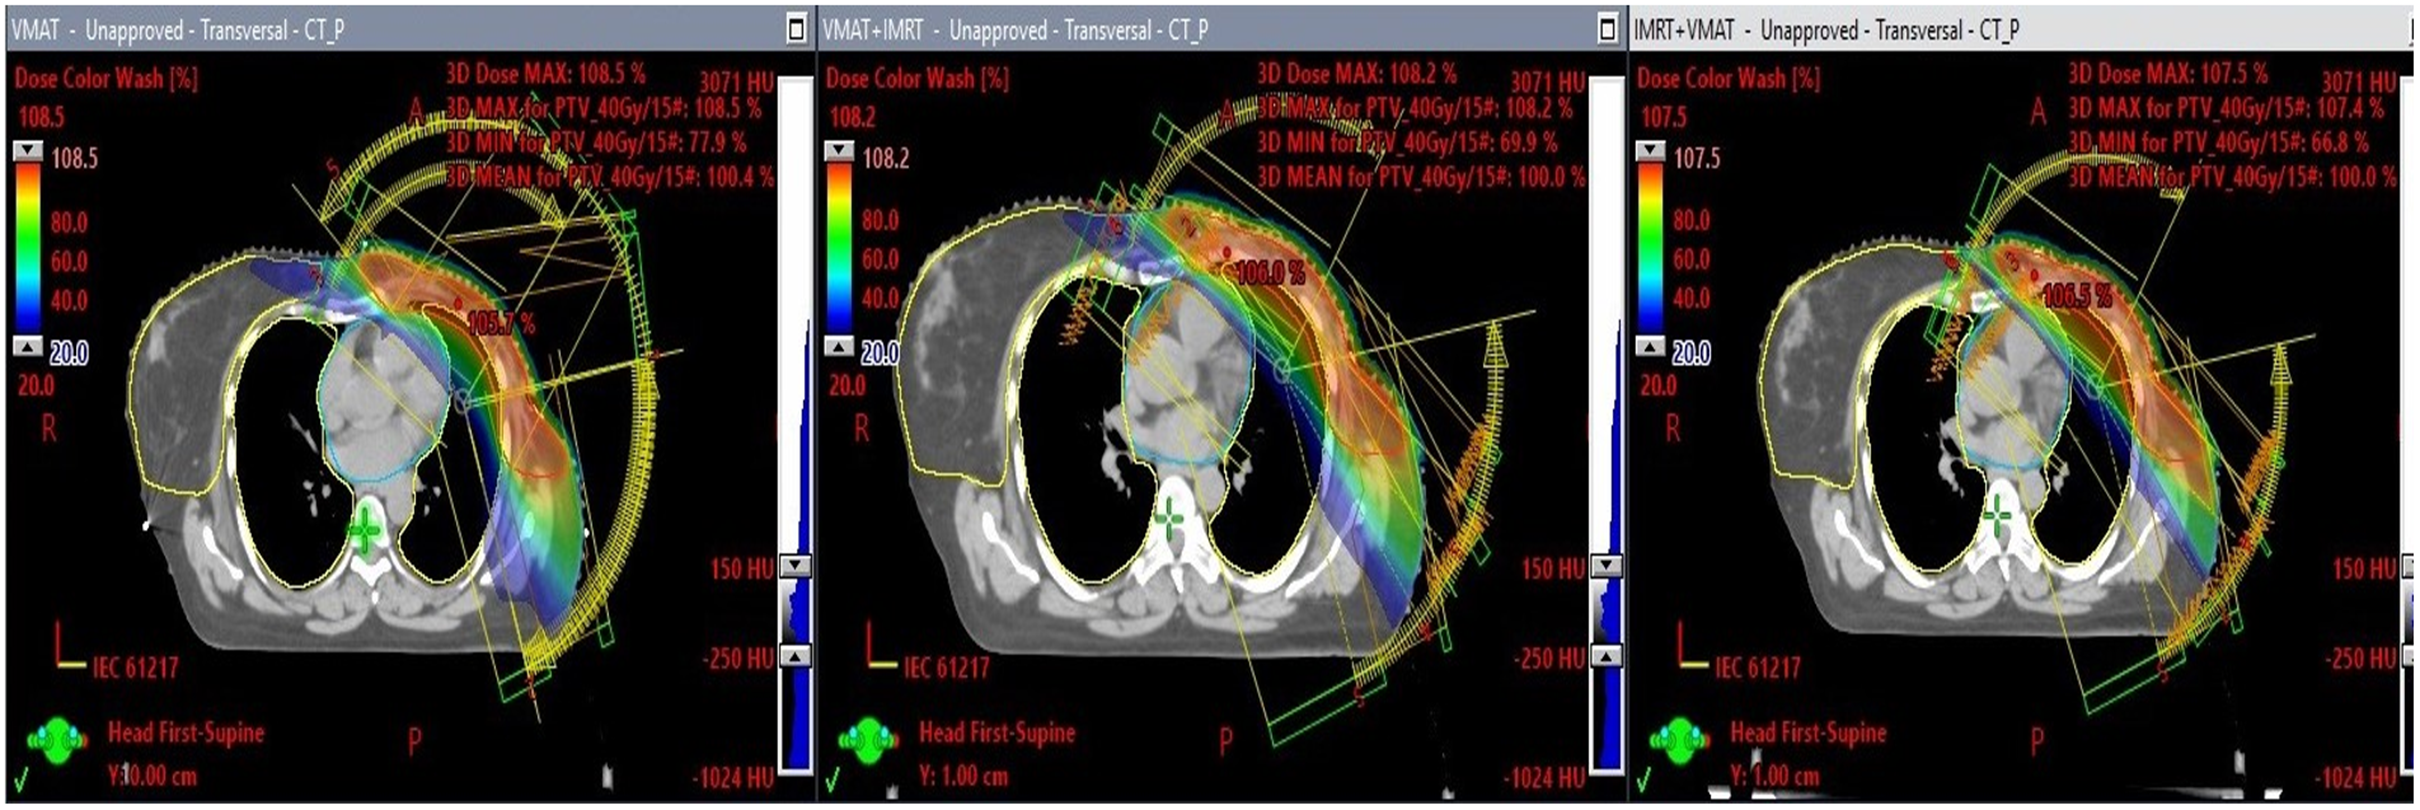
Figure 1. This illustration presents three transverse CT slices that depict the dose distribution of three distinct radiotherapy treatment plans: VMAT, VMAT+IMRT and IMRT+VMAT. The isodose lines extend from the highest dose percentage to a minimum of 20%.
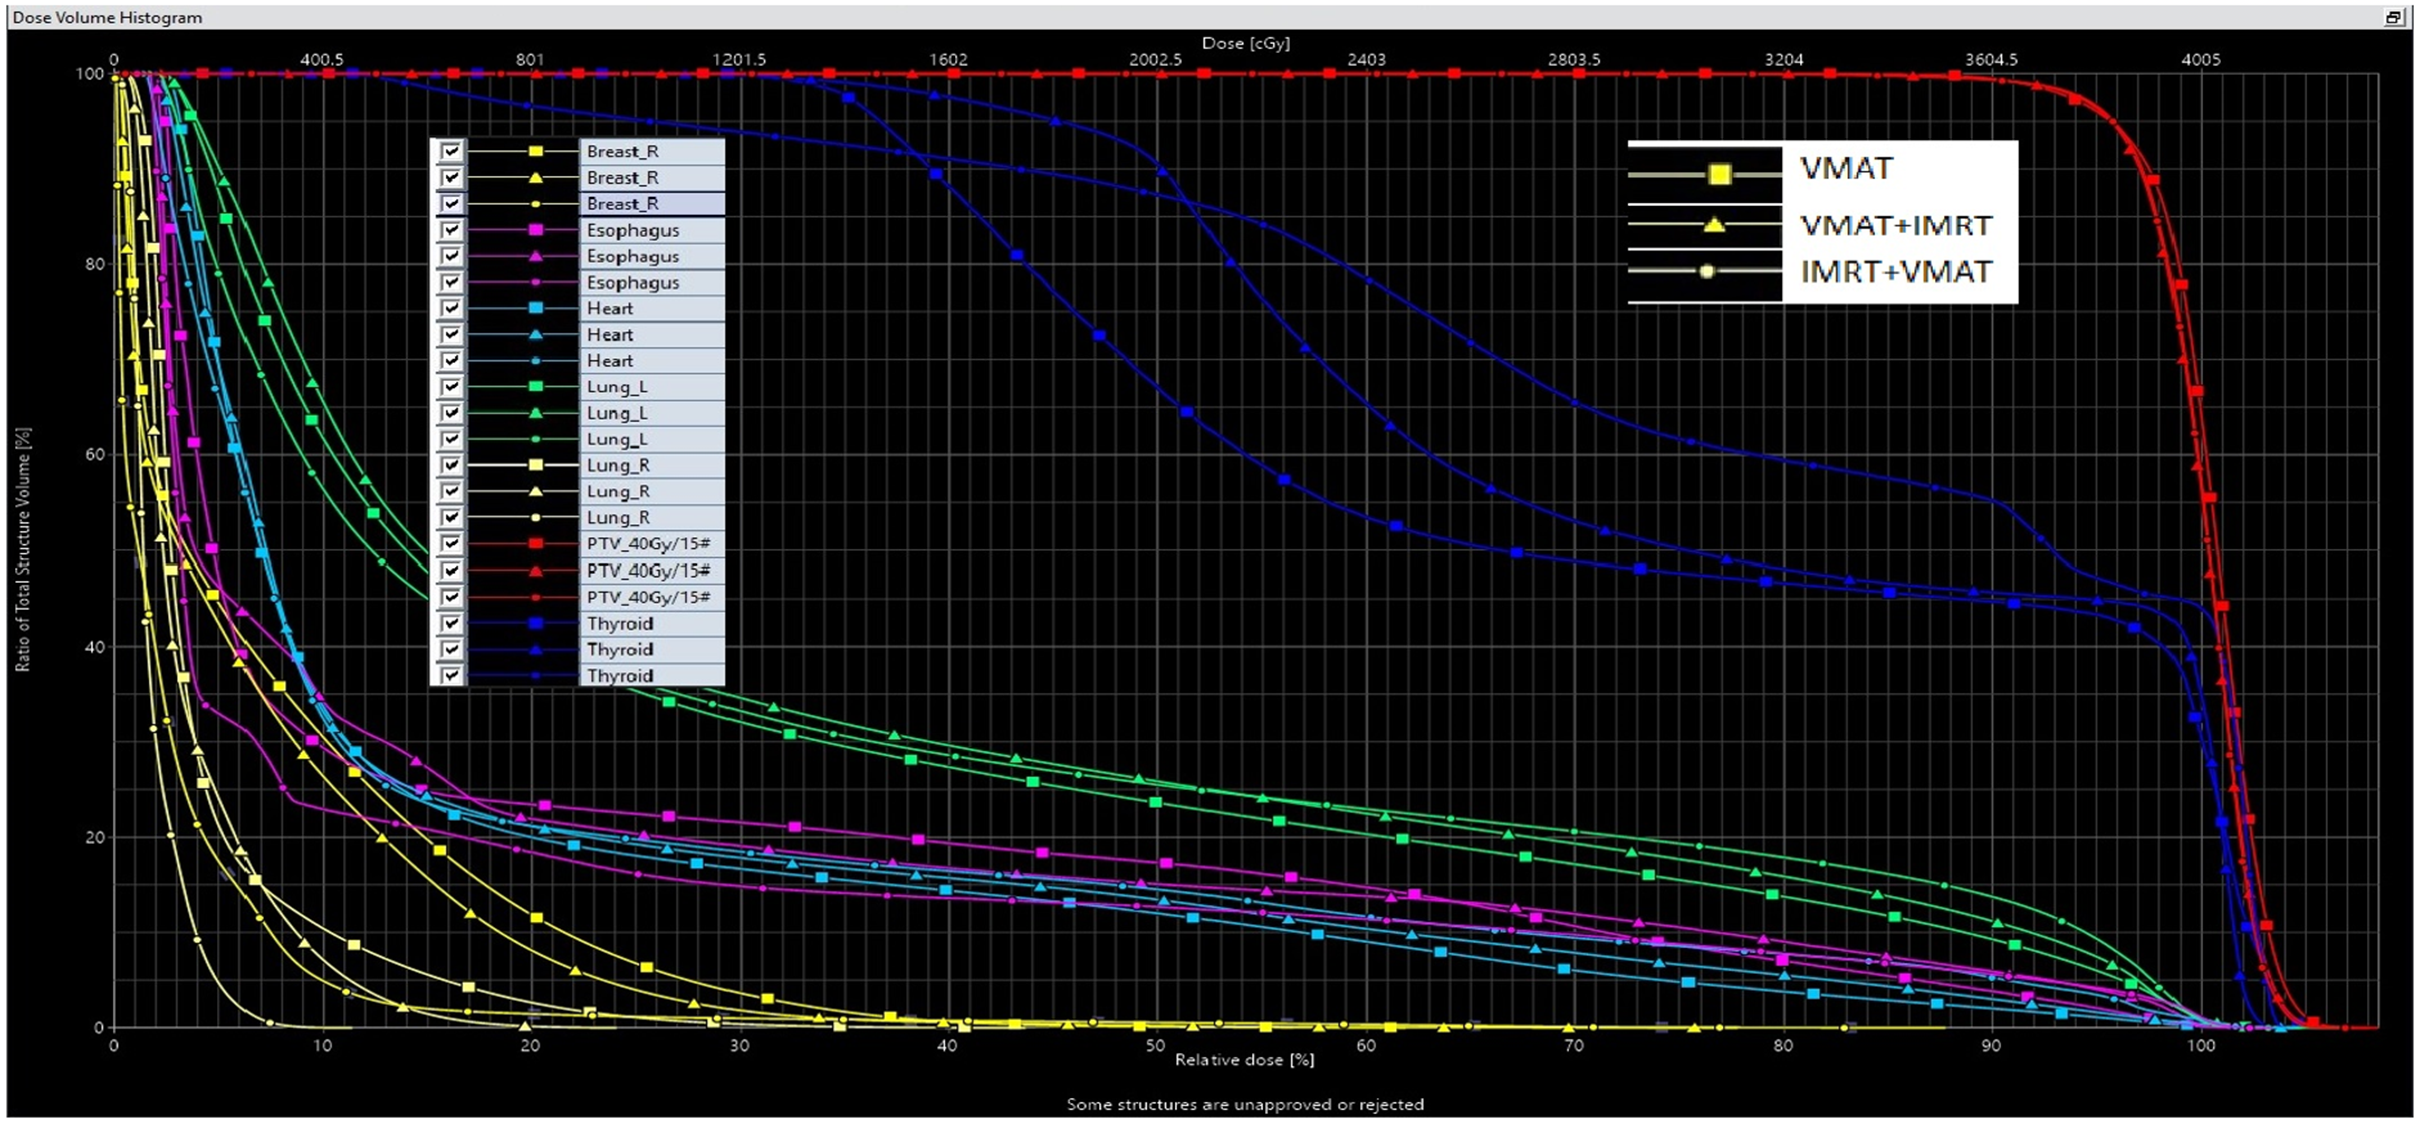
Figure 2. Illustrates a dose–volume histogram (DVH) comparing three different radiotherapy treatment techniques: VMAT, VMAT+IMRT and IMRT+VMAT.
Table 2. The mean achieved value and individual score results for all dosimetric indices related to PTV and organs at risks.
Table 2. The mean achieved value and individual score results for all dosimetric indices related to PTV and organs at risks
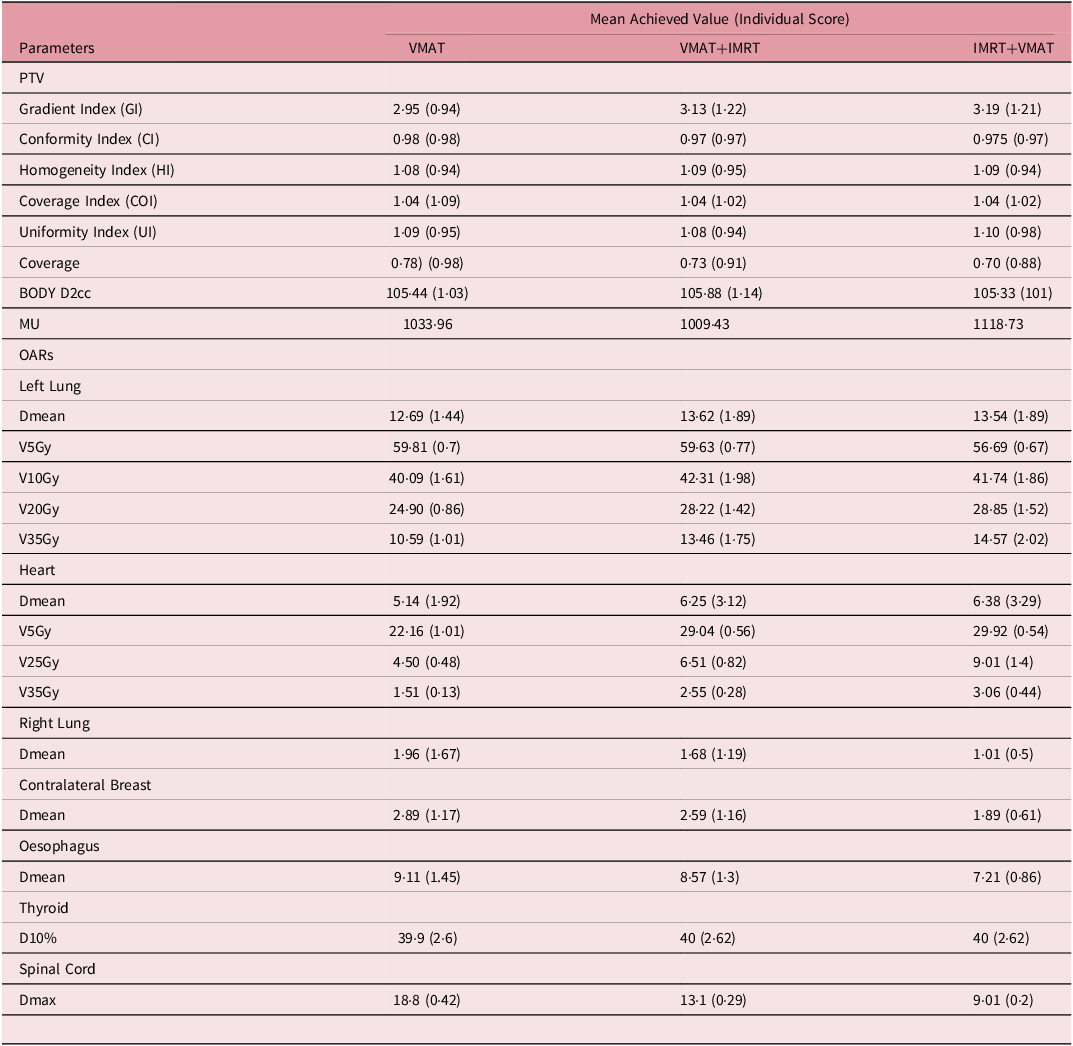
VxGy: volume of an organ receiving a dose of x Gray (Gy); Dmean represents the mean dose; Dmax represents the maximum dose; D10% represents the dose received by 10% of the volume.
Planning target volume with individual score
The Gradient Index (GI) recorded the lowest value for the VMAT technique at 2·95, with the VMAT+IMRT technique at 3·13 and the IMRT+VMAT technique at 3·19. In terms of individual score performance, the VMAT technique excelled with a score of 0·94, while the VMAT+IMRT and IMRT+VMAT techniques yielded comparable scores of 1·22 and 1·21, respectively. The CI exhibited minor variations among the techniques, with VMAT achieving a slightly superior conformity score of 0·98 and an individual score of 0·98, in contrast to VMAT+IMRT at 0·97 and IMRT+VMAT at 0.97 both of which had individual scores of 0·97. Both the homogeneity index (HI) and COI remained stable across all techniques. The HI values ranged from 1·08 to 1·09, while the COI was recorded at 1.04. In terms of individual COI scores, VMAT+IMRT and IMRT+VMAT (1·02) outperformed VMAT (1·09). The Uniformity Index (UI) varied between 1·08 and 1·10, with VMAT+IMRT demonstrating the uniformity is 1·08 (individual score of 0·94), followed by VMAT (0·95) and IMRT+VMAT (0·98). PTV coverage was greatest for the VMAT technique at 0·78, followed by VMAT+IMRT at 0·73 and IMRT+VMAT at 0·70. Regarding BODY D2cc, the IMRT+VMAT technique achieved the highest individual score of 1·01, closely trailed by VMAT at 1·03, while VMAT+IMRT recorded a slightly elevated score of 1·14.
Organs at risk with individual score
Left Lung: The VMAT+IMRT and IMRT+VMAT techniques yielded higher average doses, recording individual scores of 13·62 Gy (1·89) and 13.54 Gy (1·89), respectively, in contrast to the VMAT technique, which had a mean dose of 12·69 Gy and an individual score of 1·44. Regarding V5Gy, the IMRT+VMAT technique demonstrated the smallest volume at 56.67%, accompanied by an integrated score of 0·67. This was followed by the VMAT technique at 59·81% (individual score: 0·70) and the VMAT+IMRT technique at 59·63% (individual score: 0·77). For V10Gy, the VMAT technique recorded the lowest percentage at 40·09%, with an individual score of 1·61. The IMRT+VMAT technique followed at 41·74% (1·86), and the VMAT+IMRT technique was at 42·31% (1.98). In the case of V20Gy, the VMAT technique again had the lowest value at 24·90%, with an individual score of 0.86. This was succeeded by the VMAT+IMRT technique at 28·22% (1·42) and the IMRT+VMAT technique at 28.85% (1·52). Lastly, for V35Gy, the VMAT technique exhibited the lowest volume at 10·59%, with an individual score of 1·01, followed by the VMAT+IMRT technique at 13·46% (1·75) and the IMRT+VMAT technique at 14·57% (2·02).
Heart: The VMAT technique recorded the lowest average dose, measuring 5·14 Gy (1·92), while both the VMAT+IMRT and IMRT+VMAT techniques exhibited comparable average doses of 6·25 Gy, each with an individual score of 3·29. In terms of V5Gy, the VMAT technique demonstrated the smallest volume at 22·16%, achieving an individual score of 1·01. This was followed closely by the VMAT+IMRT and IMRT+VMAT techniques, which both had volumes of 29·92% and individual scores of 0·56. For V25Gy, the VMAT technique again had the lowest percentage at 4·50%, with an individual score of 0.48. The VMAT+IMRT technique followed with a value of 6·51% (0·82), while the IMRT+VMAT technique recorded 9·01% (1.40). Regarding V35Gy, the VMAT technique maintained the lowest percentage at 1·51%, resulting in an individual score of 0·13. In contrast, the VMAT+IMRT and IMRT+VMAT techniques were at 3·06%, each with an individual score of 0·44.
Right Lung and Contralateral Breast: The VMAT technique demonstrated greater average doses for the right lung, achieving an individual score of 1·96 Gy (1·67), in contrast to VMAT+IMRT, which recorded 1.68 Gy (1·19), and IMRT+VMAT, which had a score of 1·01 Gy (0·5). A comparable pattern was noted for the contralateral breast, where the VMAT technique again led with a score of 1·17, followed closely by VMAT+IMRT at 1·16 and IMRT+VMAT at 0·61.
Oesophagus, Thyroid and Spinal Cord: For the oesophagus, the average dose recorded was the highest for the VMAT technique at 9·11 Gy (145), followed by the VMAT+IMRT technique at 8·57 Gy (1·30) and the IMRT+VMAT technique at 7·21 Gy (0·86). In terms of the thyroid, the D10% values remained consistent across all techniques, with individual measurements falling between 39·9 and 40 Gy (2·60–2·62). Regarding the spinal cord, the maximum dose was also highest for the VMAT technique at 18.8 Gy (0·42), followed by the VMAT+IMRT technique at 13·1 Gy (0.29) and the IMRT+VMAT technique at 9·01 Gy (0·20).
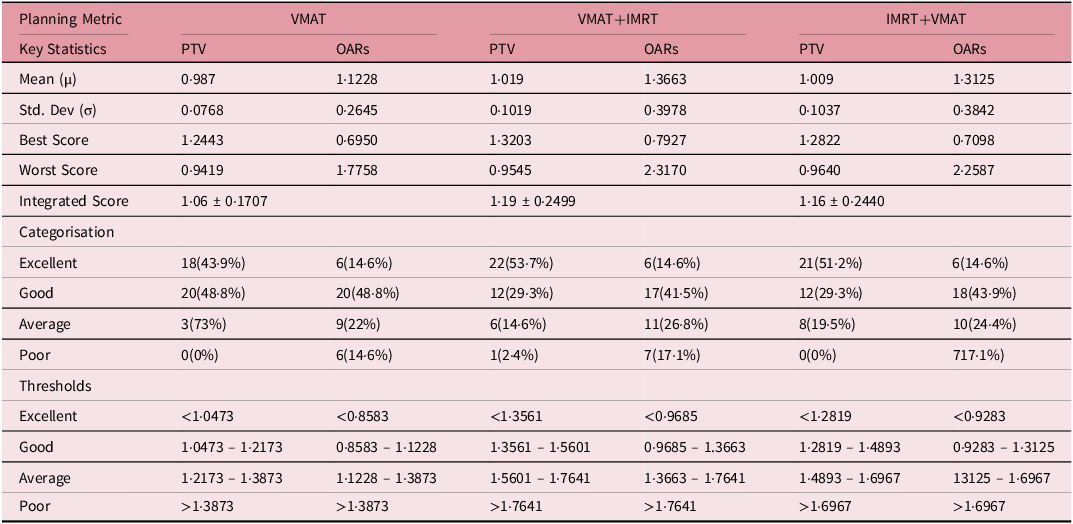
Table 3 presents a comprehensive analysis of integrated scores for VMAT, VMAT+IMRT and IMRT+VMAT metrics, comparing OARs and PTV performance. The average scores for OARs were consistently elevated across all evaluated techniques (VMAT: 1·1228, VMAT+IMRT: 1·3663 and IMRT+VMAT: 1·3125) in comparison to the scores for PTV (VMAT: 1·0633, VMAT+IMRT: 1·0865 and IMRT+VMAT: 1·0897). Furthermore, the standard deviations for the OARs metrics were significantly higher (VMAT: 0·2645, VMAT+IMRT: 0·3978 and IMRT+VMAT: 0·3842) than those observed for the PTV metrics (VMAT: 0·0768, VMAT+IMRT: 0·1019 and IMRT+VMAT: 0·1037), suggesting a greater degree of variability in the performance of OARs. The classification of scores indicates clear distinctions between OARs and PTV. For OARs, a significant majority of scores were classified as Good across all evaluated metrics (VMAT: 48.8%, VMAT+IMRT: 41·5% and IMRT+VMAT: 43.9%), while a steady 14.6% were rated as Excellent. Conversely, PTV scores exhibited a greater representation in the Excellent category (VMAT: 43·9%, VMAT+IMRT: 53·7%, IMRT+VMAT: 51·2%), with a reduced number of scores falling into the Average and Poor categories. It is important to highlight that, although the percentage of Poor scores for OARs remained relatively stable across various metrics (ranging from 14·6% to 17·1%), the PTV scores infrequently categorised as Poor, with only the VMAT+IMRT metric exhibiting a 24% Poor score. The threshold analysis demonstrated that VMAT consistently attained lower (more advantageous) threshold values across all categories in comparison to VMAT+IMRT and IMRT+VMAT. For example, the threshold for “Excellent” performance with VMAT was noted at <0·8583, while VMAT+IMRT and IMRT+VMAT recorded thresholds of <0·9685 and <0·9283, respectively.
Table 3. Integrated scores analysis for VMAT, VMAT+IMRT, and IMRT+VMAT planning Metrics including PTV and OARs
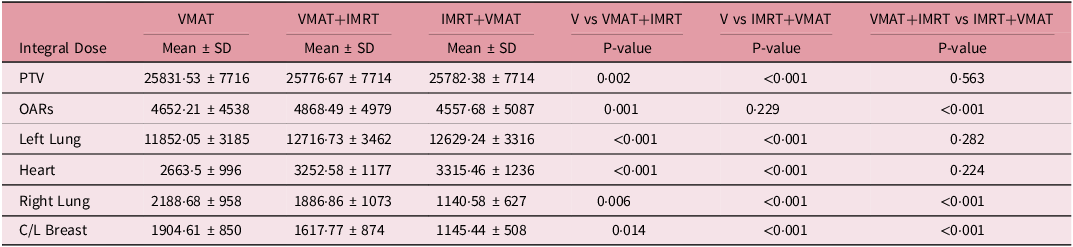
Tables 4 and 5 demonstrate thorough examination of RF and integral doses across the VMAT, VMAT+IMRT and IMRT+VMAT techniques has yielded intricate insights regarding cardiac and pulmonary structures. For cardiac assessment, the mean tolerance dose was established at 26 Gy, with pericarditis as the endpoint. The RF values ranged from 0·06 ± 0·040 to 0·10 ± 0·591, while the correlation coefficients between the integrated score and RF fluctuated between 0·29 and 053. In the case of pulmonary evaluation, the mean tolerance dose was set at 20 Gy, with radiation pneumonitis as the endpoint. Here, the RF values were notably higher, ranging from 0·49 ± 0.072 to 0.57 ± 0·095, and the correlations between the integrated score and RF varied from 0·55 to 0·75. The assessment of integral doses indicated statistically significant differences among the techniques employed. While no major differences were noted for the PTV, the analysis of OAR revealed significant variations. The VMAT+IMRT group recorded the highest integral dose for OAR, with distinct variations observed for specific structures. The left lung exhibited significantly lower integral doses when utilising the VMAT technique, whereas the heart showed increased integral doses with the VMAT+IMRT and IMRT+VMAT techniques compared to the VMAT technique. Additionally, the integral doses for the right lung and contralateral breast displayed significant differences, with the VMAT technique resulting in lower doses for the right lung and the IMRT+VMAT technique yielding the lowest integral dose for the contralateral breast. These results highlight the intricate dosimetric properties of various radiotherapy techniques and their potential ramifications for treatment planning.
Table 4. Risk factor (RF) analysis and correlation between integrated score and RF in three different techniques
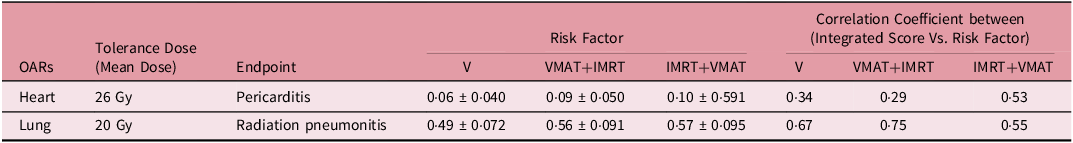
Table 5. Integral dose across three techniques including PTV and OARs
Discussion
A thorough examination of three distinct radiotherapy planning approaches for left-sided breast cancer VMAT, VMAT+IMRT and IMRT+VMAT has yielded several significant insights. Figure 3 presents the correlation coefficients between individual and integrated scores across various dosimetric parameters for the PTV, highlighting particularly strong positive correlations in the Gradient Index (GI) for all three methods (VMAT_IS, IMRT+VMAT_IS and VMAT+IMRT_IS), with correlation coefficients ranging from approximately 0·65 to 0·85.
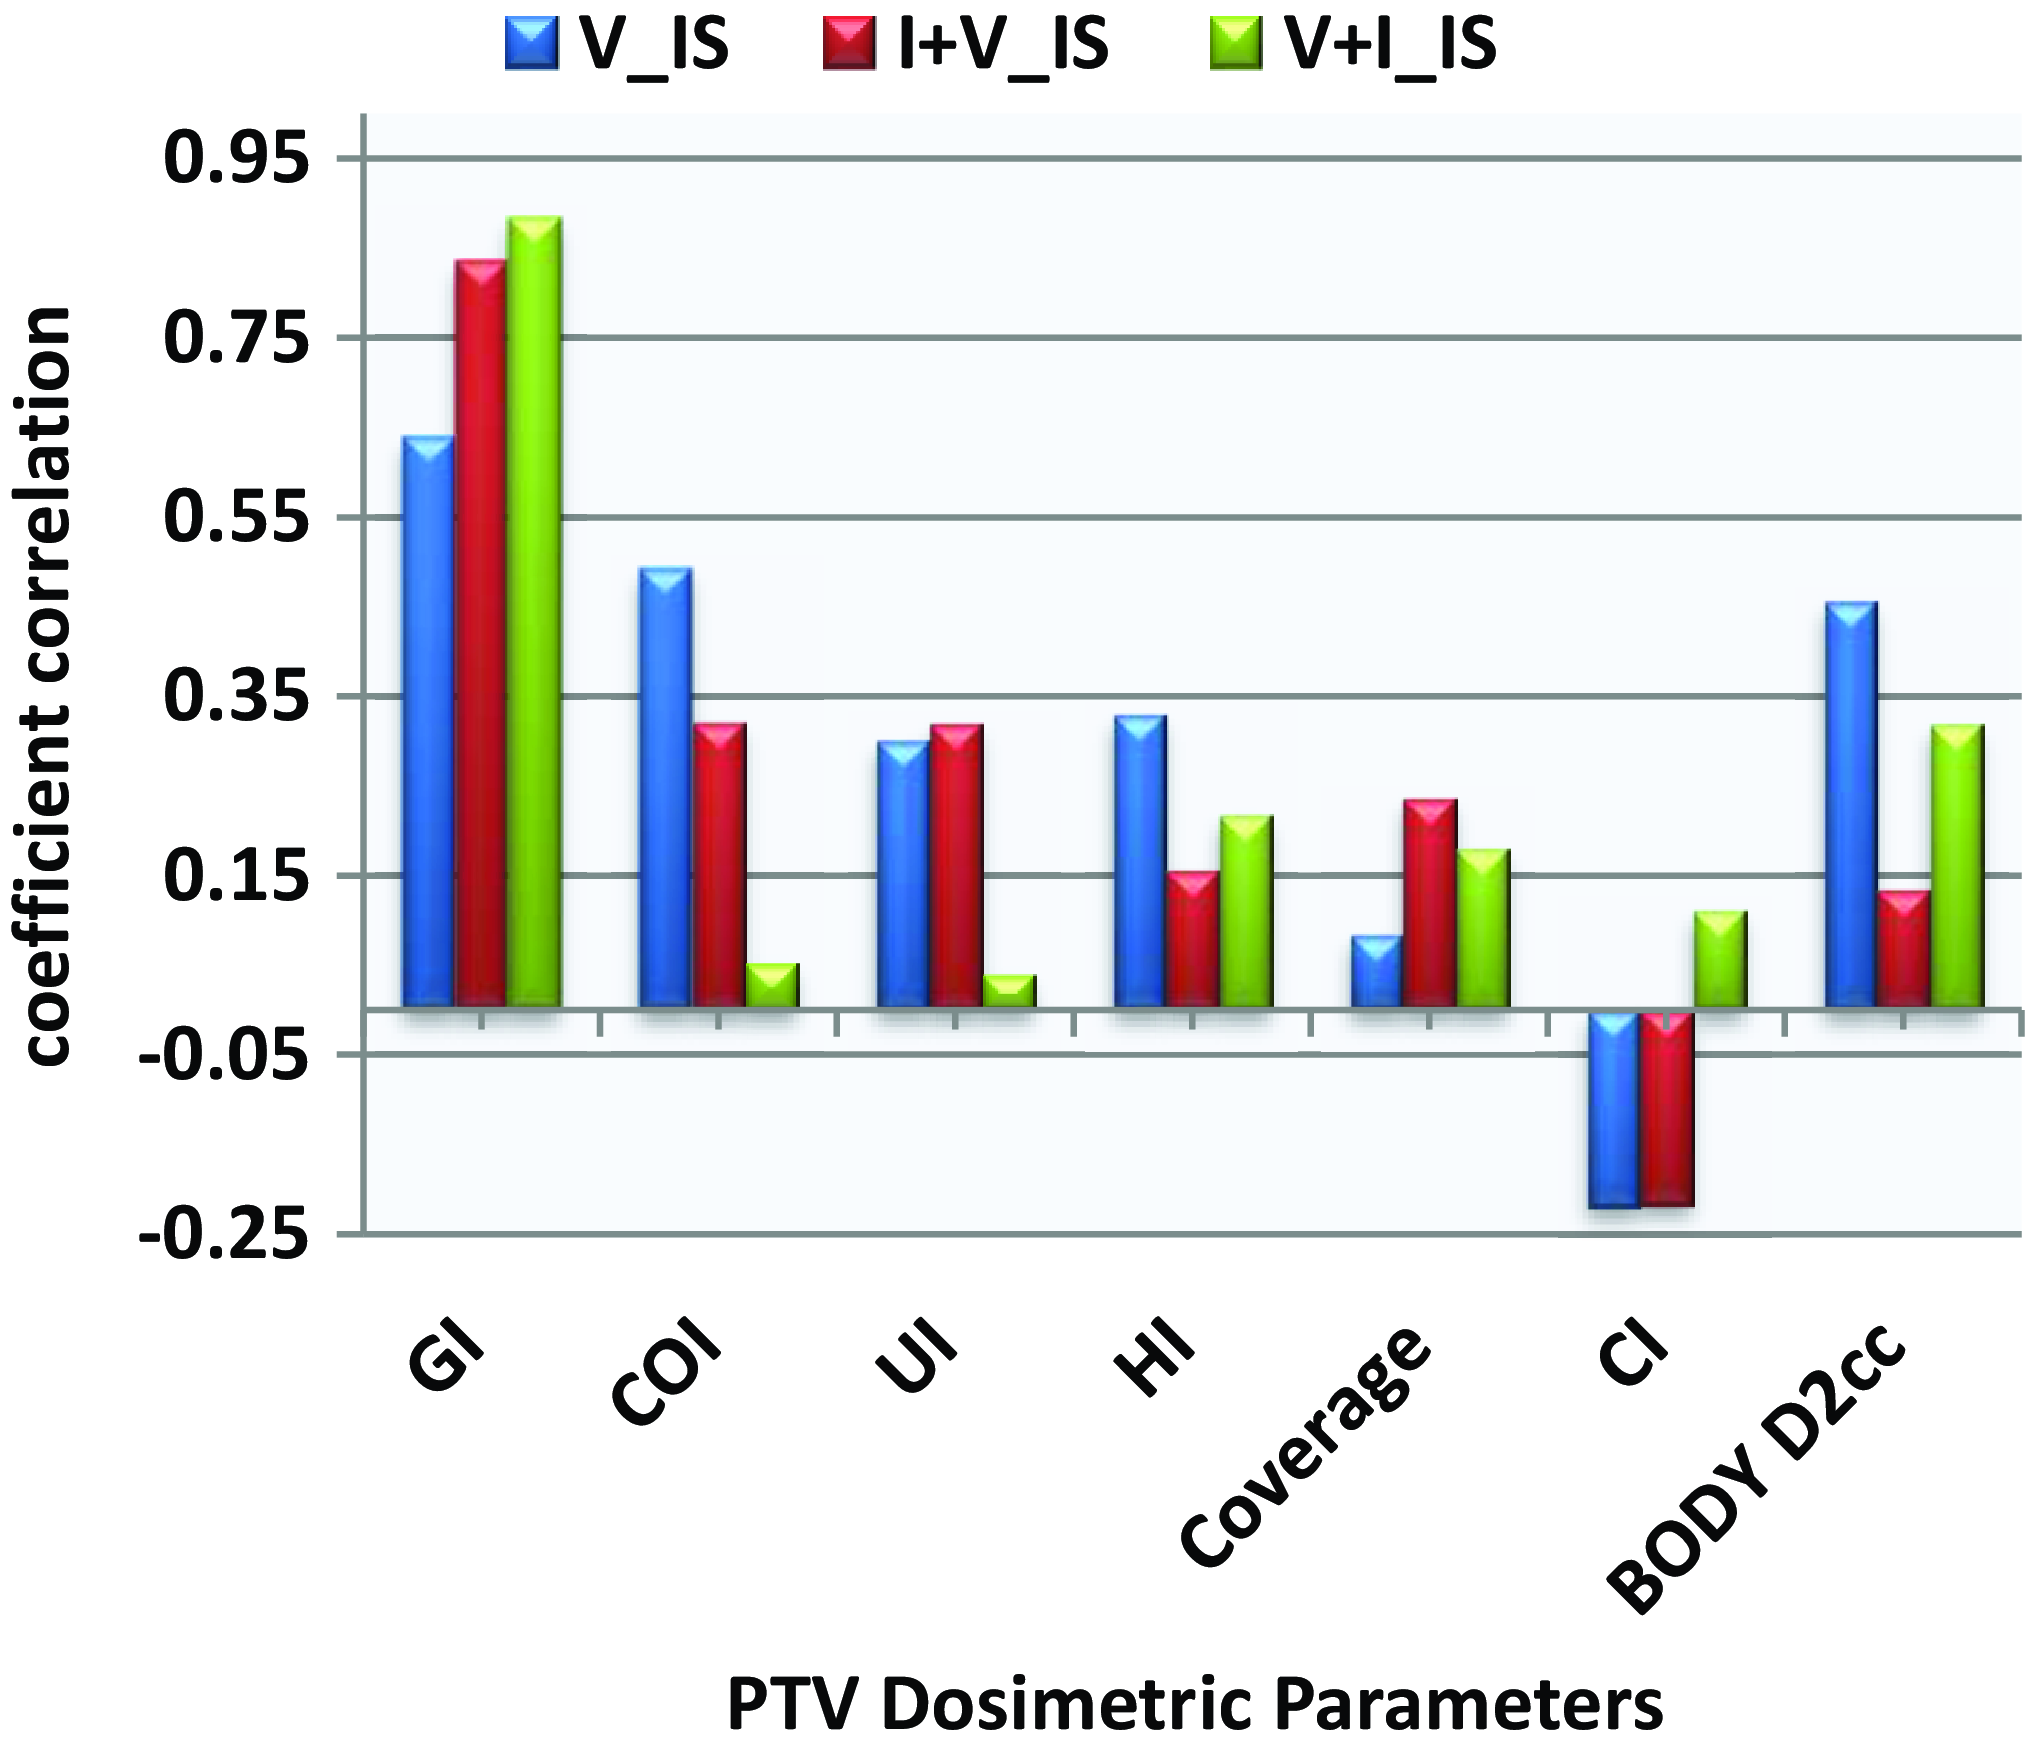
Figure 3. Correlation coefficients between individual and integrated scores in the PTV dosimetric parameters.
In the in-depth evaluation, VMAT exhibited superior efficacy, with 43.9% of plans attaining an ‘Excellent’ rating for PTV coverage, outperforming both IMRT+VMAT (51·2%) and VMAT+IMRT (53·7%). This assessment employed a stringent plan quality classification system based on mean (μ) and standard deviation (σ), categorising plans as ‘Excellent’ (< μ - σ), “Good” (μ – σ to μ), “Average” (μ to μ + σ) or “Poor” (> μ + σ). The correlation analysis depicted in Figure 3 also uncovers intriguing trends in additional parameters, such as COI, UI and HI, where moderate positive correlations were noted, while CI exhibited negative correlations for certain techniques. A particularly noteworthy observation was VMAT’s consistent performance, as it was the only method that did not yield any “Poor” PTV plans, whereas VMAT+IMRT had a 2·4% incidence of such plans. In terms of organ-at-risk (OAR) sparing, all methods demonstrated relatively low success rates, with only 14·6% achieving ‘Excellent’ status. Nevertheless, the majority of plans were classified as ‘Good,’ with VMAT leading at 48.8%, followed by IMRT+VMAT at 43·9% and VMAT+IMRT at 41·5%. The BODY D2cc parameter in Figure 3 exhibited varying correlation levels across the techniques, with V_IS showing a moderate positive correlation, while IMRT+VMAT_IS and VMAT+IMRT_IS displayed lower correlation values. VMAT’s superior performance was further substantiated by its lower thresholds for ‘Excellent’ classification (PTV: <1·0473, OAR: <0·8583). These results are consistent with prior research conducted by Virén et al. Reference Virén, Heikkilä, Myllyoja, Koskela, Lahtinen and Seppälä24 observed improved PTV coverage with VMAT. These findings indicate that VMAT could provide an ideal equilibrium between PTV coverage and the protection of OARs.
A comprehensive evaluation of OAR protection highlighted the unique benefits of VMAT in preserving lung tissue, evidenced by a significantly reduced average lung dose of 12·69 Gy and a V20Gy of 24·90%. Although VMAT exhibited favorable V35Gy values at 10·5%, its V5Gy measurement of 59·81% approached critical limits. Notably, the hybrid technique’s V5Gy of 56·69% may present a slightly safer option for patients at risk of radiation pneumonitis, as indicated by prior studies from Marks et al. Reference Marks, Yorke and Jackson25 and Yoo et al. Reference Yoo, Goodman and Cress26 In summary, VMAT offers considerable benefits in limiting high-dose exposure to the lungs while carefully addressing the potential for radiation-induced complications. Regarding cardiac protection, VMAT outperformed other methods, achieving a mean heart dose of 5·14 Gy and a V5Gy of 22·16%, which may contribute to a decreased risk of coronary events, as indicated by Darby et al.’s Reference Darby, Ewertz, McGale, Bennet, Blom-Goldman, Brønnum, Correa, Cutter, Gagliardi, Gigante, Jensen, Nisbet, Peto, Rahimi, Taylor and Hall3 research showing a 7·4% increase in risk per Gray of mean heart dose. Additionally, the reduced V25Gy and V35Gy values associated with demonstrate in Table 2 could further mitigate long-term cardiovascular risks (Taylor et al.) Reference Taylor and Kirby27 as demonstrated in Table 2.
The correlation analysis illustrated in Figure 3, along with the extensive OAR dosimetric parameters presented in Figure 4, offers valuable insights into the effectiveness of the treatment. The findings from the correlation analysis in Figure 4 reveal several significant observations across various anatomical structures: Figure 4(a) indicates strong positive correlations for dosimetric parameters of the left lung, particularly V35Gy, Dmean and V20Gy, with VMAT+IMRT demonstrating a notably high responsiveness to changes in Dmean (0.77) and V20Gy (0·71). Notably, VMAT exhibited a negative correlation for V5Gy (-0·33), suggesting that low-dose lung volumes are less significant in its planning. The analysis of heart parameters in Figure 4(b) showed that the IMRT+VMAT technique had the strongest correlations for Dmean (0·65) and V35Gy (0·60), while negative correlations for V5Gy were noted across all techniques (VMAT: -0·40, IMRT+VMAT: -0·27), indicating a reduced significance of low-dose heart volumes. Figure 4(c) emphasises VMAT’s moderate sensitivity to doses affecting the contralateral breast (0.48) and spinal cord (0.38), as well as the highest sensitivity to the right lung dose (0.36), while correlations for the oesophagus and thyroid were notably weak. Importantly, VMAT exhibited superior plan consistency, reflected in the lowest overall integrated score of 1.0931 and the smallest standard deviation of 0·2645. Regarding risk assessment, VMAT demonstrated lower risk levels for both cardiac (0·06 ± 0·040) and pulmonary (0·49 ± 0·072) complications when compared to hybrid techniques.
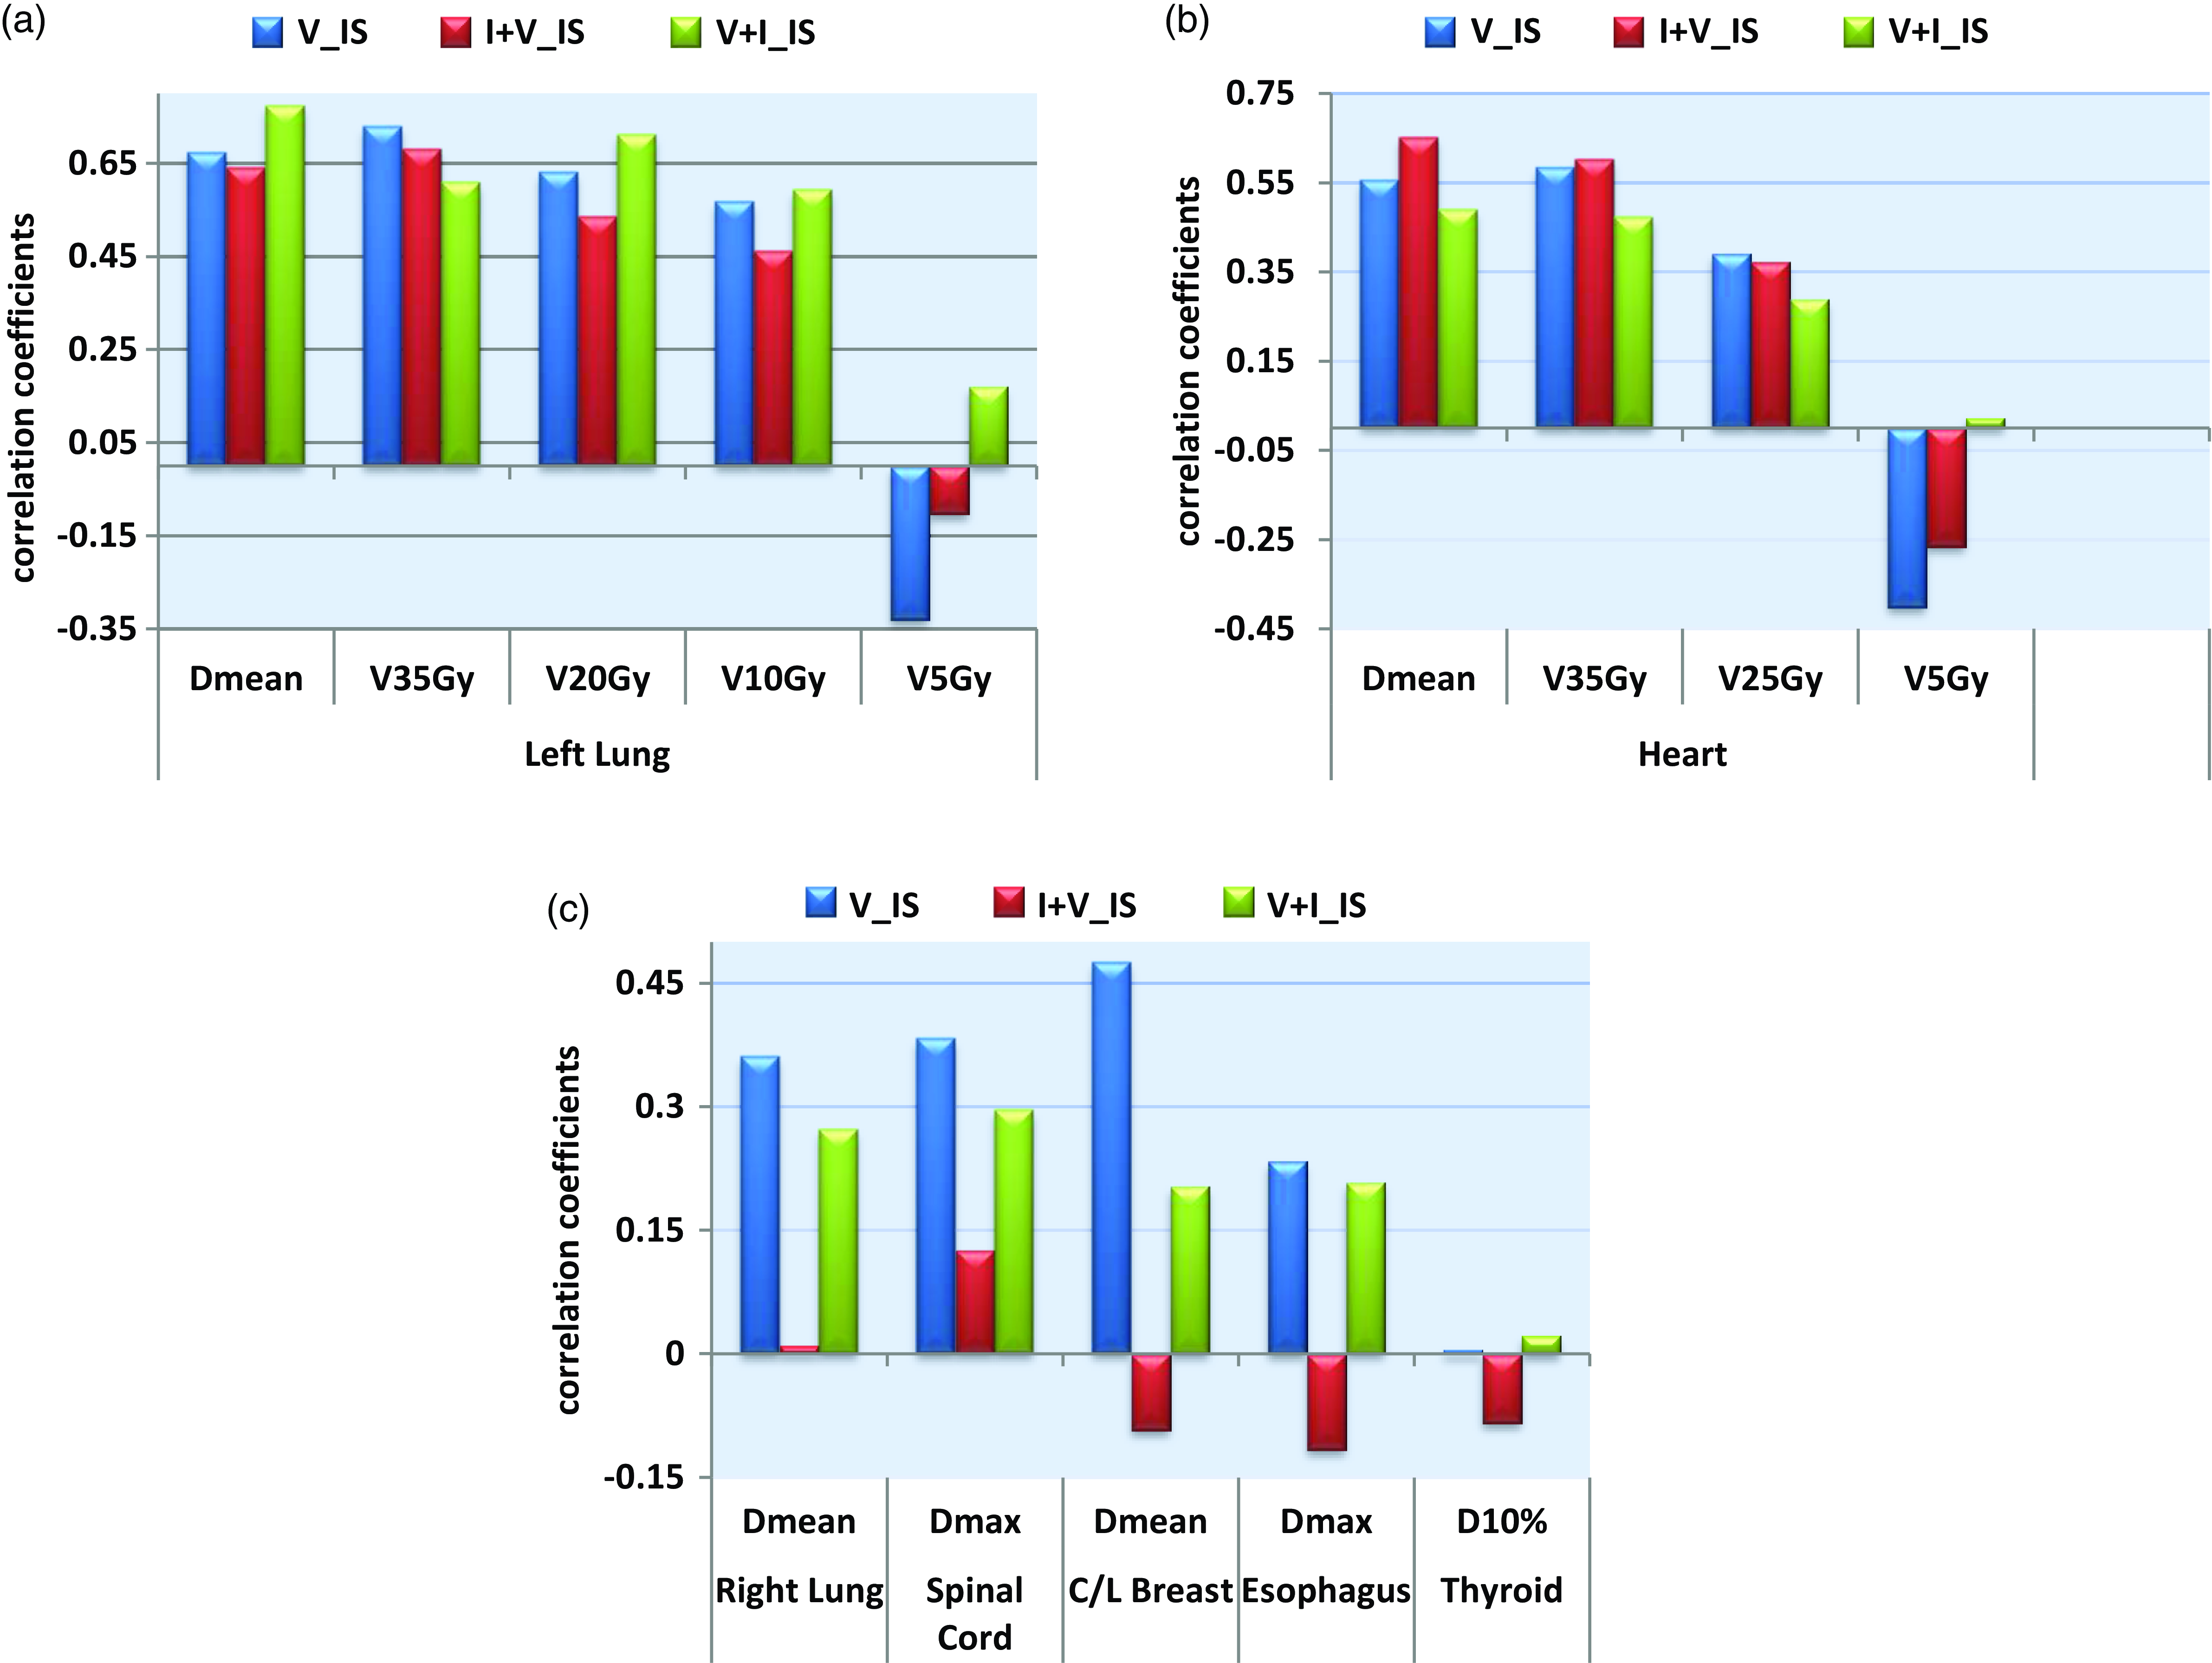
Figure 4. (a). Correlation coefficients between individual and integrated scores in the left lung. (b) Correlation coefficients between individual and integrated scores in the heart. (c) Correlation coefficients between individual and integrated scores in the OARs.
The analysis of correlation between integrated scores and RF indicated moderate correlations for heart RF (VMAT: 0·34, VMAT+IMRT: 0·29 and IMRT+VMAT: 0·53) and stronger correlations for lung RF (VMAT: 0·67, VMAT+IMRT: 0.75 and IMRT+VMAT: 0·55). It is crucial to highlight that VMAT produced higher integral doses for the right lung and the contralateral breast in comparison to hybrid techniques, as demonstrated in Table 5. This underscores the necessity for personalised treatment planning, especially for patients with pre-existing conditions or those at elevated risk for contralateral breast cancer. These extensive findings support the overall advantages of VMAT while recognising specific circumstances where hybrid methods may be more suitable.
Conclusion
The study results indicate that VMAT is the most advantageous radiotherapy method for left-sided breast cancer accompanied by regional nodal irradiation. This technique achieved optimal dosimetric performance, evidenced by the lowest gradient index (2.95) while consistently maintaining conformity and homogeneity indices. VMAT’s enhanced OAR sparing capabilities resulted in reduced mean doses to critical structures, particularly the heart and left lung, leading to a higher proportion of Good and Excellent treatment plans compared to hybrid approaches.
While the technique introduces marginally increased low-dose exposure to contralateral structures warranting patient-specific evaluation, its overall dosimetric advantages establish VMAT as the preferred treatment modality. The strong positive correlation between Gradient Index and integrated scores, especially in hybrid techniques, further validates VMAT’s effectiveness. Future research should focus on evaluating long-term clinical outcomes to validate these dosimetric benefits and refine patient selection criteria, ultimately optimising therapeutic outcomes in breast cancer radiation therapy.


 Open access