


Introduction
In 2015, Alzheimer disease and dementia were health outcomes of topmost concern for older adults living in the US and Europe (Cutler, Reference Cutler2015). The relatively high prevalence of Alzheimer’s disease and related dementias (ADRD), together with shifting demographics and an absence of disease-modifying treatments conspire to make ADRD a costly public health concern (Alzheimer’s Association, 2019; Hurd et al., Reference Hurd, Martorell, Delavande, Mullen and Langa2013). Research to support public health planning and knowledge accumulation regarding the economic, epidemiologic, sociologic, and psychological impact of ADRD requires high quality information on cognitive functioning of older and aging adults.
The Health and Retirement Study (HRS) has been collecting information on cognition using brief measures from more than 43,000 community dwelling older adults since 1992 (Sonnega et al., Reference Sonnega, Faul, Ofstedal, Langa, Phillips and Weir2014). HRS investigators previously conducted a focused dementia substudy known as the Aging, Demographics and Memory Study (Langa et al., Reference Langa, Plassman, Wallace, Herzog, Heeringa, Ofstedal, Burke, Fisher, Fultz, Hurd, Potter, Rodgers, Steffens, Weir and Willis2005; Plassman et al., Reference Plassman, Langa, Fisher, Heeringa, Weir, Ofstedal, Burke, Hurd, Potter, Rodgers, Steffens, McArdle, Willis and Wallace2008). A new dementia-focused substudy launched in 2016 (Langa et al., Reference Langa, Ryan, McCammon, Jones, Manly, Levine, Sonnega, Farron and Weir2020). The new cognitive assessment, named the Harmonized Cognitive Assessment Protocol (HCAP), was designed to create a new data resource to better assess the prevalence, determinants, and costs and consequences of mild cognitive impairment (MCI) and dementia in the US and to facilitate cross-national multidisciplinary studies of cognitive aging. The instrumentation was collaboratively assembled with leaders of international partner studies (IPS) implementing similar studies around the world and field leaders in cross-national cognitive epidemiology (Langa et al., Reference Langa, Ryan, McCammon, Jones, Manly, Levine, Sonnega, Farron and Weir2020; Meng et al., Reference Meng, Wang, Strauss, Langa, Chen, Wang, Qu, WeiKuang and Zhang2019). Currently, the HCAP has been fielded by 9 IPS, and 3 IPS are planning to put the HCAP in the field in the near future.
There are three anticipated uses of the HCAP in the HRS. First, the HCAP can be used to generate summaries of multiple domains of cognitive performance among older adults in a nationally representative population sample. Second, the HCAP can be used to evaluate measurement invariance in support of cross-national studies of adult cognition. Third, the HCAP can be used together with other relevant information to approximate clinically relevant states such as MCI and probable dementia. Each of these intended uses places different pressures on the decision-making process regarding the measurement of cognitive performance. We use latent variable models to describe how several cognitive performance tests measure a smaller number of cognitive domains. The results provide a framework for the three intended uses of the HCAP (summarizing multiple domains of cognitive performance, supporting cross-national studies of adult cognition, approximating clinically relevant states such as MCI and probable dementia). Latent variable modeling, and specifically factor analysis, invokes the following assumptions: (1) persons possess certain related but to some degree distinct cognitive capacities that are not directly measurable; (2) observed cognitive performance reflects the causal effect of these underlying cognitive capacities; (3) the selection of cognitive tasks in the battery and in our analysis is sufficient to reveal the hypothesized underlying domains; and (4) our modeling decisions regarding co-dependence of test performance data on underlying domains is a reasonable reflection of the true causal dependence. Even if these assumptions are false, our modeling results may be useful. Simplifying cognitive performance data on many tests that similarly reflect underlying domains provides a framework for the efficient description of cognitive performance. Cross-national studies must be concerned with measurement equivalence, and latent variable models provide a natural framework for exploring and characterizing differences due to language and culture. Finally, approximating cognitive states, for example those described by the Diagnostic and Statistical Manual of Mental Disorders (DSM-5) (American Psychiatric Association, 2013) require the demonstration of deficits among core neuropsychological processes, including learning and memory, executive function, language, perceptual-motor, and complex attention. Basing judgments on the presence or absence of deficits at the latent variable level, rather than the individual test level, is an approach that can be generalized to different studies with different batteries and generate more comparable results.
Methods
Participants
The HRS began in 1992 and is ongoing in 2022. The HRS was initially conceived as a study of health and wealth as adults approached retirement age. A stratified national probability sample of 12,652 adults aged 51–61 (birth years 1931–1941) was recruited in 1992. The content areas of the interview included health, cognition, income, wealth, family relationships, and factors relevant to retirement decisions. The sampling frame has been expanded by adding additional birth years every 6 years. Currently, the HRS represents cohorts born 1965 and before, and includes nursing home residents and has oversampled African-Americans and Hispanics. In 2006, the sample was randomly and evenly split to a telephone mode and an in-person, face-to-face mode. Thereafter, participants alternate mode at each subsequent biennial interview. The in-person face-to-face mode allows for expanded data collection. Following the 2016 wave a separate in-person interview was conducted with a more in-depth neuropsychological performance evaluation component: the HCAP.
As described more completely in Langa et al (Reference Langa, Ryan, McCammon, Jones, Manly, Levine, Sonnega, Farron and Weir2020), the HRS sample provided the sampling frame for the HCAP field study. Half of the HRS sample was randomly selected for participation in the HCAP, subject to some restrictions. Inclusion/exclusion criteria were only based on age and completion of the 2016 HRS core interview. Participation was restricted to those who completed the 2016 core HRS interview, and who did so when at least age 65 (birth year 1952 or earlier) (n = 5,001). Some of those identified for recruitment were never invited to HCAP (n = 576) as accrual goals were met prior to their invitation date. About 21% (n = 929/(5001-576)) of eligible and invited participants did not participate in the HCAP. For about 4% of those participating in HCAP (149/3496) only informant interviews were available. For these 149 participants, there were no non-missing observations on the cognitive indicators used in the present analysis, and these participants were not included. The analytic sample size for this study is therefore 3,347 persons (see Figure S3). Factors associated with non-participation are discussed in Langa et al.’s review of the HCAP (2020). Briefly, non-participants and participants were similar in terms of age, sex, race/ethnicity, educational attainment, and equally distributed across US Census regions. However, non-participants were more likely to be living in a nursing home (6% vs 3% among participants) and more likely to have participated in the HRS 2016 core via proxy (14% vs 6%). Participants provided written informed consent using procedures approved by the University of Michigan Institutional Review Board. The HRS and HCAP studies are conducted in accordance with the Helsinki Declaration.
Measures
The HCAP project and neuropsychological assessment battery have been described previously (Langa et al., Reference Langa, Ryan, McCammon, Jones, Manly, Levine, Sonnega, Farron and Weir2020; Weir et al., Reference Weir, McCammon, Ryan and Langa2014). The HCAP assessment battery includes items from several different tests. In Table 1, we detail the tests included in HCAP and the domain to which they were assigned. The HCAP includes items from brief mental status tests including the Mini-Mental State Examination (MMSE) (Folstein et al. Reference Folstein, Folstein and McHugh1975), the Telephone Interview for Cognitive Status (TICS) (Brandt et al. Reference Brandt, Spencer and Folstein1988), and the Community Screening Instrument for Dementia (CSI-D) (Hall et al., Reference Hall, Gao, Emsley, Ogunniyi, Morgan and Hendrie2000; Hall et al., Reference Hall, Hendrie, Brittain, Norton, Rodgers, Prince, Pillaym, Blue, Kaufert and Nath1993). Elements from neuropsychological tests and batteries are also included. Additionally:
-
from the Consortium to Establish a Registry for Alzheimer’s Disease (CERAD) battery (Morris et al., Reference Morris, Heyman, Mohs, Hughes, van Belle, Fillenbaum and Clark1989), a 10 item word list learning, delayed recall, and recognition of a word list, and constructional praxis, the immediate and delayed copying of figures (four geometric forms: circle, overlapping rectangles, diamond and cube);
-
Timed backwards counting from the Brief Test of Adult Cognition by Telephone (BTACT), and used in the MIDUS (Midlife in the US) study (Lachman et al., Reference Lachman, Agrigoroaei, Tun and Weaver2013), which assesses how low a participant can count starting from 100 in 30 seconds;
-
Animal naming, adapted from the Woodcock Johnson-III (WJ-III) Tests of Achievement (Woodcock et al., Reference Woodcock, McGrew and Mather2001), which asks participants to name as many animals as possible in 1 minute (Schrank & Flanagan, Reference Schrank and Flanagan2003; Weir et al., Reference Weir, McCammon, Ryan and Langa2014);
-
Symbol Digit Modalities Test (SDMT) (Smith, Reference Smith1982), that asks the respondent to substitute a number for geometric figures using a key under a 90 second time limit;
-
Trail Making parts A & B, which was included in the Army Individual Test (Armitage, Reference Armitage1946), involves tracing lines among sequentially numbered nodes (part A) or alternating numbered and letter-labeled notes (part B) within a 300 second time limit for each part;
-
Raven’s Standard Progressive Matrices (Raven, Reference Raven1981) as adapted for studies of cognitive aging based at Rush University (Wilson et al., Reference Wilson, Mendes De Leon, Barnes, Schneider, Bienias, Evans and Bennett2002), wherein respondents are shown a series of 17 illustrations of geometric shapes and patterns and are asked to identify the missing picture from among six to eight choices;
-
The HRS Number Series task (Fisher et al., Reference Fisher, McArdle, McCammon, Sonnega and Weir2014). The Number Series task used in the HRS was adapted from measures used in the WJ-III Cognitive Abilities Assessment (Fisher et al., Reference Fisher, McArdle, McCammon, Sonnega and Weir2014). The test measures the ability to reason with concepts that depend upon numerical relationships (quantitative reasoning). Respondents are presented with a series of numbers and a blank indicating a number missing from the series (e.g., “6 7 [ ] 9"). The respondent must determine the numerical pattern and then provide the missing number (e.g., “8") in the series. In HRS, the number series task is administered in an adaptive fashion, as described in Fisher et al (Reference Fisher, McArdle, McCammon, Sonnega and Weir2014). The resulting score is based on a Rasch (Reference Rasch1960) measurement model using the items administered and item parameters derived from a separate calibrations sample. The score is standardized to a typical metric used in the WJ-III test battery, called a W score. On this score, a value of 500 is the expected average score for the calibration sample, and a 10 point difference on the W-score metric represents a halving or doubling of the probability of a correct response to a given item (Fisher et al., Reference Fisher, McArdle, McCammon, Sonnega and Weir2014);
-
A letter cancellation task developed by the National (UK) Survey of Health and Development (NSHD) used in the British 1946 Birth Cohort Study (Richards et al., Reference Richards, Kuh, Hardy and Wadsworth1999) and the English Longitudinal Study of Aging (Steptoe et al., Reference Steptoe, Breeze, Banks and Nazroo2013);
-
Immediate and delayed verbal memory was assessed with two story recall tasks. The East Boston Memory Test (EBMT) (Scherr et al., Reference Scherr, Albert, Funkenstein, Cook, Hennekens, Branch, White, Taylor and Evans1988), also referred to as the Brave Man story, is a short story (three sentences) that is read to participants. Immediately after, and again after a delay, respondents are asked to recall twelve details from the story;
-
The HCAP also included Logical Memory I & II from the Wechsler Memory Scale (Wechsler, Reference Wechsler1987). Note that sections from the WMS-R are not the newer versions to maintain comparability with other field studies of cognitive aging. Like the EBMT, participants are read a story, but respondents are asked to recall the story verbatim (LM-I) and after a 20 to 30-minute delay (LM-II). Respondents are also presented with a recognition task regarding the story.
Table 1. Health and Retirement Study (HRS) Harmonized Cognitive Assessment Protocol (HCAP) cognitive performance tasks, initial domain assignment, observed score ranges, and analytic variable definitions

Note. The order of tests and indicators in Table 1 is according to initial domain assignment, rather than order of administration. Abbreviations: BTACT, Brief Test of Adult Cognition by Telephone; CERAD, Consortium to Establish a Registry for Alzheimer’s Disease; CSI-D, Community Screening Instrument for Dementia; EBMT, East Boston Memory Test; MMSE, Mini-Mental State Examination; NHSD, National Survey of Health and Development; SDMT, Symbol Digit Modalities Test; T, time in seconds; TICS, Telephone Interview for Cognitive Status; WJ-III, Woodcock Johnson III; WMS, Wechsler Memory Scale.
† Variables with fewer than 10 response levels treated as categorical in analytic models, all other indicators treated as continuous and normalized to a 0–1 scale given sample observed minimum and maximum prior to factor analysis;
‡ categories with sparsely populated cells are collapsed as indicated.
The HCAP was offered in both English (95% of completed HCAP) and Spanish (5% of completed HCAP), but no other languages. Some instruments or tasks from instruments had Spanish language versions available from the test publisher (MMSE, WMS, CERAD, SDMT, Raven’s Standard Progressive Matrices, Trail Making) while others were translated. Translations were completed collaboratively by HRS/HCAP investigators and investigators affiliated with the Mexican Cognitive Aging Ancillary Study (Mex-Cog) study, a sub-study of the Mexican Health and Aging Study, and discussed by Mejia-Arango et al., (Reference Mejia-Arango, Nevarez, Michaels-Obregon, Trejo, Mendoza-Alvarado, Sosa-Ortiz and Wong2020), especially the EBMT. Other translations were performed by HRS investigators, completed for prior waves of the HRS or for the current HCAP field study, and included tasks from the TICS, Woodcock-Johnson III tasks, HRS Number Series, letter cancellation, backwards counting task from the BTACT, and items from the CSI-D. Interviewers were trained to skip a test or to be flexible in administration to accommodate sensory impairments or physical limitations.
For our modeling we selected 29 indicators (items) capturing responses to tasks contained in 12 distinct instruments in the HCAP. Specific details are presented in Table 1, organized according to eight domains. Initial assignments of items to domains proposed by an expert committee of HRS and ISP investigators (Weir et al., Reference Weir, McCammon, Ryan and Langa2014) and revised as a starting domain structure for the present analyses. In addition to the analytic variables summarized in Table 1, we also considered error scores on letter cancellation, symbol digit, and animal fluency. However, after initial descriptive analyses revealed these indicators were extremely skewed and demonstrated very low absolute correlation with other indicators (maximum of r = .26), these error scores were removed from the analytic model.
Analytic approach
The goal of the analyses was to develop and evaluate latent variable models that inform the measurement of broad domains of cognitive performance measured with the HCAP battery. Our process included (1) descriptive analyses to inform analytic sample inclusion and variable definitions (Table 1), (2) single factor models, approached as confirmatory factor analysis (CFA) within a priori defined domains, (3) correlated factors models, approached as a CFA attempting to fit a multidimensional factor model, (4) second-order factor models, approached as a CFA with multiple specific and one general latent variable, and (5) estimation of factor score estimates for HRS/HCAP participants. The general sequence of model steps is illustrated in Supplementary Figure S1.
The purpose of the single factor models is to assess whether domains specified a priori form reasonable latent variable models as hypothesized. The results of these models are not expected to be unambiguously successful, as some factors are measured with only 2 or 3 indicators, and are just identified (have a unique solution) or identified only with the imposition of modeling constraints (Brown, Reference Brown2006). The correlated factors models address whether the a priori specific domains are measured distinctly by the tests included in HCAP. Because our goal was to define a relatively smaller number of a priori defined cognitive domains – relative to the number of included neuropsychological tests – it would have been sufficient for our purposes to stop our modeling with the description of adequately fitting single factor models. Using the HCAP battery to define a small number of domains to operationalize neurocognitive impairment criteria was one of the main goals of this analysis. The second-order factor model, a model nested within the correlated factors model, specifies a single common general cognitive performance trait underlies the specific domains. This model, if adequately fitting in the HCAP data, could be useful for descriptive analyses and for cross-national linking and comparison (Nichols et al., Reference Nichols, Cadar, Lee, Jones and Gross2022).
Latent variable measurement models, or CFA models, were estimated using Mplus software (version 8.2, Muthén & Muthén, Los Angeles CA). We used three different estimators: least squares, maximum likelihood, and Bayesian. We used the weighted least squares estimator with mean and variance standardization (WLSMV) and theta parameterization to evaluate proposed and alternative factor models. Because our indicators included categorical variables, this is the only of the three estimators for which conventional model fit statistics are available. Because the least squares estimator relies upon a pairwise complete missing data handling strategy that invokes unreasonable assumptions about missing data, we use robust maximum likelihood (MLR) estimators to obtain final parameter estimates and expected a posteriori (EAP) factor score estimates, which involves the less restrictive conditionally random missingness assumption. We use Bayesian estimation to obtain factor score estimates as plausible values (PVs), which are draws from the model-implied posterior distribution of factor scores for each individual. Factor indicators were treated as continuous or categorical as indicated in Table 1. We only moved to multidimensional models after a satisfactorily fitting unidimensional model within a pre-specified domain was achieved. Specific methods factors, uncorrelated with domain or general factors, were specified a priori to capture item-level residual covariance when indicators derived from the same stimulus (e.g., immediate and delayed recall of a common word list, short story, or design set) (Reise, Reference Reise2012). The correlated factors models were specified following a simple structure implied by the single factor models. Factor models were identified by freely estimating the factor variance and all but one of the factor loadings. Model fit was evaluated with the standardized root mean square residual (SRMR), confirmatory fit index (CFI), and root mean squared error of approximation. Greatest weight was afforded the SRMR and an examination of model residuals. The SRMR is an absolute measure of model fit and suggests the value of the average residual for the model-implied correlation matrix given the observed correlation matrix. We considered a model to fit satisfactorily if the SRMR was less than or equal to 0.08 (Asparouhov & Muthén, Reference Asparouhov and Muthén2018; Hu & Bentler, Reference Hu and Bentler1999). We also considered two model fit statistics derived from the model χ2: the CFI (a relative or incremental fit index, meaning the target model is compared to a null or baseline model) and the RMSEA (an absolute fit index, meaning no comparison to a null or baseline model). Both the CFI and RMSEA reward more parsimonious models. We used CFI values of at least 0.95 and RMSEA values of less than 0.05 (Hu & Bentler, Reference Hu and Bentler1999) to indicate satisfactory model fit. Because the CFI and RMSEA are known to be sensitive to the number of parameters estimated (Kenny et al., Reference Kenny, Kaniskan and McCoach2015), and our model designs are largely determined a priori, we gave the greatest emphasis to the SRMR in adjudging model fit. When misfit was identified, we explored the inclusion of omitted paths and dropped indicators with weak loadings or other identified problems (e.g., high residual correlation with other indicators, suggesting lack of conditional independence) in attempts to resolve identified issues.
Related to model fit, we report an internal consistency reliability coefficient for our latent variable factor models: MacDonald’s omega (ω t ). Omega is interpreted as is Cronbach’s internal consistency coefficient alpha. We computed omega as the sum of factor loadings, squared, divided by the sum of factor loadings, squared, plus the sum of the indicator residual variances (Peters, Reference Peters2014). Reliability of 0.70 is typical for early measurement development work, but should be at least 0.80 for group differences research, and 0.90–to 0.95 is the preferred standard for individual-level inference (Nunnally & Bernstein, Reference Nunnally and Bernstein1994).
We estimated factor scores using Mplus and the MLR estimator. The MLR estimator has more advantageous missing data handling than the least squares estimator and will generate estimates of the latent trait for respondents with at least 1 non-missing indicator. MLR factor score estimates are EAP factor score estimates. EAP factor score estimates are similar to regression method factor scores when all indicators are continuous. Each response pattern (i.e., the vector of item responses for an individual participant) has a distinct EAP factor score associated with it. The EAP estimate is the average of the posterior distribution of ability given the observed response pattern and estimated measurement model parameters. We compare these EAP factor score estimates to factor scores estimated as Bayesian PV. Bayesian PVs are draws from the posterior distribution of the latent trait determined for a participant given their response pattern and the estimated measurement model. PV are centered on the EAP estimate but have a level of variability that reflects the level of precision of the model. The comparison of EAP and PV can give insight into the level of precision of the measurement across the range of the latent trait.
Data and code availability
The source variables used in this analysis are publicly available at the HRS website (http://hrsonline.isr.umich.edu/index.php?p=shoavail&iyear=ZU ). Full details on distributions, data handling, and analytic models are available on GitHub (https://github.com/rnj0nes/HCAP).
Results
Characteristics of the HCAP sample used in this analysis
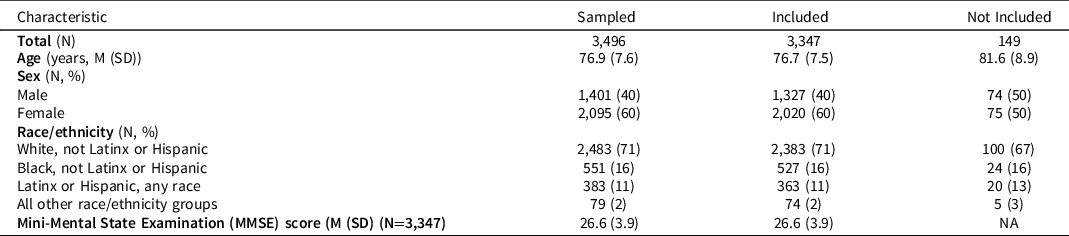
Characteristics of the HRS respondents randomly selected for the HCAP sample and included in this analysis (not missing on at least one of the cognitive performance tasks) are shown in Table 2. The range of MMSE scores was 0–30 with a mean of about 27 and standard deviation of 3.9; about 11% (n = 384/3347) had a total score less than 23.
Table 2. Characteristics of sample who participated in HCAP interview and who were evaluated in this study
Single factor models
Single factor models are summarized in Table 3. Three hypothesized domains had only two indicators (orientation, memory: recognition, and visuospatial; models I, IIC, and VI, Table 3). These models were identified by forcing the two factor loadings to be equal to 1, and a variance parameter for the latent variable was estimated (as were residual variances for continuous factor indicators and indicator means/thresholds). As specified, these models have 0 degrees of freedom and will generate fit statistics that indicate perfect fit. However, this perfect fit is misleading, as we have merely estimated a covariance parameter rather than measured a latent dimension. Similarly, factor models with 3 indicators (set shifting, model III, Table 3) were identified estimating 2 factor loadings and one latent variable variance (and residual variances for continuous indicators and indicator means/thresholds) and this specification produces a just-identified model with 0 degrees of freedom.
Table 3. Summary of single factor domain-specific models
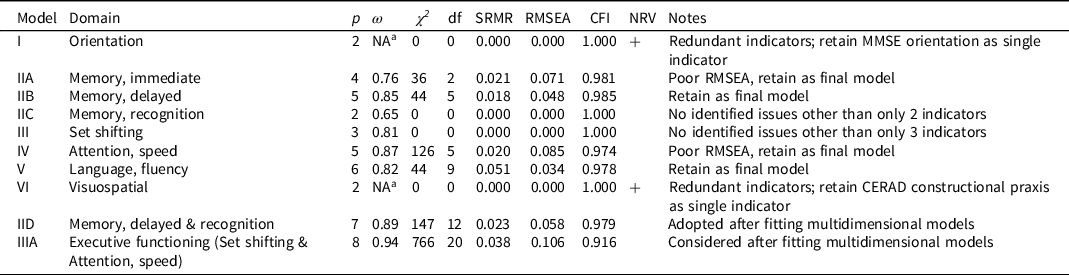
Note. Abbreviations: p, number of indicators, ω, MacDonald’s omega; χ 2 model chi-square, df, degrees of freedom; SRMR, standardized root mean square residual (≤ 0.08 satisfactory for); RMSEA, root mean square error of approximation (< 0.05 satisfactory fit); CFI, confirmatory fit index (>0.95 satisfactory fit); NRV, negative residual variance; MMSE, Mini-Mental State Examination; CERAD, Consortium to Establish a Registry for Alzheimer’s Disease.
a Omega estimate greater than 1.0, an out-of-bounds estimate due to negative residual variance.
The orientation model (model I, Table 3) had only two indicators, and was specified as described above to produce a just-identified model. This model fit well, as it must, but the results revealed a problem. As can be seen in Table 3, one of the items was estimated with a negative residual variance, a standardized measurement slope (i.e., factor loading) of greater than 1, and the computed ω coefficient was greater than 1. These inadmissible values suggest that the linearity assumptions imposed by the model are unreasonable. We determined that the most plausible explanation for this was that beyond the MMSE orientation to time and place questions, the ability to name the president offered no new information relevant to the underlying trait. Based on these results we opted to drop name president item.
The memory: immediate episodic single factor model (model IIA, Table 3) included 4 indicators and had 2 degrees of freedom. The model had reasonable reliability (judged by ω) for group level inference (Nunnally & Bernstein, Reference Nunnally and Bernstein1994) and fit well by SRMR and CFI, but not RMSEA. The RMSEA is known to be a poor indicator of model fit in low degree of freedom models. We retained this model as a satisfactorily fitting model.
The memory: delayed episodic single factor model (model IIB, Table 3) included 5 indicators and had 5 degrees of freedom. The model had relatively high reliability (judged by ω), close to the level suitable for individual-level inference (Nunnally & Bernstein, Reference Nunnally and Bernstein1994) and fit well by all fit criteria (SRMR, CFI, and RMSEA). We retained this model as a satisfactorily fitting model.
The memory: recognition single factor model (model IIC, Table 3) had only 2 indicators, and must fit perfectly. We identified no evidence of inadmissible parameter estimates. The factor reliability (ω) was relatively poor, which cannot be surprising for a two-indicator model. We decided to retain this model as a satisfactorily fitting model as there was no way to improve it.
The set shifting factor model (model III, Table 3) had 3 indicators, and as we specified the model it was just identified with zero degrees of freedom and consequently fit perfectly. No modeling pathologies were identified. The model had reasonable reliability (judged by ω) for group level inference (Nunnally & Bernstein, Reference Nunnally and Bernstein1994). We retained this model as a satisfactorily fitting model.
The attention, speed factor model (model IV, Table 3) included 5 indicators and had 5 degrees of freedom. The model had relatively high reliability (judged by ω), close to a level suitable for individual-level inference (Nunnally & Bernstein, Reference Nunnally and Bernstein1994) and fit well by SRMR and CFI, but not by RMSEA. We retained this model as a satisfactorily fitting model.
The language, fluency single factor model (model V, Table 3) included 6 indicators and had 9 degrees of freedom. The model had reasonable reliability (judged by ω) for group level inference (Nunnally & Bernstein, Reference Nunnally and Bernstein1994) and good fit was suggested by all fit criteria (SRMR, CFI, and RMSEA). We retained this model as a satisfactorily fitting model.
The visuospatial model (model VI, Table 3) had only two indicators and was specified as described above to produce a just-identified model. This model must fit well by standard fit criteria, but as with the orientation model we identified an item with a negative residual variance, a standardized measurement slope (i.e., factor loading) of greater than 1, and the computed ω coefficient was greater than 1. These inadmissible values suggest that the linearity assumptions imposed by the model are unreasonable. The most plausible explanation for this was that beyond the CERAD constructional praxis questions, which ask the respondent to copy 4 geometric figures, asking the respondent to copy 1 additional diagram from the MMSE provides no unique information. Based on these results we opted to drop the MMSE copy polygons task from the HRS/HCAP indicator set.
Multidimensional models
Multidimensional models are summarized in Table 4. The first set of models (VII and VIII) specified a correlated factors model (model VIII is depicted in Figure 1, panel A). These models included 27 indicators, omitting the TICS name president and MMSE copy polygons as described above. Consequently, orientation and visuospatial factors were included with single indicators. The remaining factors retained the loading pattern implied in Table 1 and evaluated in the single factor models (Table 3). A comparison of model VII and VIII indicates the importance of including methods factors. The methods factors load only in the items reflecting shared content and are forced to be uncorrelated with each other and with the common factors, impart a significant improvement in model fit (change in model χ 2 (df) = 3,174 (5)).
Table 4. Summary of multidimensional models

Note. Abbreviations: p, number of indicators; m, number of common latent variables (excluding methods factors and single indicator factors); χ 2 model chi-square, df, degrees of freedom; SRMR, standardized root mean square residual (≤ 0.08 satisfactory fit); RMSEA, root mean square error of approximation (< 0.05 satisfactory fit); CFI, confirmatory fit index (>0.95 satisfactory fit); NPD, non-positive definite covariance matrix for latent variables.

Figure 1. Summaries of model structure for models VIII, X, and XI. Figure 1 displays structure and model fit information for model VII (Panel A) displays a correlated factors model will all initially included indicators), model X (Panel B, correlated factors model removing immediate episodic memory and using a single factor for delayed and recognition memory and a single factor for set shifting and attention/speed), and Model XI, (Panel C) a second-order factor model based on Model X. Abbreviations: ORI, orientation; MEI, immediate episodic memory; MDE, delayed episodic memory; MRE, recognition memory; SS, set shifting; ASP, attention/speed; LFL, language and fluency; VIS, visuospatial; MEM, memory; EXF, executive functioning; GCP, general cognitive performance; SRMR, standardized root mean squared residual; RMSEA, root mean squared error of approximation; CFI, confirmatory fit index; TICS, Telephone Interview for Cognitive Status; MMSE, Mini-Mental State Examination; HRS, Health and Retirement Study; CSI-D, Community Screening Instrument for Dementia; SDMT, Symbol Digit Modalities Test.
While model fit for model VIII is satisfactory according to the SRMR, the CFI and RMSEA suggest the model could be improved. CFI and RMSEA reward parsimony, and our pattern of model fit results could signal the model is overly complex. Evidence for excess model complexity is revealed by examining the model-implied correlation matrix for the latent variables (Table S1). The factor correlations range from 0.33 (visuospatial with orientation) to 0.95 (memory immediate episodic with memory delayed episodic). The very high correlation of immediate and delayed episodic memory, even after accounting for the shared methods, implies that the two factors share 90% of their variance. Of 28 factor correlations among the 8 latent factors, 8 were estimated at .9 or higher. Included among this set were the correlations among the three memory factors (immediate, delayed, recognition, mean r = .92), the set shifting and attention, speed factors (r = .94). Interestingly, the language factor was also highly correlated with the memory domains (immediate r = .94; delayed r = .88; recognition r = .84).
Because in model VIII immediate episodic memory (MEI in Figure 1, panel A) was very highly correlated with delayed episodic memory and language and fluency, we made the decision to drop the items assessing immediate episodic memory from the factor model. As a consequence, our subsequent models (models IX and X in Table 4, and Panels B and C of Figure 1) are no longer nested within the previous multidimensional models and differences in model fit statistics (e.g., χ 2) are not comparable. Moreover, it is worth pointing out that we are not reducing the length of the HCAP battery because we must still ask participants the immediate recall questions in order to assess delayed recall and recognition. We also treated the indicators of delayed episodic memory and recognition memory as indicators of a single memory factor (model IX). This modification was motivated by the high correlation (.91) of these two specific factors in the multidimensional model and the presence of only two indicators for recognition memory. Additionally, we combined the set shifting and attention, speed factors into a single factor labeled executive functioning. This modified model (model X, Table 4) fit reasonably well against standard thresholds of model fit according to SRMR, RMSEA, and CFI (0.047, 0.046, and 0.945, respectively).
We also wanted to evaluate the fit of a second-order factor model based on our final multidimensional model (Figure 1, panel C). We expect the second-order factor model will be useful for harmonization with other of the IPS, especially if partner studies do not include all of the items or subtests within a domain and/or if investigators wish to test the assumption of measurement invariance across IPS (Nichols et al., Reference Nichols, Cadar, Lee, Jones and Gross2022). Results of this model fit are shown in Table 4 (model XI). This model estimates five fewer parameters, but the cost to model χ 2 is 259, suggesting a significant reduction in model fit. Nevertheless, the model returns similar estimates as for model X for SRMR (0.049), RMSEA (0.049), but (as with Model X) the CFI falls below typical thresholds for adequate fit (CFI = 0.935).
Factor score estimation
We obtained factor score estimates using the EAP method and Bayesian PVs (Asparouhov & Muthén, Reference Asparouhov and Muthén2010). Estimates were derived from the single factor models for specific domains (corresponding to models IID, IIIA, V, Table 3), and from the second-order model for the general domain (model XI, Table 4). Results of these procedures are illustrated in Supplement Figure S2, which illustrates the density of EAP factor score estimate (black line) and the density of PVs (gray-filled density). What is interesting to note is where the EAP density is less than the PV density. These regions of the latent trait indicate areas where the standard error of measurement is high, or the reliability is low, for the estimated latent trait level.
As can be seen in Supplement Figure S2, the memory, executive functioning, and the general cognitive performance latent trait estimates seem reasonably precise across the range of cognitive ability. The range of ability is based on the standard normal distribution. The values for language/fluency are less precise, particularly in the tails of the distribution. This is not surprising given this domain is comprised mostly of components with two or three response categories, except for animal naming. This specific domain was also the one with lowest reliability (Table 3).
Discussion
We applied factor analysis methods to a pre-selected set of neuropsychological performance indicators included in the HCAP battery of tests fielded by the HRS in 2016. Using an a priori conceptualization of the structure of the cognitive tests, we conducted a set of analyses guided by model fit and parameter estimates to derive a model of reasonably well-fitting domains of cognitive performance in a general and broadly inclusive sample of community dwelling older adults. Our final measurement model maps well on to well-characterized domains of memory, executive functioning, language/fluency, and visuospatial functioning.
Limitations of our approach and results are worth mentioning. Firstly, we commenced our analysis with a definite view as to the structure we were likely to observe among the tests included in the HCAP battery. While we allowed some aspects of model fit and factor correlation to drive final model structure, it is likely that if we had started with a different set of assumptions, made different decisions about which scores from tests to include, how to treat those variables analytically, or followed a more exploratory factor analysis method, we may have settled on a different factor structure in our final models. One of the strengths of basing this research within the HRS is that the data are public access and as such other investigators can obtain the source variables and derive alternative solutions. Another limitation is that our analysis does not make use of complex sampling weights, as these were not defined for the HCAP sample at the time of analysis. It will be important to replicate these results when those sampling weights are available.
As a final limitation, readers are reminded that factor structures based on a general community sample, in which most participants are functioning within the range of cognitively normal, may not translate to clinical or impaired populations (c.f., Delis et al., Reference Delis, Jacobson, Bondi, Hamilton and Salmon2003). It is likely that far more creative and informative use of the extensive HCAP battery could be used to identify persons with an existing or developing cognitive disorder.
In terms of utility for identifying persons with probable dementia within a DSM-5 neurocognitive disorder framework, our results hold promise. We have identified 5 domains of functioning (orientation, memory, executive functioning, language/fluency, visuospatial). While two of these domains are assessed with single items. The remaining 3 are assessed with multiple items and have high reliability on the basis of the omega coefficient, but the marginal reliability (as indicated by the standard error of measurement) around 2 standard deviations below the mean is 0.83 for memory, 0.92 for executive, and 0.56 for language/fluency. These results are encouraging for executive and memory, but suggest the measurement of the language/fluency domain is in need of further development.
Supplementary material
To view supplementary material for this article, please visit https://doi.org/10.1017/S135561772300019X
Acknowledgments
This study was not preregistered.
Funding statement
The HRS is funded by the National Institute on Aging (DW, U01-AG009740), with supplemental funding from the Social Security Administration. The HCAP is funded by the National Institute on Aging (KL, U01-AG058499).
Conflicts of interest
The authors report no conflicts of interest.


 Open access