

INTRODUCTION
Decreasing sensory abilities (vision, hearing) are associated with age, comorbid diseases, decreased physical activity, and restriction of activities related to independent living (Daien et al., Reference Daien, Peres, Villain, Colvez, Carriere and Delcourt2014; Dutton, Reference Dutton2003; Lam et al., Reference Lam, Christ, Zheng, West, Munoz, Swenor and Lee2013; Olderbak, Hildebrandt, & Wilhelm, Reference Olderbak, Hildebrandt and Wilhelm2015). Interventions such as regular eye exams and correctly prescribed lenses can reduce symptoms of depression; increase engagement in reading, hobbies, and social activity; and improve general quality of life (Coleman, Yu, Keeler, & Mangione, Reference Coleman, Yu, Keeler and Mangione2006; Gauthier et al., Reference Gauthier, Reisberg, Zaudig, Petersen, Ritchie, Broich and Saeed2006; Owsley et al., Reference Owsley, McGwin, Scilley, Meek, Seker and Dyer2007). Many fewer studies have examined visual acuity (VA) relative to cognitive performance adjusting for potentially confounding variables including physical activity and cardiovascular disease risk factors (CVD-RFs) and events.
Cross-sectional and longitudinal studies have shown positive associations between visual impairments (VI) and decline in measures of general cognitive performance such as the Mini-Mental State Exam (Lin et al., Reference Lin, Gutierrez, Stone, Yaffe, Ensrud, Fink and Mangione2004; Rogers & Langa, Reference Rogers and Langa2010; Valentijn et al., Reference Valentijn, Van Boxtel, Van Hooren, Bosma, Beckers, Ponds and Jolles2005). However, several studies have shown positive associations between VI and chronic conditions such as diabetes mellitus (DM) and chronic kidney disease (CKD), possibly through their connections with hypertension, atherosclerosis, thrombosis, and inflammation (Creager, Lüscher, Cosentino, & Beckman, Reference Creager, Lüscher, Cosentino and Beckman2003; Matthews, Stratton, Aldington, Holman, & Kohner, Reference Matthews, Stratton, Aldington, Holman and Kohner2004; Semeraro et al., Reference Semeraro, Cancarini, dell’Omo, Rezzola, Romano and Costagliola2015; Wong et al., Reference Wong, Lamoureux, Cheng, Chui, Cheung, Tai and Sabanayagam2016).
Other studies have shown inverse associations between cognitive functioning and the presence of CKD and DM as well as a range of CVD-RFs (Crichton, Elias, Davey, & Alkerwi, Reference Crichton, Elias, Davey and Alkerwi2014; Robbins, Elias, Budge, Brennan, & Elias, Reference Robbins, Elias, Budge, Brennan and Elias2005; Torres, Elias, Seliger, Davey, & Robbins, Reference Torres, Elias, Seliger, Davey and Robbins2017). Of interest, with regard to CKD, it is the cognitive performance measures involving visual-spatial organization and scanning and tracking that appear to be the most sensitive to kidney function (Elias et al., Reference Elias, Elias, Seliger, Narsipur, Dore and Robbins2009; Torres et al., Reference Torres, Elias, Seliger, Davey and Robbins2017). Thus, it is also possible that VA is merely a marker for comorbid cardiovascular disease (CVD) rather than an independent predictor of cognitive performance. This is the first analysis of VA and cognitive performance using data from the Maine-Syracuse Longitudinal Study (MSLS) sample.
The primary objective of the present study was to investigate the cross-sectional and longitudinal associations between VA and cognitive performance. Unlike previous studies, we control for CVD when examining this association. Moreover, prior studies have not assessed these relationships with the breadth of cognitive measures which were used in each wave of the MSLS. The present study will assess these associations across six cognitive domains including a composite of global functioning based on 18 individual cognitive measures. We hypothesize that VA will be associated with multiple domains of cognitive functioning using both a cross-sectional and prospective design; and that these relations will be stronger for those cognitive domains that depend on vision or relate to visual-spatial abilities.
METHODS
Sample
Data for the present study were obtained from the sixth (2001–2006) and seventh (2006–2010) waves of the MSLS (https://umaine.edu/psychology/faculty/merrill-f-elias/msls-description/). The average follow-up time between waves was 4.62 years (SD=.58) as the goal was to repeat the study at approximately 5-year intervals. The MSLS is a community-based study of aging, hypertension and cognitive performance, with data gathered over a period of 35 years beginning in 1976. At wave 6 (Elias, Goodell, & Dore, Reference Elias, Goodell and Dore2012), the study moved away from its focus on uncomplicated essential hypertension and focused on CVD and cognition; thus a rich body of data on CVD-RFs and events were available for analyses at wave 6 and 7.
Participants were originally recruited from the Central New York State area via multiple media venues for studies of aging and cognitive function with no requirements for participation other than non-institutionalization, absence of diagnosed psychiatric disorder and/or alcoholism, and ability to speak English. In this and previous MSLS studies, additional exclusionary criteria have been included on a study-by-study basis. At wave 6, data necessary to examine a broad range of cognitive measures and CVD-RFs, including creatinine, plasma homocysteine (tHcy), and objective measures of physical function and VA were obtained for the first time. Details on blood sampling and assays may be found in Elias et al. (Reference Elias, Robbins, Budge, Elias, Brennan, Johnston and Bates2006).
For the present analysis beginning with 1081 participants, exclusions were as follows: acute stroke (n=33), probable dementia (n=7), or kidney dialysis (n=3) at either waves 6 or 7. Probable dementia was determined by MSLS cognitive data, diagnostic records, and medical interview data using criteria as described by the National Institute of Neurological Diseases and Communicative Diseases and Stroke/Alzheimer’s Disease and Related Disorders (NINCDS-ADRDA; Mckhann et al., Reference Mckhann, Knopman, Chertkow, Hyman, Jack, Kawas and Phelps2011). Acute stroke was defined as a focal neurological deficit lasting >24 hr and kidney dialysis by self-report or diagnostic records. Additionally, participants missing depressive symptom (n=30) or vision data (n=118) were excluded, leaving a cross-sectional sample of 890 participants. Participants residing outside of New York State were not re-enrolled for wave 7 follow-up due to changes in research funding limiting cognitive testing out of state, leaving a final sample of 655 individuals (73.5% retention).
All procedures performed in studies involving human participants were in accordance with the ethical standards of the institutional and/or national research committee and with the 1964 Helsinki declaration and its later amendments or comparable ethical standards and were approved by the University of Maine Institutional Review Board (reference number: 2005-07-04), and informed consent was obtained from all participants.
Cognitive Measures
Cognitive performance was assessed across six broad domains from the MSLS test battery described in numerous studies of cardiovascular risk factors and cognitive function (Crichton et al., Reference Crichton, Elias, Davey and Alkerwi2014; Crichton, Elias, Dearborn, & Robbins, Reference Crichton, Elias, Dearborn and Robbins2017; Elias et al., Reference Elias, Robbins, Budge, Elias, Brennan, Johnston and Bates2006). The subject protocol required participants to wear their prescription glasses/contacts during the battery. Subtests were organized into cognitive domains via factor analysis which identified four composites: Visual-Spatial Organization and Memory, Scanning and Tracking, Verbal Episodic Memory, and Working Memory. In later studies, an Executive Function composite was also added (Elias et al., Reference Elias, Robbins, Budge, Elias, Brennan, Johnston and Bates2006). An overall composite measure of Global cognitive functioning was derived by including subtests from all of these composites in addition to the WAIS Similarities subtest (abstract reasoning), which loaded equally across domains. Individual subtests were z-transformed and summed with other subtests in their respective domains.
Composite scores were again z-transformed after summation, resulting in continuous distributions with means of 0 and standard deviations (SD) of 1. Individuals with composite scores ≥1 SD below the mean were categorized as having a deficit in that area of functioning. Equal-weighting of scores is an established procedure for factor analysis and have been used in the Framingham Heart Studies (Cureton & D’Agostino, Reference Cureton and D’Agostino1993; Elias, Wolf, D’Agostino, Cobb, & White, Reference Elias, Wolf, D’Agostino, Cobb and White1993). See Table 1 for a list of cognitive subtests contributing to each cognitive domain.
Table 1 Descriptions of the cognitive tests contributing to each composite score indexing a cognitive domain
a Origin Wechsler Memory Scale-Revised.
b Origin Wechsler Adult Intelligence Scale III.
c Origin Wechsler Adult Intelligence Scale.
d Origin Halstead-Reitan Neuropsychological Test Battery.
Predictor
Line-scores from the Snellen Eye Test (SET; Snellen, Reference Snellen1868) were used as an estimate of VA. Due to the non-normal distribution of SET scores, this study uses natural, log-transformed scores to predict cognitive performance in linear regression models. Tests were presented in poster format at a distance of 20 feet in a well-lit room. Higher SET scores indicate poorer visual acuity. In separate analyses, VI was defined as poor VA, that is, visual raw scores of “40” (indicating 20/40 vision) or above. While this results in a less sensitive analysis of VA, categorical cutoff scores may be preferred in the clinical setting for clarity.
Basic Covariates
Age and education (from first year of elementary school) were coded as years attained, while sex (M/F) and ethnicity (African American versus other) were coded as binary variables.
Additional Covariates
Physical function was estimated with three timed-performance tasks, standing up from a hard-backed chair three times, walking and doubling back 10 feet, and turning 360°. Participants received one point for each task they were unable to complete or for which they scored in the slowest sample quartile. The resulting physical functional deficits measure ranged from zero to three for a maximum of one point per task. Variants of this objective measure of physical function have been shown to predict likelihood for institutional living as well as symptoms of depression (Dearborn, Robbins, & Elias, Reference Dearborn, Robbins and Elias2018; Gill, Williams, & Tinetti, Reference Gill, Williams and Tinetti1995).
The 20-item Center for Epidemiological Studies Depression Scale (CES-D; Radloff, Reference Radloff1977) was used as a self-report measure of depressive symptom severity with higher scores indicating higher levels of depressive symptoms (range: 0–80).
Self-reported family income was recorded, but 108 participants reported they would “would rather not answer” this item and it was dropped from final analyses. However, when included as a model covariate in a preliminary set of analyses, family income did not change the results below. Self-reported marital status was coded “1” (married or life partner) or “0” (single, divorced, widowed, or separated). Lastly, self-reported retirement status was coded “1” (retired) or “0” (not retired).
The CVD variable (one or more event versus zero events) was an aggregate of one or more of the following: history of myocardial infarction, transient ischemia attack (<24 hr), angina pectoris, coronary artery disease, and heart failure as obtained from medical interview and record review. Binary coding was chosen because there were too few individuals with two or more events to make scaling of multiple events meaningful.
DM (yes/no) was defined as having a fasting plasma glucose ≥126 mg/dL or treatment. CKD (yes/no) was defined as having an estimated glomular filtration rate (GFR) of<60 mL/min. GFR was estimated based on the following multiple regression formula (Levey, Bosch, & Lewis, Reference Levey, Bosch and Lewis1999) from Modification of Diet in Renal Disease Study: GFR (mL/min/1.73 m2)=175×(serum creatinine)−1.154 (age)−0.203×(0.742 if female)×(1.212 if African American). Continuous indices of systolic blood pressure (SBP) and diastolic blood pressure (DBP) were calculated as the average of 15 sitting, standing, and reclining measurements (five in each position). Hypertension status (yes/no) was defined as having a SBP≥140 mmHg, a DBP≥90 mmHg, or treatment for hypertension. THcy, C-reactive protein, and measures of cholesterol and triglycerides were assessed as continuous CVD-RFs and obtained through standard blood assay. Measures of obesity included continuous measurement of body mass index and waist-to-hip ratio, which were obtained by objective measurement without shoes or heavy clothing. Lastly, alcohol and cigarette consumption (continuous measurement of number of drinks and cigarettes/week) and status (current drinker or smoker: yes/no) were obtained by self-report.
Statistical Analyses
Covariate selection was determined first through theoretical relevance to visual and cognitive performance as indicated by Wong et al. (Reference Wong, Lamoureux, Cheng, Chui, Cheung, Tai and Sabanayagam2016) and then on an empirical basis; that is, to be considered as a model covariate, variables must have a zero-order correlation with both VA and cognitive performance (p<.10). After zero-order analyses, covariates were tested in backward elimination with basic demographics (age, sex, education, ethnicity) fixed across all models. Covariates were included in final models based on their unique contributions to model fit (R 2 change; p<.10) to preserve model parsimony.
Cigarette smoking was dropped from the models as a covariate due to a lack of association with cognitive performance (p>.10). DM, CVD, measures of cholesterol/triglycerides and obesity, C-reactive protein, DBP, and alcohol consumption were all associated with cognitive performance (ps<.05), but were dropped because of a lack of association with VA (ps>.10). Hypertension status, SBP, marital status, and retirement status were inversely associated with cognitive performance (ps<.001) and VA (Hypertension: p=.065; SBP: p<.01; marital status: p=.002; retirement status: p<.001) but were ultimately dropped from final models in backward elimination (R 2 change; p>.10).
Four final covariate sets (models) were used for analyses, with the first step being assessment of zero-order (crude) associations between wave 6 VA and cognitive performance (Model 1). Wave 6 covariates were included serially into the models as follows: (1) Basic demographic model (Model 2)=age, sex, education, and ethnicity; (2) Symptoms of depression/disability model (Model 3)=Basic Model 2+CES-D+physical functional deficits; and (3) CVD-RF model (Model 4)=Model 3+CKD+tHcy. Sensitivity analyses were conducted with both hypertension status and SBP separately added to Model 4 because of their theoretical relevance to vision and cognitive function.
First, we analyzed cross-sectional associations between wave 6 VA and cognitive performance. Next, we analyzed prospective associations between wave 6 VA and wave 7 cognitive performance. Lastly, associations between wave 6 VA and wave 7 cognitive performance were analyzed with adjustment for wave 6 cognitive performance to determine the predictive value of VA on changes in cognitive performance. We used multiple linear regression models to examine these associations with measures of continuous VA and continuous cognitive performance. We then used multiple logistic regression models for a parallel set of analyses using the measure of VI status as a predictor of cognitive performance deficits.
RESULTS
Demographics
Demographic and health characteristics by visual acuity status at wave 6 are presented in Table 2. At wave 6, the 13.4% (n=75) of individuals characterized as having VI were older, had lower rates of partnership and employment, had higher levels of functional deficit, and were less likely to smoke. Additionally, those with VI had significantly lower kidney function (EPI-GFR), a higher rate of CKD, and higher levels of tHcy and SBP.
Table 2 Demographic and health characteristics by vision status at wave 6
Note. Categorical variables analyzed with Fisher’s exact test.
a Equal variances not assumed.
+ p<.10, *p<.05, **p<.01, ***p<.001
Continuous VA as Predictor
Results of cross-sectional, prospective, and longitudinal change associations of continuous VA (higher scores represent poorer vision) and cognitive performance are presented in Table 3. For the cross sectional models adjusted for wave 6 covariates, poorer vision was inversely associated with cognitive performance with the exception of Verbal Episodic Memory. Furthermore, after adjustment for wave 6 covariates, poorer vision at wave 6 was prospectively associated with lower wave 7 cognitive performance across all cognitive domains. Lastly, after adjustment for wave 6 covariates and wave 6 cognitive performance (longitudinal analysis), poorer vision at wave 6 was associated with declines in Global cognitive performance, Visual-Spatial Memory and Organization, and Verbal Episodic Memory. However, poorer vision was not associated with declines in Working Memory, Scanning and Tracking, or Executive Function after adjustment for wave 6 covariates and cognitive performance.
Table 3 Raw regression coefficients for log-transformed visual acuity predicting wave 6 and wave 7 cognitive performance
Note. M1=Zero-order regression. M2=Basic model adjusted for age+sex+education+ethnicity. M3=Basic+CES-D+physical function. M4=M3+CKD+tHcy.
a Wave 6 visual acuity predicting wave 6 cognitive performance.
b Wave 6 visual acuity predicting wave 7 cognitive performance.
c Wave 6 visual acuity predicting wave 7 cognitive performance adjusted for wave 6 performance.
d Cognitive outcome measured continuously.
+ p<.10, *p<.05, **p<.01, ***p<.001.
VI Status as Predictor
Results of cross-sectional, prospective, and longitudinal change associations of VI status and cognitive deficits (Z-score ≤-1.00) are presented in Table 4. For these analyses, higher scores (1) represent impairment in VA and deficit in cognitive performance (as opposed to 0, no impairment/deficit). For cross-sectional models, VI was not associated with any cognitive deficits after adjustment for basic wave 6 demographic covariates. Furthermore, after adjustment for wave 6 basic covariates, VI at wave 6 was associated positively with wave 7 deficits in Visual-Spatial Organization and Memory and Executive Function. Similar to continuous VA change models, VI was significantly associated with increased risk of deficits for Visual-Spatial Organization and Memory and Executive Function, and marginally increased risk of deficits for Verbal Episodic Memory after full adjustment for wave 6 covariates and cognitive deficits. Estimated means for Visual-Spatial Organization and Memory, Verbal Episodic Memory, and Global cognitive performance by VI status are displayed in Figure 1 with full adjustment for Model 4 covariates.
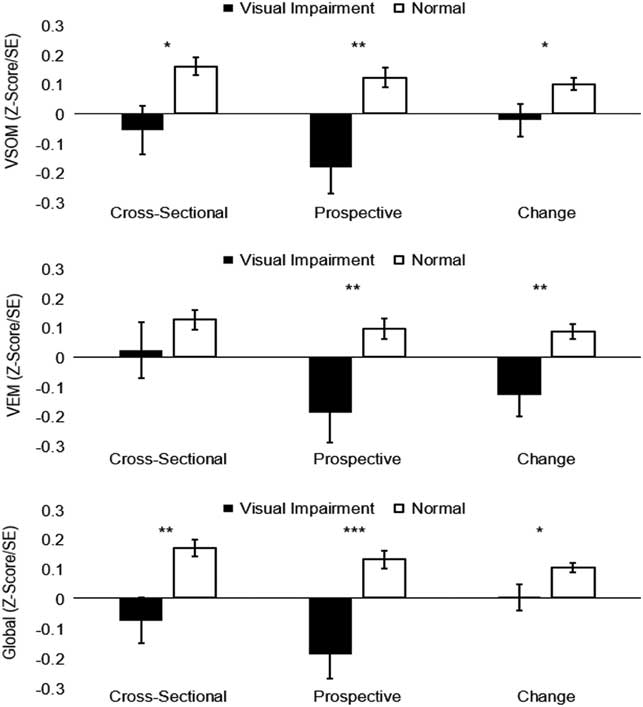
Fig. 1 Multivariate-adjusted means of cognitive performance by visual impairment status. * p<.05 , ** p<.01, *** p<.001. Displayed values adjusted for age, sex, education, ethnicity, CES-D, physical function, CKD, & tHcy. VSOM=Visual-Spatial Organization and Memory; VEM=Verbal Episodic Memory.
Table 4 Log-odds ratios for visual impairment predicting wave 6 and wave 7 cognitive deficit
Note. M1=Zero-order regression. M2=Basic model, adjusted for age+sex+education+ethnicity. M3=Basic+CES-D+physical function. M4=M3+CKD+tHcy.
a Wave 6 visual deficit predicting wave 6 cognitive deficit.
b Wave 6 visual deficit predicting wave 7 cognitive deficit.
c Wave 6 visual deficit predicting wave 7 cognitive deficit adjusted for Wave 6 deficit.
d Cognitive deficit reference group (Z-score≤-1.00).
+ p<.10, *p<. 05, **p<.01, ***p<.001.
Sensitivity Analyses
Continuous SBP and hypertension status were entered separately in the full CVD-RF Models (Model 4) and did not change the cross-sectional, prospective, or longitudinal change associations between VA/VI and cognitive performance/deficit (data not shown). Lastly, age×VA interaction terms (adjusted for main effects of VA and age) were added post hoc to all models due to the large age differences observed based VI status (MD=10.34 years). No significant differences in the effects of VA on concurrent, prospective, or changes in longitudinal cognitive performance were observed as a function of age (data not shown).
Attrition
Compared with those that did not return for follow-up analysis, the sample of participants who remained in the study at wave 7 had better VA (MD[log]=.08; 95% confidence interval [CI] [0.03, 0.14]; p=.004), fewer physical deficits (MD=0.28; 95% CI [0.11, 0.44]; p=.002), had marginally lower levels of depressive symptoms (MD=1.07; 95% CI [-0.05, 2.18]; p=.06), and 5.7% fewer non-white participants (95% CI [1.21, 10.29%]; p=.013). Participants were similar in terms of age, sex, education, and rates of CVD, CKD, and diabetes (ps>.10).
DISCUSSION
Poorer VA was associated with lower concurrent cognitive function as well as with approximate 5-year declines in cognitive function over a range of domains including a Global measure of cognitive performance, Visual-Spatial Organization and Memory, and Verbal Episodic Memory. This was true even adjusted for a range of demographic, psychological, and physical function variables as well as CVD-RFs.
We found that study participants with poor vision were nearly twice as likely to experience CKD (Table 2). Of interest, prior studies using the MSLS database have shown inverse associations between CKD and cognitive performance (Torres et al., Reference Torres, Elias, Seliger, Davey and Robbins2017). While it is possible that the associations between VA and cognitive performance are due to the action of shared cerebrovascular pathways associated with kidney dysfunction, VA remained a significant independent predictor of cognitive performance decline with adjustment for CKD, explaining 3.4% of the unique variance in Global functioning and 5.6% and 5.3% of the unique variance in Visual Spatial Organization and Memory and Verbal Episodic Memory, respectively. While this represents modest strengths of association, it should be noted that this study was conducted over a relatively brief period (approximately 5-years) compared with the much longer period encompassing the adult life span. Lastly, our analyses included individuals who were available for both wave 6 and wave 7 and who tended to have fewer physical deficits and better VA than those who were only available at wave 6. Due to this reduction of health variability, it is possible that the observed relationships between VA and cognitive decline are an underestimation of their true effect sizes.
We hypothesized that cognitive domains placing stronger demands on vision would have higher magnitude of associations with VA. However, VA measured continuously was associated with most domains for the cross-sectional analysis (at wave 6) and all domains for the prospective analysis (wave 6 predicting wave 7 outcomes). However, for the longitudinal analysis, adjusting wave 7 cognitive outcomes for wave 6 outcomes, we failed to find statistically significant associations between VA and change in performance for a task with heavy demands on vision, that is, Scanning and Tracking. It is possible that changes in processing speed, which is a central component of Scanning and Tracking, are unaffected by VA and that domains which require mental representation and manipulation of visual stimuli (i.e., Visual-Spatial Organization and Memory) are more greatly impacted, but replication of these results is needed to support this speculation.
We also found that VA was significantly associated with changes in Verbal Episodic Memory, which includes no visually presented stimuli. Prior studies of CVD-RFs and cognitive performance have found associations among CKD, tHcy, and lower brain volume particularly within the hippocampus (Chang et al., Reference Chang, Lin, Tsai, Yang, Wang, Lin and Fuh2017; Maesato et al., Reference Maesato, Ohtake, Mochida, Ishioka, Oka, Moriya and Kobayashi2017), an area consistently associated with spatial and episodic memory in both animals and human models (Burgess, Maguire, & O’Keefe, Reference Burgess, Maguire and O’Keefe2002). Because poor VA was associated with both CKD and tHcy, perhaps VA would better be conceptualized as a marker of advancing cerebrovascular health impacting hippocampal function.
Additionally, we found that VI was associated with considerably higher levels of physical function deficits, consistent with prior studies. This finding may implicate VA as a predictor of changes in cognitive performance by way of the maintenance of activities of daily living. The SET, while sensitive to changes in cognitive performance, is an indicator of distanced VA and thus, while this is speculative, may be more applicable to the maintenance of activities of daily living which require ambulatory movement (e.g., walking up/down stairs and gardening) rather than the maintenance of activities which require near-vision VA (e.g., reading and writing). Future studies with institutional samples are likely needed to determine the potential for visual prescription access/adherence on the maintenance of cognitive performance.
Strengths
This is the first study to examine the associations between visual acuity and the maintenance of cognitive ability over a broad range of cognitive domains with adjustment for several demographic variables, symptoms of depression, physical function, and CVD-RF. Furthermore, the associations of VA and cognitive performance measured both continuously and categorically (i.e., deficit) were robust when adjusted for wave 6 cognitive performance. Additionally, our measures of physical function, CKD, and tHcy were all derived from objective measurement methods as compared to self-report.
Limitations
Our sample was both highly educated and predominately white of European decent (6.1% African American), thus limiting the generalizability of the findings to non-white or mixed-ethnic populations. We did, however, adjust for African American (yes/no) status.
Individuals with normal vision differed in several ways from those with VI. In addition to being younger, those with normal vision tended to be healthier (lower CKD and smoking rates, SBP, tHcy, and functional deficits) and were more likely to be partnered and employed. Although we adjusted for many of these risk factors in our models, it is possible that psychobiological confounds exist that may explain or mediate the associations we found between VI status and cognitive performance.
Data on type of contacts/glasses prescription were also not available to these analyses; and we were unable to determine possible differences between myopia and hypermetropia among those with visual impairment. Additionally, data were also not available with respect to glasses-wearing and updating visual prescriptions for lenses outside of the testing center. This is of concern as the majority of our community sample by definition was ambulatory and able to arrive at the testing center unaccompanied. Given the central importance of vision in test performance, the need to wear updated prescription glasses to the testing session was strongly emphasized and compliance was high because participants were very concerned about their performance.
Lastly, the SET is a relatively unsophisticated screening measure of VA compared with other methods such as logMAR charts (log of minimum angle of resolution) which have consistent optotype progressions and have significantly greater reliability, discriminant validity, and sensitivity to inter-ocular differences (Bailey & Lovie, Reference Bailey and Lovie1976; Elliott, Reference Elliott2016). However, despite the clear advantages of logMAR charts, the results of this study can be applied to clinical practice because the SET remains a widely used measure of VA.
CONCLUSION AND FUTURE DIRECTIONS
Lower VA was associated with concurrent and future risk of cognitive decline across a range of cognitive domains. With adjustment for demographic, psychological, mobility, and CVD-RF variables, VA remained a significant predictor of Global cognitive function, Visual-Spatial Organization and Memory and Verbal Episodic Memory. Future work with clinical samples is needed to determine the mechanisms of cognitive decline. It is possible that VI reduces ambulatory ability and subsequent range of access to social, intellectual, and leisure activities. Although significant, VA predicted a modest level of variance in cognitive performance and future work with more reliable screening methods (i.e., logMAR) is needed. Lastly, longer longitudinal studies with several assessments are needed to further determine the directionality and growth curve associations of VA and cognitive function (i.e., rate of decline).
IMPLICATIONS
Our results indicate that VA may be used in combination with other screening measures to determine risk for cognitive decline. Compared with assay-based screening measures, tests measuring VA are widely available, low-cost, and easy to administer, which makes them a viable screening measure for cognitive decline in clinical practice.
ACKNOWLEDGMENTS
The authors declare that there are no conflicts of interest. This study was supported in part by the National Heart, Lung, and Blood Institute (M.F.E., grant numbers R01HL67358, R01HL81290) and the National Institute on Aging (grant number R01AG03055).
Supplementary Information Requests
Additional information relating to this article may be obtained by request by emailing the primary author.


