


1 Introduction
The moraic nasal of Japanese, often symbolized /N/ in the phonological literature, is a nasal segment with the phonological status of an independent mora, an intuitive unit of rhythm or timing in Japanese (Vance Reference Vance2008: 117).Footnote 1 /N/ has attracted the attention of researchers in various fields, including phonetics, phonology, psycholinguistics, and second-language (L2) studies (see Han Reference Han1962, Beckman Reference Beckman1982, and Warner & Arai Reference Warner and Takayuki2001 for phonetics; Bloch Reference Bloch1950, Yoshida Reference Yoshida1990, Yamane Reference Yamane2013, and Youngberg Reference Youngberg2018 for phonology; Otake & Yoneyama Reference Otake and Kiyoko1996 and Cutler & Otake Reference Cutler and Takashi1998 for psycholinguistics; and Han Reference Han2016 and Mizoguchi, Tiede & Whalen Reference Mizoguchi, Tiede and Whalen2019 for L2 studies, among others).
One reason that /N/ has attracted the attention of researchers in such a wide range of fields is that it is regarded as a typical example of so-called conditional allophony. The phonetic realization of /N/ is frequently described by allophonic phonetic realization rules like (1), a typical regressive place assimilation rule whereby a target segment is affected by the following segment.

The rule applies across morpheme and word boundaries, as shown in (2). The /N/ in word-final position as in /mikaN/ ‘orange’ is realized in the same manner as in (1) when followed by other words (particles in this example).

What happens, then, when /N/ is in utterance-final position, i.e. when /N/ is followed by a silent pause? There is less consensus among researchers on this point. Hattori (1951/Reference Hattori1984: 103) states that in this position /N/ is realized as a uvular nasal [N]. Kawakami (Reference Kawakami1977: 81) states that the moraic nasal is inherently a uvular nasal and is realized as such in utterance-final position, where no regressive assimilation takes place. Shibatani (Reference Shibatani1990) and Vance (Reference Vance2008: 102) state virtually the same position as Kawakami. Shibatani wrote:
The remaining problem has to do with the realizations of the final /N/ in such words as /hoN/ ‘book’. The most straightforward solution is to posit the phoneme that is fully specified as the uvular nasal as opposed to the archiphoneme /N/ in the traditional analysis. (Shibatani Reference Shibatani1990: 170)
This final-/N/-as-uvular view is widespread; it appears that most phonologists and linguists interested in Japanese take this for granted. See, for example, Aoyama (Reference Aoyama, Hwang and Lommel1999), Wells (Reference Wells2000), Tsujimura (Reference Tsujimura2013), Ito & Mester (Reference Ito, Armin and Haruo2015), and Youngberg (Reference Youngberg2018) in addition to those cited above. Saito (Reference Saito2005: 94), however, states that utterance-final /N/ is realized as a velar nasal immediately after front vowels and as a uvular nasal immediately after back vowels. Saito supposes allophonic variation in utterance-final /N/, while Hattori, Kawakami, and Vance do not.
This disagreement seems to stem from a lack of objective observations. The descriptions mentioned above are all based upon so-called ‘subjective’ or ‘impressionistic’ observation. The only objective observations of utterance-final /N/ are National Language Research Institute (NLRI 1990)Footnote 3 and Hashi et al. (Reference Hashi, Akina, Takao, Shotaro, Yuhki and Ryoko2016).Footnote 4 NLRI (1990) is an experimental phonetic description of Japanese vowels, consonants, and syllables using, among other things, X-ray movies taken originally for an earlier study, NLRI (1978). However, the authors of NLRI (1990) do not provide clear evidence for their position on utterance-final /N/; they write:
The closures in the oral cavity are located from front to back in the order /iN/, /eN/, /uN/, /aN/, /oN/. It is reasonable to transcribe /iN/ and /eN/ as [iŊ] and [eŊ] and the others as [ɯN], [aN], and [oN], but it is also reasonable to transcribe them all with the symbol [N], because it seems that the closure location of /iN/ and /eN/ is further back than the location of the most backward /k/ and /ɡ/ (those before /o/ or /oː/ vowels). (NLRI 1990: 514, translation by the present author)
Hashi et al. (Reference Hashi, Akina, Takao, Shotaro, Yuhki and Ryoko2016) reported substantive interspeaker variability, stating that ‘the ratio of datasets that were judged unlikely to be uvular nasals was 75%’ (Hashi et al. Reference Hashi, Akina, Takao, Shotaro, Yuhki and Ryoko2016: 83). A similar view was reported in Mizoguchi (Reference Mizoguchi2019).Footnote 5 This modest conclusion of Hashi et al. stemmed from the fact that they used X-ray microbeam system for the data acquisition, which is not optimal for the study of rear tongue body articulation given its limitations on how far back on the tongue pellets can adhere (see Section 2.1 for more details).
To sum up, there is little consensus about the phonetic status of /N/ in utterance-final position, and the lack of consensus seems to stem from a lack of objective observations and a poor understanding of the phonetic mechanism by which the utterance-final /N/ is realized. In the rest of this paper, the articulation of Japanese /N/ in various locations will be analyzed using data of real-time MRI movies. The superiority of this data will be discussed in the next section.
The aim of the current study is to provide a more holistic model of /N/ realization, thereby correcting any problems in traditional phonetic descriptions and the phonological treatments based on them. This is a particular case of the more general study of the question, ‘Can a (phonological) rule for allophony predict the complex nature of articulation?’ (see Cohn Reference Cohn1990; Sproat & Fujimura Reference Sproat and Osamu1993; and Maekawa Reference Maekawa2010, Reference Maekawa2018, among others).
2 Data and method
2.1 Real-time MRI movies
Real-time magnetic resonance imaging (rtMRI hereafter) techniques can serve as a useful device for the observation of continuous articulatory movements (Demolin et al. Reference Demolin, Mark George, Thierry, Alain and Hubert1997, Mohammad et al. Reference Mohammad, Moore, Carter, Christine and Steve1997, Masaki et al. Reference Masaki, Mark, Kiyoshi, Yasuhiro, Ichiro, Yuji and Noboru1999, Narayanan et al. Reference Narayanan, Asterios, Vikram, Adam, Jangwon, Sungbok, Krishna, Yoon-Chul, Yinghua, Louis, Dani, Erik, Prasanta, Athanasios and Michael2014, Lingala et al. Reference Lingala, Sutton, Miquel and Nayak2016, Toutios et al. Reference Toutios, Dani, Louis, Shrikanth, Katz and Assmann2019, among many others). rtMRI data have several properties favorable for the study of articulatory phonetics. First, it is possible with this device to obtain high-resolution images of the entire vocal tract (see Figure 1 below). We note that the image of the skull and other bones of the head do not appear in the MRI data, which is an important difference from X-ray movie data, in which the images of the tongue and palate are often blurred by the overlaid images of the bones of the head.Footnote 6
Second, rtMRI is an ideal device for observing articulations that take place in the back part of vocal tract, including the pharynx and larynx, and those related to the soft palate and tongue root. It is virtually impossible to gain information on articulations of these kinds with devices like the X-ray microbeam (Fujimura, Kiritani & Ishida Reference Fujimura, Shigeru and Haruhisa1973, Kiritani, Itoh & Fujimura Reference Kiritani, Kenji and Osamu1975) and EMA (Perkell et al. Reference Perkell, Cohen, Svirsky, Matthies, Iñaki and Jackson1993), because it is extremely difficult to attach measurement sensors to the surface of articulators such as the velum, tongue dorsum, tongue root, and pharyngeal wall. Of course, it is possible to observe the image of the tongue shape using ultrasonic imaging (Shawker, Sonies & Stone Reference Shawker, Sonies and Maureen1984, Yamane Reference Yamane2013, Hudu Reference Hudu2014), but ultrasound does not allow the imaging of the upper vocal tract surface, e.g. the palate. As a result, existing measurements of the /N/ in utterance-final position do not always provide sufficient information to identify the exact location of the closure in the vocal tract (Mizoguchi et al. Reference Mizoguchi2019). Third, it is possible to collect large amounts of data from a subject because MRI does not pose a risk of X-ray exposure. In the database used in this study (see Section 2.2), more than 45 min of rtMRI data were obtained from each subject.
In the current study, articulatory movements in the vocal tract are observed in the mid sagittal plane with a frame rate of about 13.84 fps (frame per second); each frame consists of 256 × 256 pixels (or voxels) with a pixel resolution of 1 mm and slice thickness of 10 mm. The recording was done using the 3 T MRI scanner (Siemens MAGNETOM Prisma) installed in the Brain Activity Imaging Center of ATR Promotion Inc., in Kyoto, Japan, in the years 2017–2019. In this setting, it is possible to make recordings of 512 consecutive frames in a single recording acquisition of about 37 seconds duration (note that the frame rate of 13.84 is equal to 512 divided by 37).
As in all other MRI studies, speakers produced the speech in a supine position. Kitamura et al. (Reference Kitamura, Hironori, Kiyoshi, Yasuhiro, Ichiro, Yuko, Shinobu, Kagayaki, Oku-uchi and Michio2005) reported a tendency for the tongue to be retracted in supine speech. This tendency may exist in the current data, but the influence of posture does not seem to be very significant in the current analysis because, as will be shown in Section 3.1, the speakers produced the closure of word-medial /N/ over the whole range of the vocal tract as described in the literature.
2.2 Database and speakers
The data analyzed in this study are extracted from an rtMRI database of Japanese speech that the current author has been constructing with his colleagues since 2017. The acquisition of rtMRI data was carried out after reviews by the Research Ethics Committee of the National Institute for Japanese Language and Linguistics (NINJAL) and the Safety Examination Committee of ATR-Promotion. All subjects of the rtMRIDB provided written permission to use their data for scientific research and to make it publicly available.
The main body of the database consists of three parts: the mora-unigram part, the mora-bigram part, and the special-morae part (see below). Currently, as of September 2020, the database contains the data of 15 speakers of Tokyo (or Standard) Japanese (10 male and five female) and five Kinki (Osaka, Kyoto, and Kobe) dialect speakers (three male and two female). In this study, the data of four female and seven male speakers of Tokyo Japanese were analyzed.Footnote 7 The age of the speakers at the time of recording ranged between 27 and 67 years, with a mean of 54 years. Each item in the database is uttered only once by each speaker.
The mora-unigram part consists of 111 Japanese morae; they are uttered in isolation without a carrier sentence. An item in the mora-unigram part is the single moraic nasal /N/ uttered in isolation (see Section 3.3). Phonologically, /N/ does not appear in word-initial position, but at the phonetic level the sequence /uN/ (‘yes’, ‘luck’, or a filled pause like English ‘um’) is frequently realized as a single nasal segment, and native speakers interpret this as an instance of the moraic nasal (Otake & Yoneyama Reference Otake and Kiyoko1996).Footnote 8 Thus, the subjects did not have any difficulty in the rtMRI recording session in reading aloud the moraic nasal alone. The mora bigram part consists of 676 bimorae (the combinations of 26 morae i.e. 262 = 676) uttered in a carrier sentence /koreɡa __ ɡata/ ‘This is type __’, but this part is not utilized in this study.
Lastly, the special-mora part consists of words containing one of four special morae (i.e. moraic nasal, geminate, long vowel, and diphthong) in various phonetic contexts. They are uttered in isolation. The special-mora part of the database includes, as of September 2020, 69 words containing /N/. Because 30 of the 69 words contain two /N/s, the maximum number of tokens of /N/ uttered by a subject is 99. However, the number of tokens of /N/ recorded differs from speaker to speaker depending on the date of recording because the utterance list utilized for the rtMRI recording has been continuously expanding. Additional rtMRI recording is currently underway to correct the unbalanced distribution of the /N/ and other items in the database.
2.3 Method of measurement
2.3.1 Data selection
In this study, the closure location of /N/ in the oral cavity is analyzed using the samples of 11 speakers (four female and seven male), as mentioned above. This is an expanded version of the dataset of three male subjects reported in Maekawa (Reference Maekawa2019). Most of the data analyzed in this study are extracted from the special-morae part of the database. In addition, several items of the mora-unigram parts are analyzed as well; they include the single moraic nasal uttered in isolation (Section 3.3) and the morae containing the /k/ consonant (Section 4.3).
Visual inspection of the rtMRI movie samples revealed, however, that there are cases where /N/ is realized as a nasalized vowel. This occurred in about 12% of the samples, and 80% of the /N/ as nasalized vowel occurred in word-medial position, mostly when the segment immediately following the /N/ was either [h], [s], [j], [w], or a vowel. In utterance-final position, 5% of the samples were nasalized vowels. These samples of nasalized vowels are excluded from analysis because the presence of a vocal tract closure is the prerequisite for the analysis method adopted in this study (Section 2.3.3). A full-fledged analysis of the nasalized vowels will be the theme of a separate paper, but a brief analysis will be presented in Section 4.4.
Table 1 List of words analyzed in this study.

As mentioned in the previous section, the number of tokens of /N/ differs from speaker to speaker due to the continuous expansion of the utterance list. In the rest of this study, only the words uttered by at least eight speakers (thus, both male and female) are analyzed. A list of the words analyzed in this study is given in Table 1. All words in the table except for the last are taken from the special-morae part of the database. In Table 1, the ‘Phoneme’ column shows the phonemic representation of the words. ‘IPA’ shows the narrow phonetic transcription of words, where the realization sites of the target /N/ are shown by asterisks. Following the tradition of Japanese phonology, the symbol /倁/ denotes a geminate. The long vowels are marked by the symbol /ː/. The phonemic symbols /c/ and /j/ correspond respectively to voiceless alveolar affricate [ts] and voiced alveolar approximant [j] in the IPA column. Note that some /N/ in the Phoneme column do not have a corresponding asterisk in the IPA column because they are realized as nasalized vowels. The automatic palatalization of consonants before the /i/ vowel is not shown in the Phoneme column but is shown in the IPA column. Note that palatalized /s/ and /c/ are transcribed respectively as [ɕ] and [tɕ]. ‘Subj’ denotes the number of subjects who pronounced the word. ‘Med’ and ‘Fin’ show respectively, the number of word-medial and utterance-final samples analyzed with respect to the word; when fewer than 11 and more than zero, some of them are realized as a nasalized vowel. The column ‘fs_place’ denotes one of the four levels of the fs_place variable used in statistical modeling that classifies the place of articulation of the following consonants of word-medial /N/. Similarly, the column ‘precVwl’ denotes one of the five levels of the prevVwl variable classifying the vowels immediately preceding the utterance-final /N/ (see Sections 3.1 and 4.1).
Note that words like /kaNhaN/ were treated as having only an utterance-final /N/ because all samples of word-medial /N/ (which is followed by an [h]) were realized as a nasalized vowel. Likewise, word-medial /N/ in /kaNhiN/ was realized six times as a nasal consonant (and five times as a nasalized vowel). The total numbers of word-medial and utterance-final /N/ samples analyzed in this study are 209 and 299, respectively. Lastly, the last row of the table denotes the single moraic nasal uttered in isolation; this item is counted neither as word-medial nor utterance-final.
2.3.2 Timing of measurement
The timing of oral closure for the /N/ was determined as follows. First, the next frame after the observed articulatory release of the closure for /N/ was determined by visual inspection. Then, by comparing the two to three frames that immediately precede the frame after the release, the frame in which the vocal tract was closed most clearly and firmly was selected as the frame for the measurement of the /N/. If all the preceding frames showed the same degree of closure, the one closest to the timing of the release was selected. In addition, the frame corresponding to the vowels that immediately precede the target /N/ was also determined. This was usually within two to three frames from the measurement frame of the /N/; the frame that maximally represents the phonetic/phonological properties of the vowel, such as the maximal opening in the case of /a/ or the maximal retraction in the case of /o/, was chosen for analysis. When it was difficult to apply this criterion, the frame two frames away from the target /N/ was chosen. Note the frame rate of the data is 13.84 fps.
2.3.3 Measurement points
Figure 1 shows the measurement points. The origin of the raw MRI data (in DCM format) is in the upper left corner of a frame. In this figure, the x–y coordinate system is shown schematically by arrows in the top left corner of the figure. Note that larger values along the x- and y-axes indicate that the measurement point is further back (x-axis) and more open (y-axis). Points A, P, U, L, and M are the landmarks for the normalization of articulatory space; these measurement points are explained in the next section. Points c1, c2 (white circles) and points v1, v2, v3 (white circle with a cross) are related respectively to consonantal closure and the tongue shape. Point c1 stands for the anterior edge of the vocal tract closure (at the opening into the front cavity), while c2 stands for the posterior edge (at the opening into the back cavity). Note that c1 and c2 are located on the surface of the tongue (and palate), except in the case of labial closure where they are located outside and inside the lips. Point v1 is the tongue tip (apex), v2 is the highest point of the tongue contour, and v3 is the most retracted point of the tongue (in the pharynx). Note that sometimes c1 or c2 coincides with v1. Alternatively, c2 sometimes coincides with v2. In these cases, the two measurement points share the same value. Data measurement was conducted by the author using a rtMRI data viewer (Asai, Kikuchi & Maekawa Reference Maekawa2018) developed in the rtMRI database development project (see Section 2.2). Ten samples were randomly selected from the data and remeasured to evaluate the accuracy of the measurement. The mean absolute difference in millimeters (or pixels) was 1.6 and 1.7 for c1x and c1y, 1.2 and 0.8 for c2x and c2y, and 1.3 and 1.1 for v2x and v2y.

Figure 1 Measurement points and the original and normalized coordinates, here showing utterance-medial /N/ in /siNaN/ ‘new idea’.
2.3.4 Normalization of articulatory space
As is well known, the vocal tract size and shape and the resulting two-dimensional articulatory space differ considerably across speakers. Therefore, these differences must be normalized so that we can compare the data across speakers. The normalization procedure utilized in this study is based upon (but not completely identical to) the idea proposed in Honda (Reference Honda1998). Under Honda’s proposal, five anatomical landmarks are measured as shown in Figure 1. Capital letters in the figure denote the anatomical landmarks utilized in normalization. The points A and P denote respectively the anterior nasal spine (ANS) and posterior nasal spine (PNS). Point U is where the line connecting ANS and PNS intersects the pharyngeal wall. Point L is the point on the pharyngeal wall corresponding to the boundary between the third and fourth cervical vertebrae. Last, point M denotes the menton (which is not utilized in this study).
The normalized two-dimensional articulatory space of an individual is defined by these landmarks. The origin of the new coordinate system is set to ANS (point A). The new normalized x-axis is defined as the line connecting the ANS (A) and PNS (P), i.e. the white rightward arrow in Figure 1. The new normalized y-axis is defined in two steps. First, a line is drawn from point L to the new x-axis so that the line is perpendicular to the new x-axis (the white broken upward arrow in Figure 1). Second, the line is translated to the origin as the new y-axis (the real downward arrow). The measurement unit for the normalized x-axis is defined as the Euclidian distance between points A and U, and that for the normalized y-axis as the Euclidian distance between point L and the new x-axis, that is, the length of the broken upward arrow in the figure.Footnote 9 Points A, P, U, L, and M are measured for all samples of /N/ and other segments of interest such as the preceding vowel. This is necessary because some speakers moved their heads noticeably while speaking, and to correct this movement, we must know the angle between the original and normalized x-axes for each frame.
The effects of the normalization are evaluated in Figures 2–5. Figure 2 shows the scatter plots of all four female speakers’ c2 data including both word-medial and utterance-final /N/ before (the left panel) and after (the right panel) normalization, where the data points are classified by speaker. Note that the axial labels ‘c2x’ and ‘c2xnru’ denote respectively the

Figure 2 Scatter plots of the four female speakers’ c2 data before (left) and after (right) normalization. The unit of the left panel is in millimeter (mm). The numbers in the legend denote the IDs of speakers.
x coordinate values before and after normalization.Footnote 10 Before normalization, the distributions of the four speakers were not alike, reflecting the anatomical differences of speakers. In particular, the samples of speakers 16 and 17 can easily be discriminated from those of speakers 10 and 11. In the right panel, by contrast, inter-speaker differences are indiscernible, suggesting the effectiveness of the normalization.
Similarly, Figure 3 shows the effect of normalization on sex-related differences. The data used here encompass both male and female speakers and word-medial and utterance-final /N/, and the data points are classified by the sex of the speakers. The left and right panels show respectively the scatter plots before and after normalization. While it is possible to visually discriminate the female and male data in the left panel, it is almost entirely impossible in the right panel, suggesting the effectiveness of the normalization.

Figure 3 Scatter plots of all male and female c2 data before (left) and after (right) normalization. The unit of the left panel is millimeters (mm).
Figures 4 and 5 compare respectively the sample distributions of c1 and c2 of word-medial /N/ after normalization. In these figures, data points are classified according to the place of articulation of the following consonants (see next section for details), and the male and female data are shown separately. In these figures, by and large, c1 and c2 values in the bottom left corners correspond to labial closures (with negative values of x reflecting the position of the lips relative to the ANS), and values near the top right corner correspond to velar closures.

Figure 4 Normalized c1 of word-medial /N/ as classified by the place of articulation of the following consonants. Female (F) and male (M) data are shown separately.
Two important facts emerge from these figures. First, a sex-related difference in the distribution of data is hard to find. The female and male data have a virtually identical distribution along both the x- and y-axes. Second, the location of the vocal tract closure for /N/ differs systematically according to the place of articulation of the following consonant, as described in the literature. The last issue will be discussed in more detail in Section 4.1 below based on the results of statistical tests.
Based on Figures 2–5, we conclude that the normalization method proposed here is effective enough to allow direct comparison both of the female and male data and across individual speakers. In the rest of this paper, the normalized data will be referred to simply as data, and the measured quantities such as ‘c1xnru’ will be referred to simply as ‘normalized c1x’ when there is no risk of confusion.

Figure 5 Normalized c2 word-medial /N/ classified by the place of articulation of the following consonants. Female (F) and male (M) data are shown separately.
3 Descriptive results
3.1 Word-medial /N/
First, the distributions of the measurement points c1 and c2 for word-medial /N/ are analyzed to confirm the validity of the traditional description. The data are seen in Figures 4 and 5. In these figures, samples are classified according to the places of articulation of the segments immediately following the /N/. In the legend, ‘Lab(ial)’ covers the consonant [b]; ‘Alv(eolar)’ covers [ts], [tɕ], [n], [ɾ], [s], [t], and [z] (variably [dz]); ‘Pal(atal)’ covers [ç] and [j]; and ‘Vel(ar)’ covers [k] (see Table 1). Note that samples with [h], [ɸ], or [w] as the following consonant were excluded from analysis because in most instances they were realized as nasalized vowels (see Section 2.3.1). Note also, as shown in Table 1, that samples having [ç], [j], or [s] as the following consonant were variably realized either as nasal consonants or nasalized vowels. Only samples realized as nasal consonants were counted as instances of word-medial /N/.
In Figures 4 and 5, samples are roughly separated into distinct groups according to the following segment. The cloud of ‘Lab’ samples is separated from the ‘Alv’ samples in all panels of the figures. ‘Alv’ and ‘Pal’ samples show partial overlaps in both c1 and c2, but by and large they are distinctly distributed. Similarly, the ‘Pal’ and ‘Vel’ samples are distinguishable despite the partial overlap. On the whole, Figures 4 and 5 support the traditional description that the place of articulation of word-medial /N/ is determined by the immediately following consonant (if any). In Section 4.1, we will examine the differences in sample distributions quantitatively using regression analyses.
Note incidentally, although it is not the theme of the present study, that the data shown in Figures 4 and 5 raise questions regarding the nature of what is called place (or point) of articulation. In particular, it is interesting to note that the separation of samples is clearer in c2 (Figure 5) than in c1 (Figure 4). This difference can probably be explained by the acoustic theory of speech production, whereby it is the back, rather than front, cavity of the vocal tract whose resonance (and anti-resonance) makes a substantial contribution to nasal sounds (see Kent & Reed Reference Kent and Charles1992 and Johnson Reference Johnson2003 for non-technical review).
3.2 Utterance-final /N/
Next, Figure 6 shows the distribution of normalized c1 and c2 of utterance-final /N/ pooled over female and male speakers, which is the central theme of this study. Here, samples are classified according to the preceding vowels. The location of the vocal tract closure of these samples can be inferred by comparing the x-axis of Figure 6 to that of Figure 4 or 5.
Most of the utterance-final /N/ are realized in places encompassing the velum and hard palate, and there is even a case where the c2 of utterance-final /N/ is realized in the alveolar region (in which case the preceding vowel is /e/). Supposing that the uvular nasal is not included in Figures 4 and 5, as predicted by the traditional description, it is natural to interpret that the tokens in Figure 6 distributed in the area posterior to any of the tokens in Figures 4 and 5 are uvular nasals. The two vertical arrows in the figure show the upper bounds of the c1x and c2x values in Figures 4 and 5.Footnote 11 Interestingly, all tokens in these areas are preceded by either /a/ or /o/. This is unlikely to be a mere coincidence; it seems that there is a causal relationship between the place of articulation of utterance-final /N/ and the properties of the preceding vowels.

Figure 6 Normalized c1 and c2 of utterance-final /N/. Pooled female and male data classified by the preceding vowels. Arrows indicate upper bounds of the c1x and c2x values of word-medial /N/.
This hypothesis is examined and strongly supported in Figure 7. The panels of this figure separately compare the v2 values of the preceding vowels (i.e. the highest point of the tongue) and those of utterance-final /N/; there is a high correlation between the tongue position of the preceding vowels and that of the /N/. In all cases, v2 of the /N/ segments has a similar x-value and smaller y-value than the preceding vowels, i.e. the /N/ tokens have a more constricted (i.e. higher) location than the preceding vowels. This suggests the possibility that speakers produce the closure for utterance-final /N/ simply by raising the tongue at virtually the same location as the preceding vowel. Readers can visually examine the differences in the articulation of the utterance-final /N/ in the supplemental video file. Also, Figure 7 is characterized by large overlaps among the tokens with different preceding vowels, in contrast to the clearer separation of tokens due to the following segments in Figures 4 and 5. This is probably the situation with respect to which Yamane (Reference Yamane2013: 67) has stated that there is ‘larger variability in word-final /N/’. This issue will be reexamined in Section 4.1 based on the results of statistical analyses.
3.3 Isolated /N/
The last analysis concerns the single /N/ uttered in isolation. Kawakami (Reference Kawakami1977: 81) writes that isolated /N/ is realized as a uvular nasal, which he believes to be the inherent place of articulation of moraic nasals in general. Contrary to his belief, however, the phonetic realization of isolated /N/ in the rtMRI data differed considerably from subject to subject. Of the 11 speakers analyzed here, only two realized the isolated /N/ as uvular nasal (one female and one male speaker). Of the remaining speakers, five (two females and three males) realized it as a bilabial nasal, three (one female and two males) as an alveolar nasal, and one male speaker as a velar nasal.Footnote 12 This extreme variability will be discussed in the Conclusion section.

Figure 7 Comparison of the normalized v2 values of utterance-final /N/ and the preceding vowels. Cross and filled circle stand respectively for utterance-final /N/ and the preceding vowel.
4 Discussion
4.1 Analysis by the generalized linear mixed-effect model
The analyses reported in the previous section strongly suggest that the realization of utterance-final /N/ is determined to a large extent by the immediately preceding vowel, but these analyses were based on visual inspection of the data. To evaluate the hypothesis statistically, regression analysis using the generalized linear mixed-effect model (GLMM) was conducted. The normalized c1x (c1xnru) and c2x (c2xnru) of word-medial and utterance-final /N/ are analyzed separately. The purpose of the analysis of word-medial samples is twofold: for comparison with the utterance-final samples, and to examine the validity of the subjective observation stated in Section 3.1 on the grouping of samples in Figures 4 and 5.
The explanatory variable for word-medial /N/ (both for c1x and c2x) is the place of articulation of the following consonant (classified in the same manner as in Figures 4 and 5, i.e. either ‘Lab’, ‘Alv’, ‘Pal’, or ‘Vel’). On the other hand, the explanatory variable for utterance-final /N/ is the immediately preceding vowel (/i/, /e/, /u/, /a/, or /o/, with the reference level being ‘i’). Note that both explanatory variables are factor, rather than numerical, variables. Formulae (3) and (4) show the specifications of the regression models in the notation of the lme4 (Ver. 1.1-21; Bates et al. Reference Bates, Martin, Bolker, Steven, Christensen, Henrik, Bin, Fabian and Gabor2019) library of R (Ver. 3.5.1; R Core Team 2013). In these formulae, ‘fs_place’ denotes the place of articulation of the following segment (i.e. consonants) and ‘precVwl’ the preceding vowel. ‘Subject’ and ‘Word’ denote respectively the identities of speakers and words; these are used as the variables for random intercept.Footnote 13
These models are used for two purposes, a statistical test of the differences between the levels of the explanatory variables and the prediction of the values of a response variable by means of the explanatory variables. In this section, the results of the statistical tests are reported.
The results are summarized in Tables 2–7. The lmerTest (Ver. 3.1-1) library is used for the computation of the p-values in these tables (Kuznetsova et al. Reference Kuznetsova, Per Bruun, Christensen and Jensen2019). The hypothesis tested is different depending on the table. We begin by reporting the results for word-medial /N/, which were tested using a repeated contrast (Schad et al. Reference Schad, Shravan, Sven and Reinhold2020). In a test with a repeated contrast, pairs of neighboring levels in the target factor are successively tested against each other; in the present case, ‘Lab’ is tested against ‘Alv’, ‘Alv’ is tested against ‘Pal’, and ‘Pal’ is tested against ‘Vel’.
Tables 2 and 3 show respectively the results of normalized c1x and c2x of word-medial /N/. The notation used in these tables adopts by and large that of the summary() function of R as applied in the lme4 and lmerTest libraries. The leftmost column shows the concatenation of variable name and a pair of two levels in the variable. For example, ‘fs_place:Alv-Lab’ denotes a variable name ‘fs_place’ followed by a pair of two adjacent levels ‘Alv-Lab’. The rightmost column of the tables shows the result of hypothesis testing. The interpretation of Tables 2 and 3 is straightforward. All pairs of adjacent places of articulation are statistically significantly different. Tables 2 and 3 support the traditional description of word-medial /N/ in the literature.
On the other hand, Tables 4–7 show the results concerning utterance-final /N/. Here, two different hypotheses are tested using a treatment contrast and a repeated contrast. First, Tables 4 and 5 show the results of treatment contrast, where the levels of ‘e’, ‘u’, ‘a’, and ‘o’ are compared to the reference level ‘i’. The interpretation of Tables 4 and 5 is simple. All levels in the preceding vowel are significantly different from the reference level. What matters here, however, are the values in the ‘Estimate’ column. These are the weights given to the corresponding level of the explanatory variable to predict the value of the response variable (i.e. c1x or c2x). The observed order of Estimate values is ‘i’ < ‘e’ < ‘u’ < ‘a’ < ‘o’ (with the estimated value of the reference level presumably equal to zero) in Table 4, and ‘i’ < ‘u’ < ‘e’ < ‘a’ < ‘o’ in Table 5. These orders may seem to be strange from the point of view of general phonetics, but it reflects the phonetic properties of v2 in the vowels of Standard Japanese. In fact, the arithmetic means of the normalized v2x of the five preceding vowels are 0.4255, 0.4969, 0.5571, 0.6139, and 0.6724, respectively, for ‘i’, ‘e’, ‘u’, ‘a’, and ‘o’ in our data; the v2x value for /u/ is smaller (hence fronter) than for /a/ and /o/ and between the values for front (/i/ and /e/) and back vowels (/a/ and /o/). The above order of estimate values reflects this order of the v2 values in the Japanese vowels. Note that the above order matches exactly the observation reported in NLRI (1990) cited in Section 1.
Table 2 GLMM analysis of the normalized c1x of word-medial /N/. Repeated contrast.

Table 3 GLMM analysis of the normalized c2x of word-medial /N/. Repeated contrast.

Table 4 GLMM analysis of the normalized c1x of utterance-final /N/. Treatment contrast with reference level of ‘i’.

Table 5 GLMM analysis of the normalized c2x of utterance-final /N/. Treatment contrast with reference level of ‘i’.

Next, Tables 6 and 7 show the results of statistical tests with a repeated contrast. Here, as in Tables 2 and 3, the pairs of adjacent levels in the precVwl variable are successively tested, where, for example, ‘precVwl:e-i’ denotes the difference between the levels ‘i’ and ‘e’. For both c1x and c2x, the differences between ‘i’ and ‘e’, and between ‘u’ and ‘a’ are significant, while those between ‘e’ and ‘u’, and between ‘a’ and ‘o’ are not significant. These tables suggest the interpretation that, so far as the x-value of closure is concerned, there are effectively three levels in the place of articulation of utterance-final /N/, ‘i’, ‘e’/‘u’, and ‘a’/‘o’.
Table 6 GLMM analysis of the normalized c1x of utterance-final /N/. Repeated contrast.

Table 7 GLMM analysis of the normalized c2x of utterance-final /N/. Repeated contrast.

Taken together, Tables 4–7 provide support for the hypothesis that the realization of utterance-final /N/ is determined largely by the property of the immediately preceding vowel. At the same time, they also suggest a substantial difference in the strength of the effect on utterance-final /N/ of the preceding vowel and that on word-medial /N/ by the following consonant, such that the effect on utterance-final /N/ is not as fine-graded as that on word-medial /N/.
Lastly, in passing, although the details are omitted in this paper, the same GLMM analyses were conducted separately for the male and female data to compare the sex-bounded conclusions. Both conclusions were exactly the same as the one obtained from Tables 2–7.
4.2 Prediction of the closure location
Thus far, the statistical significance of the difference between the levels of independent variables has been examined, but this is not the most crucial aspect of the discussion. What matters is how well the model can explain the data. To examine this issue, normalized x-values of c1 and c2 were predicted from the GLMM models. The GLMM models used for prediction are the same as (3) and (4) above, but with one important difference in the computation method: Prediction was performed with a technique known as leave-one-out cross-validation (LOOCV). The statistical models discussed in the previous section were constructed using a so-called closed data set, i.e. the models were constructed by using all available samples. It has recently been shown, however, that this kind of statistical model often runs the risk of overfitting, whereby a model fits the data set used in model learning too closely and may fail to fit new samples not included in the learning data set. LOOCV is conducted to evaluate the generalizability of the models to new samples. To apply LOOCV to a data set of N data points, one value is removed from the data set in the beginning, and the statistical model constructed using the remaining N−1 values is used to predict the value of the removed sample. This process was repeated N times for all samples. Accordingly, 209 and 299 models were constructed respectively for word-medial and utterance-final /N/. The LOOCV was applied independently for both c1x and c2x.
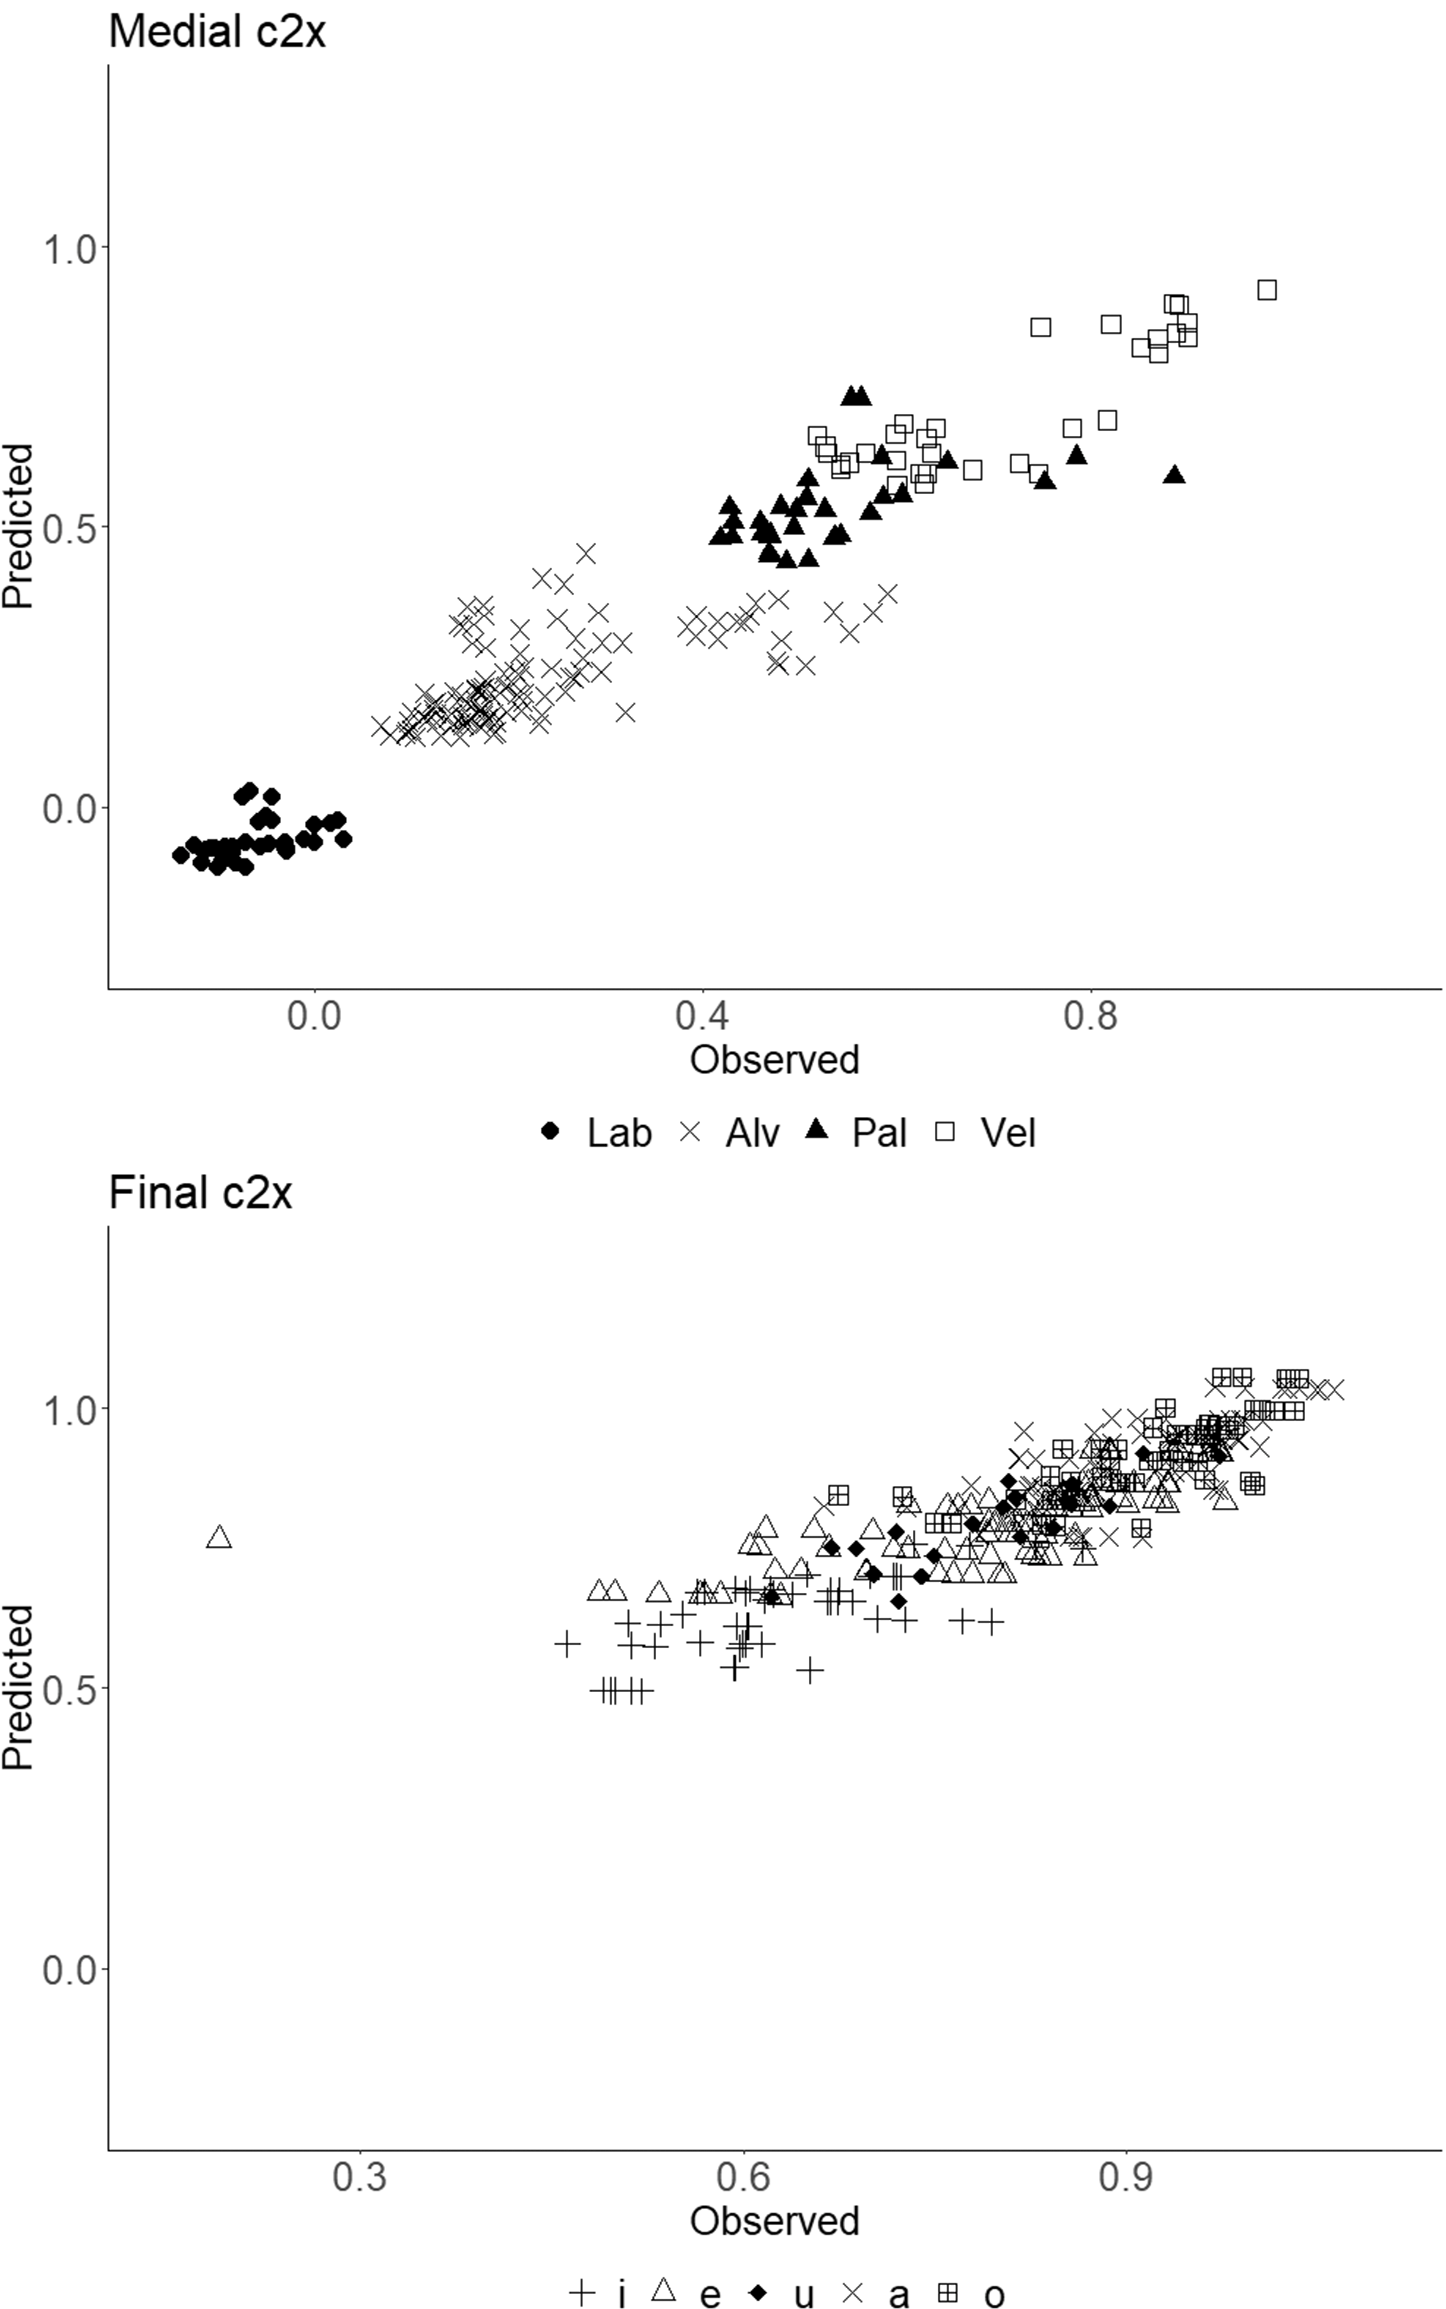
Figure 8 Scatter plots of the observed and predicted values of c2x. Word-medial /N/ (top) and utterance-final /N/ (bottom).
The results are shown in Figure 8. The top and bottom panels show respectively the scatter plots of the observed and predicted values of normalized c2x for word-medial and utterance-final /N/. Note that the ranges of the x-axis are arranged in two panels for maximal visibility of plot symbols. Both panels show high positive correlations between the observed and predicted values, suggesting the effectiveness of the prediction using the GLMM models for both word-medial and utterance-final /N/. Table 8 shows the Pearson product-moment correlation coefficient and mean prediction error for c1x and c2x of word-medial and utterance-final /N/.
Although the prediction performance is fine in all models, there is a clear difference in the grouping of samples between the word-medial and utterance-final /N/. In word-medial position, both the observed and predicted samples show good separation due to the following consonants, though there are partial overlaps between ‘Alv’ and ‘Pal’, and between ‘Pal’ and ‘Vel’. On the other hand, in utterance-final position, the separation of tokens due to the preceding vowels is less clear than that of word-medial /N/; there are large overlaps of samples for all adjacent pairs of vowels such as /i/ and /e/, /e/ and /u/, and /a/ and /o/. As mentioned in Section 4.1, it is highly likely that the place of articulation of utterance-final /N/ is controlled by the preceding vowel, whose location along the palate effectively falls in three, rather than five, levels.
Table 8 Correlation coefficients and mean prediction error of observed and predicted values.

These results suggest – reconsidering the distribution of the normalized row data shown in Figures 4–6 above – the possibility that the locations of closure in the two types of /N/ are determined by different realization mechanisms: The computation of word-medial /N/ appears nearly categorical and static in the sense of Cohn (Reference Cohn1990), while that of utterance-final /N/ is continuous or gradient. This difference seems to stem from the former being the result of a phonological manipulation, while the latter results from coproduction of the tongue-raising gesture mentioned in Section 3.2 and the lowering of the velum.Footnote 14
4.3 Comparison with /k/
As mentioned in Section 1, NLRI (1990) stated that the closure location of utterance-final /N/ is further back than that of the most backward /k/. The validity of this statement was examined using the rtMRI data. Figure 9 presents violin-plots comparing the distributions of
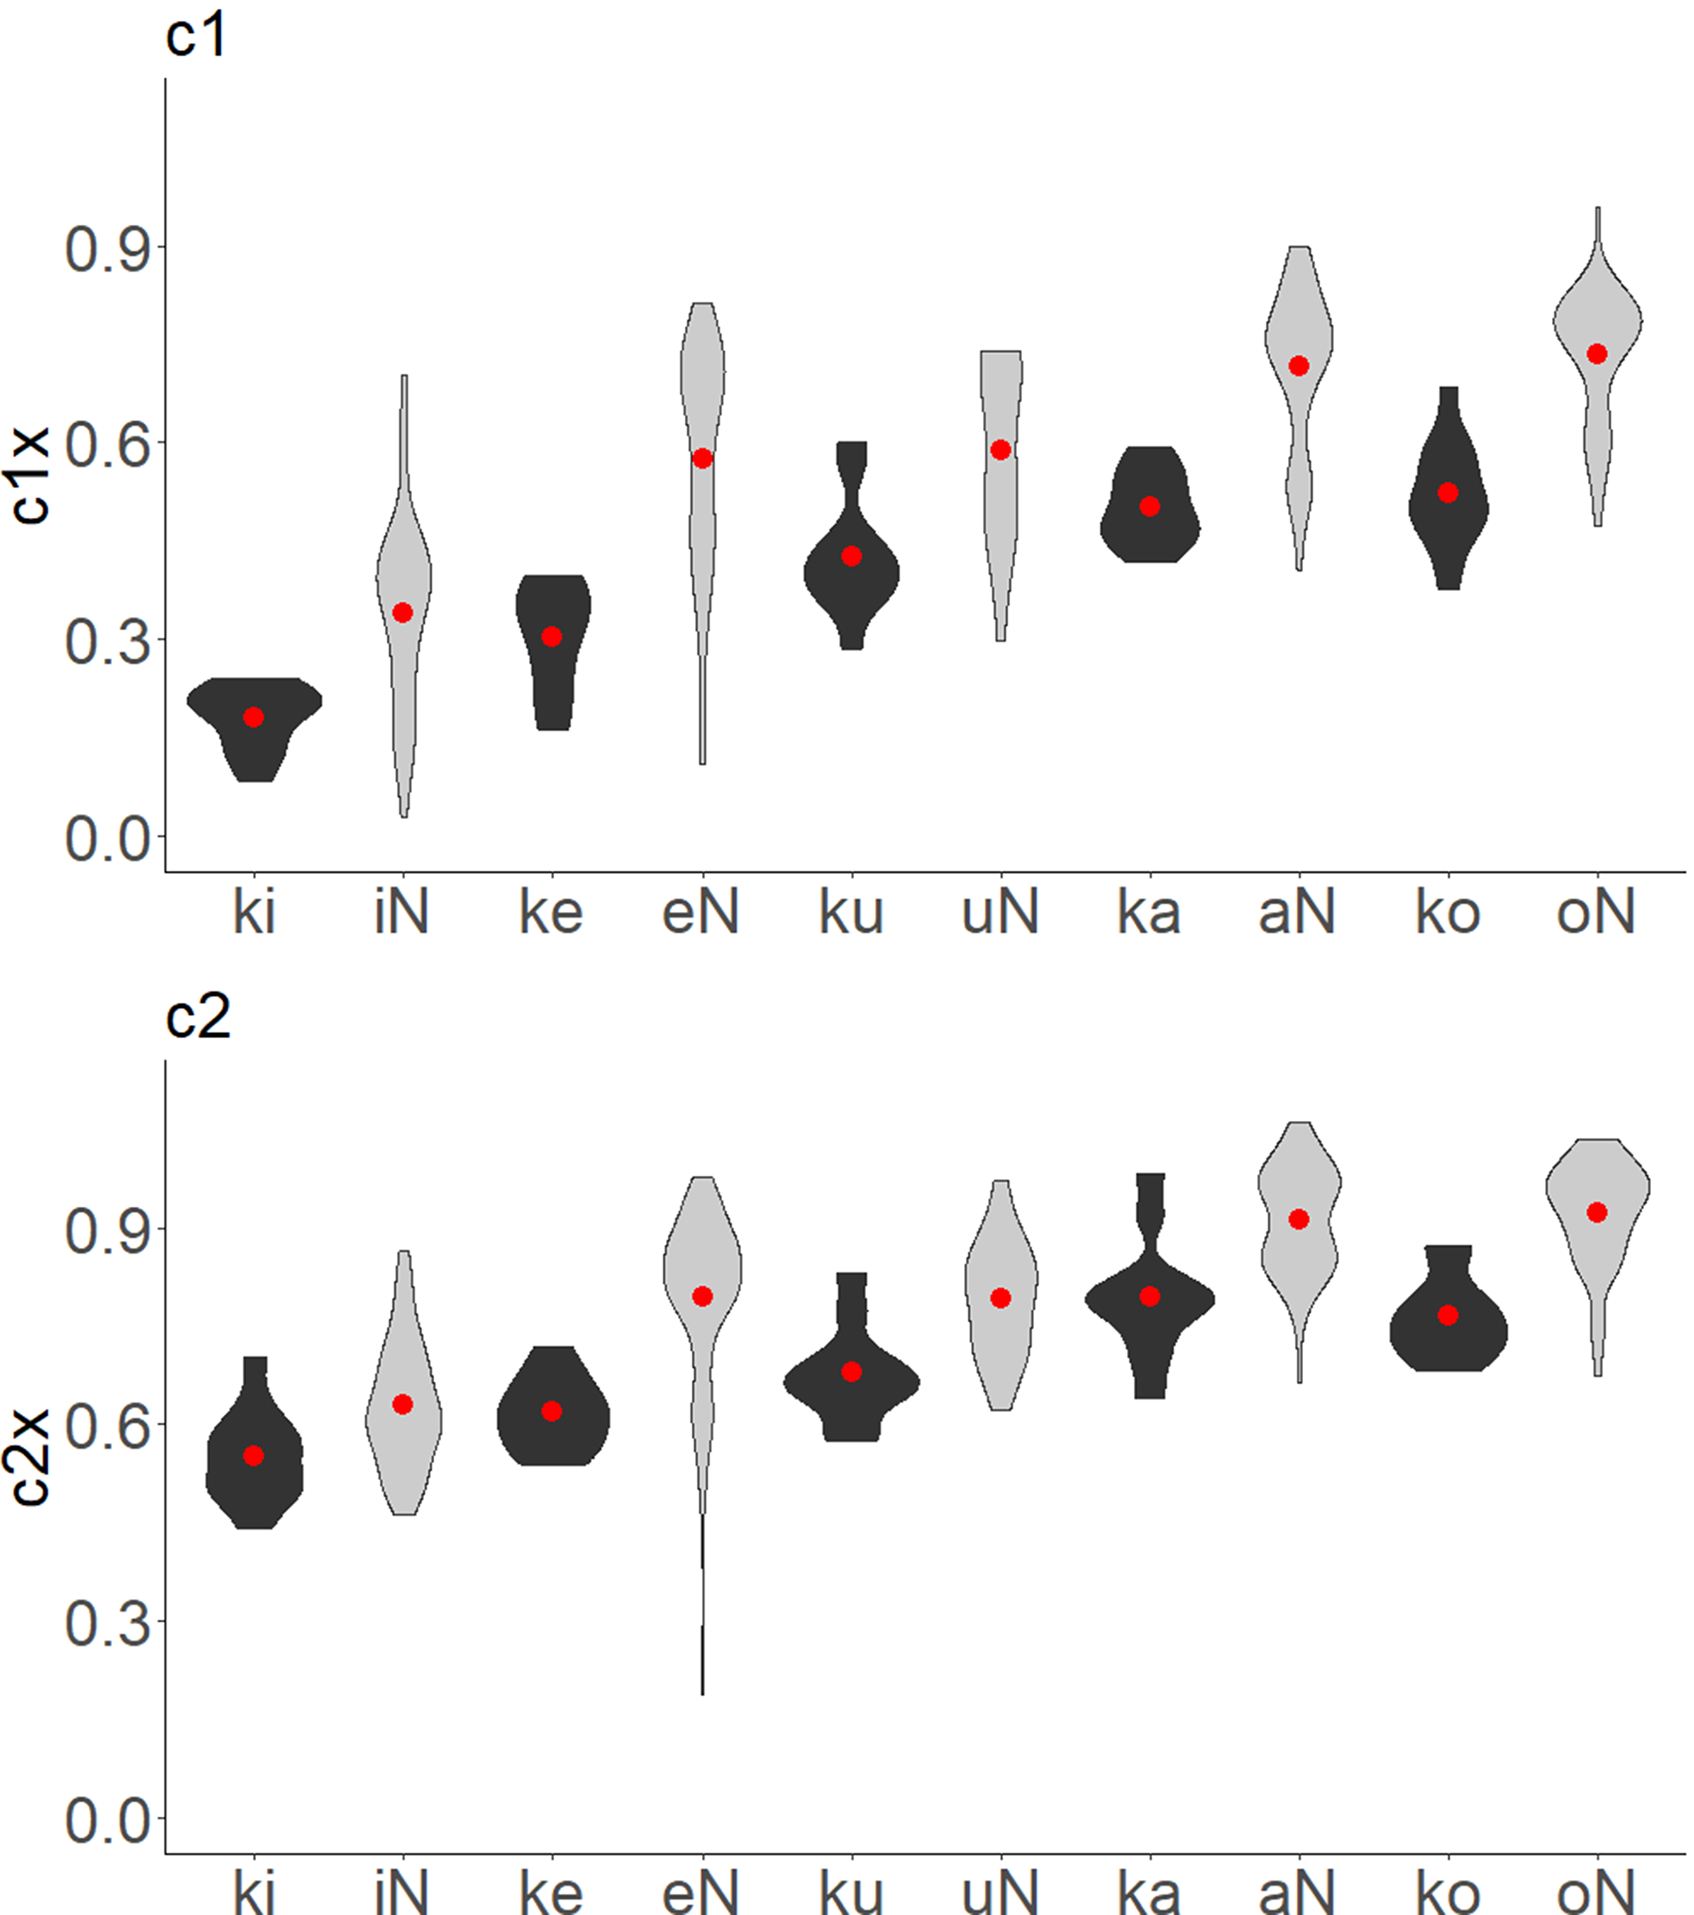
Figure 9 Comparison of the locations of closure in /k/ (filled) and utterance-final /N/ (shaded). Circles indicate means.
the normalized c1x and c2x values of /k/ and utterance-final /N/. The top and bottom panels of the figure, respectively, present normalized c1x and c2x values, and each panel compares /k/ and /N/. The data for /k/ were extracted from the mora unigrams for /ki/, /ke/, /ku/, /ka/, and /ko/. The distributions of normalized c1x and c2x are shown as a function of adjacent vowels (i.e. the vowels following /k/, and the vowels preceding /N/); the overlaid circles denote the means.
Although the closures of /N/ are further back than those of /k/, there is large overlap between the two phonemes regardless of the adjacent vowel. It thus turns out that the claim of NLRI (1990) is inconsistent with the rtMRI data. It is likely that the extremely back location of final /N/ observed in NLRI (1990) is an idiosyncratic property of their sole speaker or stemmed from measurement error due to blurred tongue and palate images in the X-ray movie.
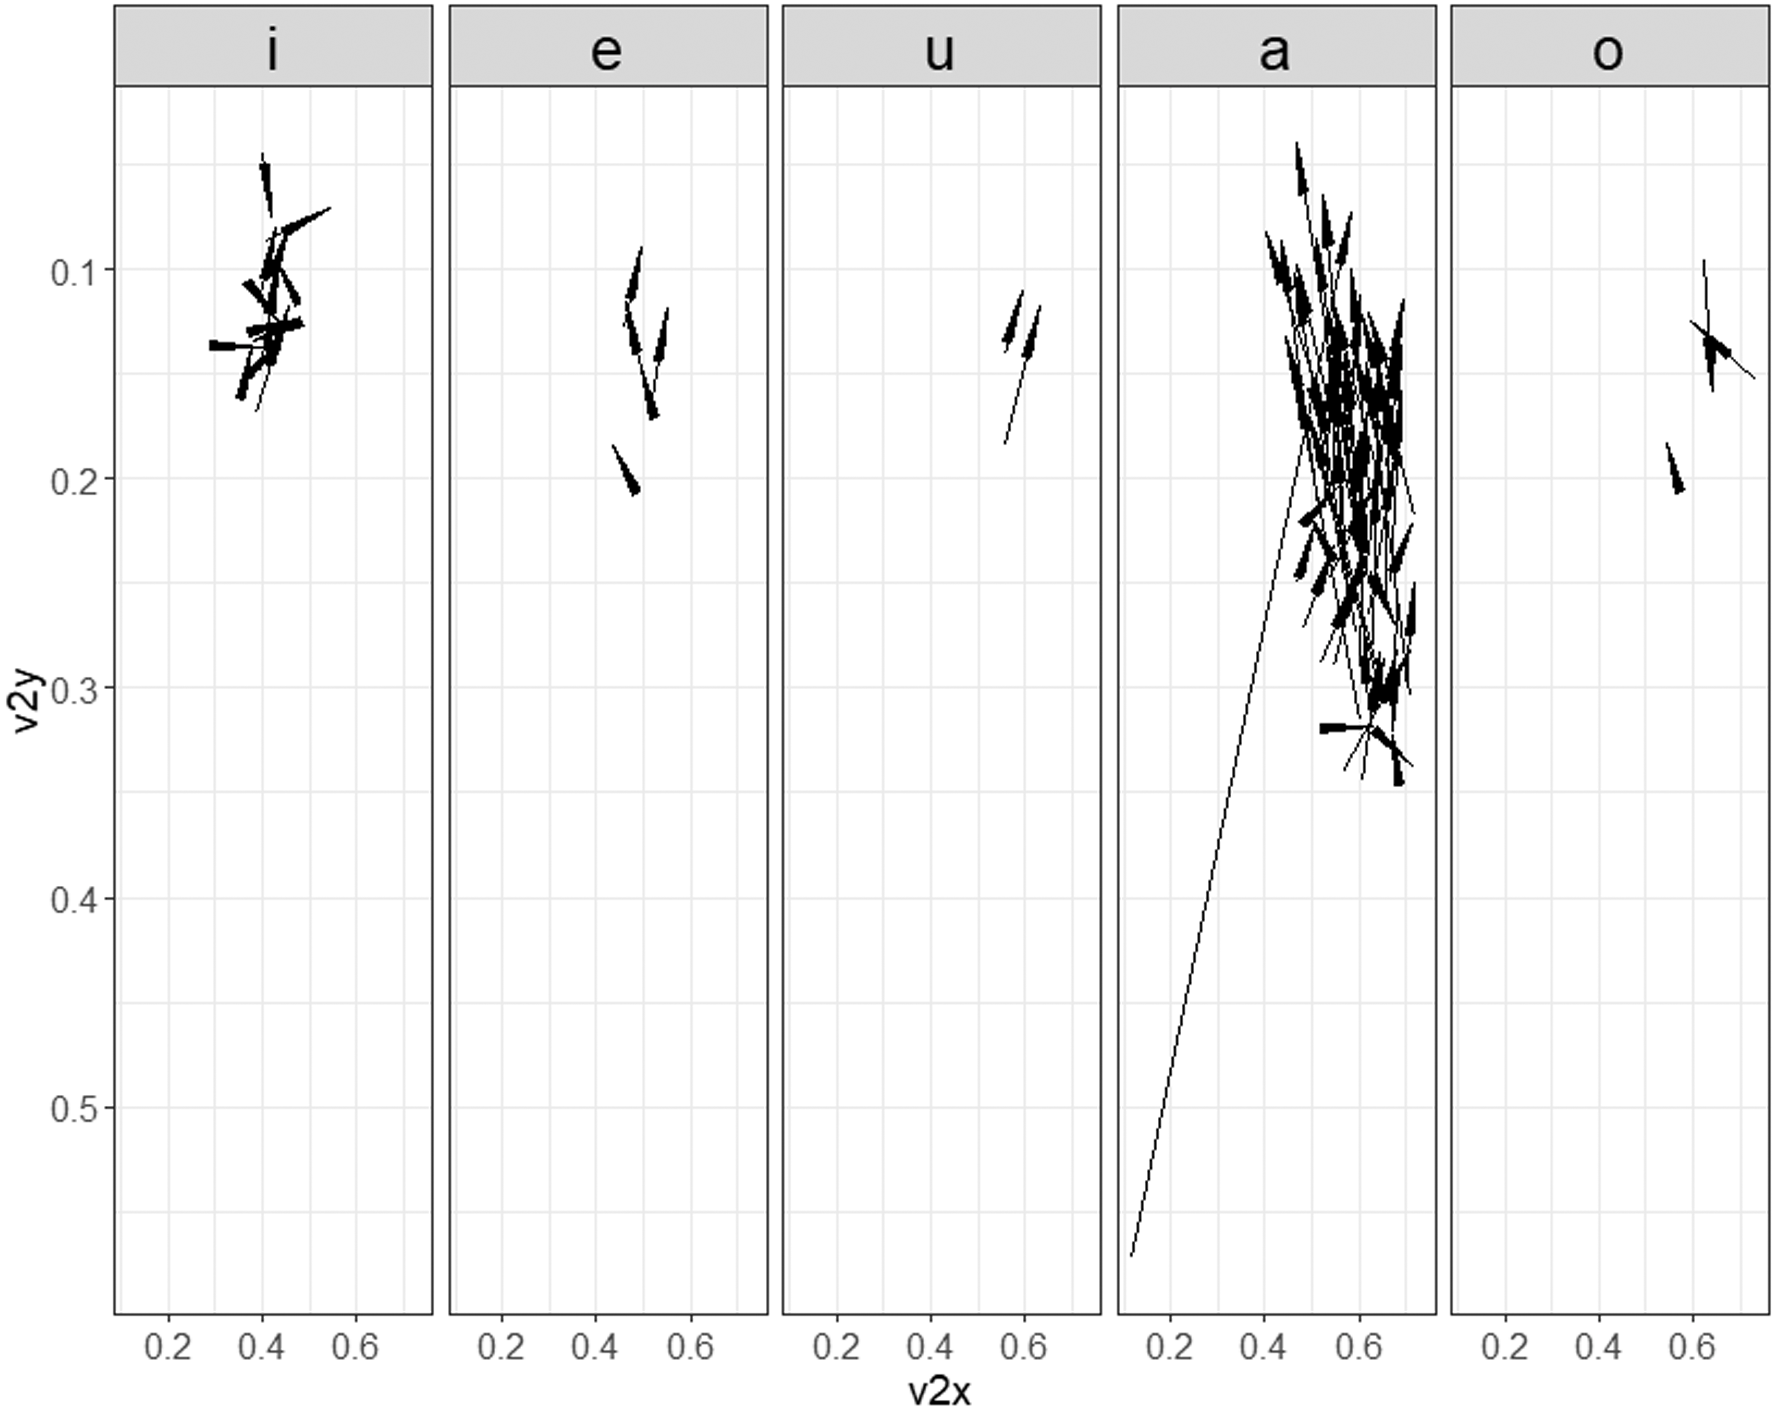
Figure 10 Movement of the highest point of the tongue from the preceding vowel to utterance-final /N/ realized as nasalized vowels. Coordinates are normalized v2x and v2y.
4.4 Notes on nasalized vowels
As mentioned in Section 1, samples of nasalized vowels were excluded from analysis because the presence of vocal tract closure is the prerequisite for the analysis method adopted in this study. As mentioned there, full-fledged analysis of the nasalized vowel samples will be a theme of a separate paper, but one interesting result of a preliminary analysis is presented below. Figure 10 shows the vectors connecting the v2s (i.e. the highest point of the tongue) of the preceding vowel and utterance-final /N/ (the tip of the arrow indicates v2 of /N/). This figure reveals that the movement of the highest point of the tongue from the preceding vowel to /N/ as a nasalized vowel is very small in the cases of preceding vowels other than /a/; this finding suggests that /N/ as a nasalized vowel is realized with nearly the same tongue shape and location as the preceding vowel except for /a/. When the preceding vowel is /a/, however, speakers raise the tongue almost perpendicularly to produce nasalized vowels. This suggests that /N/ as a nasalized vowel is not merely a nasalized version of the preceding vowel, but is accompanied by an articulatory gesture of its own, i.e. the tongue-raising gesture. It is likely that the articulatory gesture behind the realization of /N/ as a nasalized vowel is virtually the same as that of utterance-final /N/ with vocal tract closure discussed in Section 3.2.
5 Conclusion
The production of Japanese moraic nasal /N/ can be summarized as follows: It is a nasal segment whose place of articulation is entirely unspecified, as described in some of the literature. The location of vocal tract closure is identical to that of the following consonant if there is one. When there is no following consonant, it is determined by progressive assimilation of the preceding vowel. Speakers raise the tongue so that the highest portion of the tongue in the preceding vowel contacts the palate. If there is neither a preceding vowel nor a following consonant, the place of articulation is left unspecified. The extreme variability of the /N/ uttered in isolation (Section 3.3) can be interpreted as the consequence of this complete lack of specification.
Analyses of the rtMRI data also revealed that the location of vocal tract closure of utterance-final /N/ is highly variable, ranging from alveolar to uvular, due mostly to the influence of the preceding vowel. One should not assume a single location of consonantal closure for this segment as many previous studies have done. At the same time, one should not explain the variation as an allophonic rule that rewrites the place of articulation of the final /N/ depending on the preceding vowel, because the locations of /N/ overlap considerably. Rather, the variation in utterance-final /N/ is best interpreted as phonetic variation resulting from the coproduction of the preceding vowel and the nasal segment. Speakers do two things to realize an utterance-final /N/: They lower the velum to make the segment nasalized, and lift the relevant part of the tongue, starting from the tongue posture of the preceding vowel, to make a vocal tract closure at a location close to the highest portion of the tongue. Importantly, while velum lowering is indispensable for /N/, the tongue-lifting gesture need not always be completed. Occurrences of utterance-final /N/ as nasalized vowels (5% of the whole utterance-final /N/ samples) are likely to be the consequence of this gradient lifting of the tongue.
Acknowledgments
This work is supported by the JSPS KAKENHI grants to the author (17H02339, 19K21641, and 20H01265) and the research budget of the Center for Corpus Development, National Institute for Japanese Language and Linguistics. The author wishes to express his gratitude to the staff of the ATR-BAIC for their help in data acquisition, especially Drs. Shinobu Masaki, Yasuhiro Shimada, and Yukiko Nota. His gratitude also goes to the following people: Dr. Kiyoshi Honda for his advice on the identification of ANS and PNS in the MRI image, Mr. Takuya Asai for the development of browsing and measurement software of the rtMRI data, Mr. Ken’ya Nishikawa for the development of the prototype version of the rtMRI database query system. Drs. Takayuki Kagomiya and James Tanner gave precious comments on an early version of this paper. Last but not the least, the author thanks three reviewers of the JIPA for their valuable comments.
Supplementary material
To view supplementary material for this article (including audio files to accompany the language examples), please visit https://doi.org/10.1017/S0025100321000050


 Open access