


1. Introduction
Backchannels (BCs) are short utterances such as ‘yeah’ or ‘mmhm’ whose primary function is to signal a combination of a listener’s (1) understanding of, (2) attention to and (3) agreement with the interlocutor’s speech. Although there is generally neither a conscious awareness of nor a formal set of rules for backchannelling, it is nevertheless a ubiquitous and essential feature of spoken communication. BCs have been a focus of linguistic research at least since the inception of conversation analysis in the 1970s (Clark & Schaefer, Reference Clark and Schaefer1989; Ehlich, Reference Ehlich1986; Jefferson, Reference Jefferson1984; Schegloff, Reference Schegloff1982; White, Reference White1989; Yngve, Reference Yngve1970). [Please note that, in this work, we only focus on spoken BCs, leaving aside related visual signals such as eye gaze, nods and gestures, as we were unable to conduct and analyse video recordings for the present study (see Section 4.3).]
The highly influential work of Ward and Tsukahara (Reference Ward and Tsukahara2000) has highlighted the complexities of the precise prosodic, temporal and lexical realisation of BCs and BC-inviting cues in English and Japanese (see also, e.g., Ward, Reference Ward2000, Reference Ward2019; Ward et al., Reference Ward, Escalante, Al Bayyari and Solorio2007). Previous work has also shown that the rate of BCs produced and, more importantly, their specific lexical and intonational realisation, can have a profound influence on (perceived) communicative success and mutual understanding, as well as on subjective judgements by conversational partners. This has been explored both in the interactions of humans with virtual agents in spoken dialogue systems (Fujie et al., Reference Fujie, Fukushima and Kobayashi2004; Ward & DeVault, Reference Ward and DeVault2016; Ward & Tsukahara, Reference Ward and Tsukahara1999) and in natural conversations, usually in cross-cultural or comparative settings (e.g., Cutrone, Reference Cutrone2005, Reference Cutrone2014; Dingemanse & Liesenfeld, Reference Dingemanse and Liesenfeld2022; Li, Reference Li2006; Tottie, Reference Tottie, Aijmer and Altenberg1991; Xudong, Reference Xudong2008; Young & Lee, Reference Young and Lee2004).
Various studies have shown that listeners are highly sensitive to the frequency and temporal placement of BC tokens, suggesting that unusual realisations are likely to lead to misunderstandings and negative judgements. For instance, Fujie et al. (Reference Fujie, Fukushima and Kobayashi2004) report that both the lexical content and, in particular, the timing of BC feedback influenced the ratings of users interacting with a robotic dialogue system. Cutrone (Reference Cutrone2005, Reference Cutrone2014) investigated BC productions in dyadic interactions between Japanese EFL (English as a foreign language) and British speakers and concluded that between-group differences in rate, type and timing negatively affected intercultural communication. Similarly, Li (Reference Li2006) found differences in the rate of BCs produced in Mandarin Chinese compared to Canadian English dialogues and, further comparing cross-cultural interactions, reports that backchannelling can be a cause for miscommunication.
Further work has analysed the prosodic realisation of BCs in various languages in detail (Benus et al., Reference Benus, Gravano and Hirschberg2007; Caspers et al., Reference Caspers, Yuan, Huang and Tang2000; Savino, Reference Savino2010; Stocksmeier et al., Reference Stocksmeier, Kopp and Gibbon2007). The general consensus is that BCs are typically rising in Germanic and Romance languages (but more often falling in, e.g., Japanese or Vietnamese; see Ha, Reference Ha2012; Ha & Grice, Reference Ha and Grice2010), although there are increasing hints that there is a complex interaction of this presumed ‘default’ intonation contour with pragmatic functions and choice of lexical type (Sbranna et al., Reference Sbranna, Möking, Wehrle and Grice2022; Wehrle, Reference Wehrle2021). In a small number of pilot studies, the influence of the exact prosodic realisation of BCs on listeners’ judgements and character attributions has been explored (Ha et al., Reference Ha, Ebner and Grice2016; Wehrle et al., Reference Wehrle, Roettger and Grice2018; Wehrle & Grice, Reference Wehrle and Grice2019). Wehrle and Grice (Reference Wehrle and Grice2019) compared the intonation of BCs in German and observed that Vietnamese learners of German produced twice as many non-lexical BCs (‘mmhm’) with a flat intonation contour as German natives. As discussed in Ha et al. (Reference Ha, Ebner and Grice2016) and supported by results from a mouse-tracking experiment presented in Wehrle et al. (Reference Wehrle, Roettger and Grice2018), a flat BC contour in German might be interpreted to signal a lack of attention or interest (see also Stocksmeier et al., Reference Stocksmeier, Kopp and Gibbon2007). These studies confirm the acute sensitivity of listeners to even small differences in the acoustic realisation of BC tokens.
Despite this variety of previous research, to the best of our knowledge, only two studies have touched on the topic of backchannelling in autism spectrum disorder (ASD). The first of these studies qualitatively investigated the use of the Japanese conversational token ‘ne’ in highly structured interactions (in conjunction with a neuroimaging study). The authors report that ‘ne’ as a BC was not used at all by the autistic children in the sample, whereas it was used frequently by non-autistic children (Yoshimura et al., Reference Yoshimura, Kawahara and Kikuchi2020). The second study analysed the use of BCs (and mutual gaze) in story-telling-based interactions and found a lower rate in autistic and mixed as compared with non-autistic dyads of adults (Rifai et al., Reference Rifai, Fletcher-Watson, Jiménez-Sánchez and Crompton2022).
Although this lack of previous research is not entirely surprising given that research on naturalistic conversations in ASD is still rare, there is a great theoretical and practical interest in further examining backchannelling in autistic populations in particular. BCs are implicit, other-oriented vocal signals with a predominantly social function. Given the characteristic patterns of social communication in ASD, it seems highly likely (a) that speakers with ASD might be less inclined to perform backchannelling at the same rate as non-autistic speakers (in line with previous results) and (b) that BC productions might differ in subtle ways between speakers with and without a diagnosis of ASD.
For the current study, we compared conversations between dyads of German native speakers who either both did or did not have a diagnosis of ASD. We analysed the rate of BCs produced, taking into account different dialogue stages, as well as their lexical and prosodic realisation. The rate of BCs can indicate how much speakers explicitly supported the ongoing turn of their interlocutor, and the early stages of a social interaction are known to disproportionately influence personality judgements and character attributions (McAleer et al., Reference McAleer, Todorov and Belin2014; Wehrle et al., Reference Wehrle, Cangemi, Janz, Vogeley and Grice2023a). For our analysis of the lexical realisation of BCs, we aimed to connect the diversity of productions with the assumed general tendency towards restricted behaviour in ASD. Finally, we analysed the intonational realisation of BCs in detail, as a broad range of previous work suggests not only that prosody plays a special and potentially distinctive role in ASD (e.g., Krüger, Reference Krüger2018; McCann & Peppé, Reference McCann and Peppé2003; Paul et al., Reference Paul, Augustyn, Klin and Volkmar2005; Wehrle et al., Reference Wehrle, Cangemi, Hanekamp, Vogeley and Grice2020, Reference Wehrle, Cangemi, Vogeley and Grice2022), but also that intonation may be of particular relevance in the production and perception of BCs (as pointed out above).
2. Methods
2.1. Participants
We recorded 28 monolingual native speakers of German engaged in semi-spontaneous conversation, of which 14 had been diagnosed with Asperger syndrome (ICD-10: F84.5) and were recruited in the Autism Outpatient Clinic at the Department of Psychiatry, University of Cologne (Cologne, Germany). Subjects from the ASD group were first recorded and described in Krüger (Reference Krüger2018) and Krüger et al. (Reference Krüger, Cangemi, Vogeley and Grice2018) (performing different tasks). Participants from the control (CTR) group were recruited from the general population specifically for this study. All subjects received 10 EUR for participation.
Participants were grouped into disposition-matched dyads (seven ASD–ASD and seven CTR–CTR). We recorded disposition-matched dyads rather than mixed dyads (ASD–CTR) for three main reasons. First, there is a dramatic lack of research on communication in ASD based on data from matched rather than mixed dyads. Second, investigating the behaviour of disposition-matched dyads seems to us the most promising way to gain insights into what we might justifiably call ‘autistic communication’. Third, recent research suggests that many social difficulties experienced by people on the autism spectrum might, in fact, be due to neurotype mismatches (arising in interactions with non-autistic people) rather than any inherent cognitive ‘deficits’ or ‘impairments’ (Crompton et al., Reference Crompton, Sharp, Axbey, Fletcher-Watson, Flynn and Ropar2020; Morrison et al., Reference Morrison, DeBrabander, Jones, Faso, Ackerman and Sasson2020; Rifai et al., Reference Rifai, Fletcher-Watson, Jiménez-Sánchez and Crompton2022). This perspective reflects a growing (and perhaps overdue) broader awareness that analyses of interaction, rather than of isolated minds, should be at the core of cognitive science, linguistics and related disciplines (Dingemanse et al., Reference Dingemanse, Liesenfeld, Rasenberg, Albert, Ameka, Birhane, Bolis, Cassell, Clift, Cuffari, De Jaegher, Novaes, Enfield, Fusaroli, Gregoromichelaki, Hutchins, Konvalinka, Milton, Rączaszek-Leonardi and Wiltschko2023).
All participants completed the German version of the Autism-Spectrum Quotient (AQ) questionnaire, an instrument developed by Baron-Cohen et al. (Reference Baron-Cohen, Wheelwright, Skinner, Martin and Clubley2001) to measure autistic traits in adults. AQ scores range from 0 to 50, with higher scores indicating more autistic traits. An AQ score of 32 or above is commonly interpreted as a clinical threshold for ASD (Ashwood et al., Reference Ashwood, Gillan, Horder, Hayward, Woodhouse, McEwen, Findon, Eklund, Spain and Wilson2016; Baron-Cohen et al., Reference Baron-Cohen, Wheelwright, Skinner, Martin and Clubley2001). All participants also completed the Wortschatztest WST (Schmidt & Metzler, Reference Schmidt and Metzler1992), a standardised, receptive German vocabulary test that exhibits a high correlation to verbal as well as general intelligence (Satzger et al., Reference Satzger, Fessmann and Engel2002).
Although participants from the CTR group were matched as closely as possible to the ASD group for age, verbal IQ and gender, some minor differences remained. Participants from the ASD group were on average slightly older (M = 44; range: 31–55) than those from the CTR group (M = 37; range: 29–54). However, there was an extensive overlap between groups and there is no reason to assume that such a relatively small difference in this particular age range would act as a confound in group comparisons.
Further, the ASD group had a slightly higher average verbal IQ score (M = 118; range: 101–143) than the CTR group (M = 106; range: 99–118). Again, there was considerable overlap between groups. There is no reason to assume that this difference should have a meaningful impact on results.
The ratio of gender (self-reported) was similar, but not identical across groups. The ASD group contained 4 females and 10 males, whereas the CTR group contained 3 females and 11 males. This entails that dialogues took place in the ASD group between one all-female dyad, two mixed dyads and four all-male dyads, but in the CTR group between three mixed dyads and four all-male dyads.
Most importantly, there was a clear difference in AQ scores between groups, with a far higher average score in the ASD group (M = 41.9; range = 35–46) than in the CTR group (M = 16.1; range: 11–26) and no overlap at all between subjects from both groups. Bayesian modelling (see Section 2.4 and the OSF repository at https://osf.io/jcb7t/) provides unambiguous evidence for the group difference in AQ scores, and also confirms that the differences in age and verbal IQ are small but robust. Table 1 shows summary statistics for gender, age, verbal IQ and AQ.
Table 1. Subject information by group
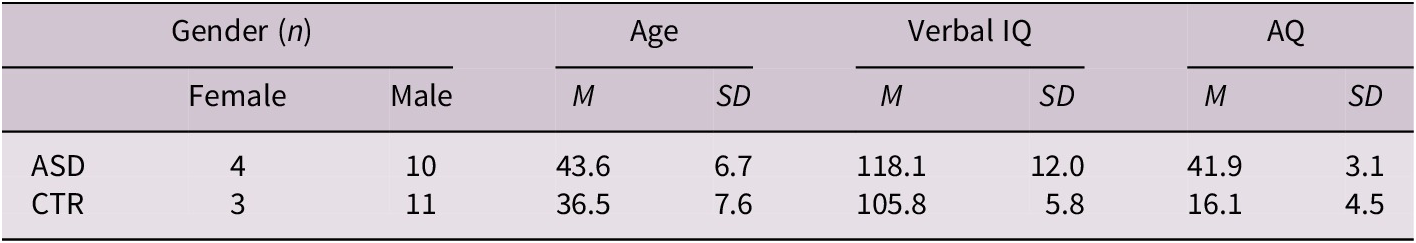
Abbreviation: ASD, autism spectrum disorder; CTR, control group.
All aspects of the study were approved by the local ethics committee of the Medical Faculty at the University of Cologne and performed in accordance with the ethical standards laid down in the 1964 Declaration of Helsinki and its later amendments. All participants gave their written informed consent prior to participating in the experiment.
2.2. Materials and procedure
We used Map Tasks to elicit semi-spontaneous speech (Anderson et al., Reference Anderson, Brown, Shillcock and Yule1984, Reference Anderson, Bader, Bard, Boyle, Doherty, Garrod, Isard, Kowtko, McAllister and Miller1991). We chose this paradigm as it provides us with predominantly spontaneous speech data that can, however, still be controlled along a number of key parameters, such as lexical items (via the names of landmarks on a map) and communicative obstacles (such as the introduction of mismatching landmarks between maps; see below for more detail).
Participants were recorded in pairs (dyads). After filling in a number of forms and the questionnaires listed in Section 2.1, participants received written instructions for the task and entered a recording booth. Each participant was presented with a simple map containing nine landmark items in the form of small pictures (materials adapted from Grice & Savino, Reference Grice and Savino2003, and optimised for prosodic analysis). Only one of the two participants (the instruction giver) had a route printed on their map. The experimental task was for the instruction follower to transfer this route to their own map by exchanging information with the instruction giver. During this entire process, an opaque screen was placed between participants, meaning they could not establish visual contact and had to solve the task by means of verbal communication alone. The roles of instruction giver and instruction follower were assigned randomly. Upon completion of the first task, subjects received a new set of maps and their roles were switched. The session ended once the second Map Task was completed.
As is common practice in the Map Task paradigm, some landmarks in each set of maps were either missing, duplicated and/or replaced with a different landmark compared to the interlocutor’s map. This was the case for two landmarks per map in our experiment. During annotation, we marked the portion of the dialogue in which the first mismatching landmark was discussed by participants and used these timestamps to divide dialogues up into two epochs (more details in Section 3.1.2). An example of a pair of maps used in this study is shown in Fig. 1, with mismatches highlighted using red circles. All dyads received the same two pairs of maps.
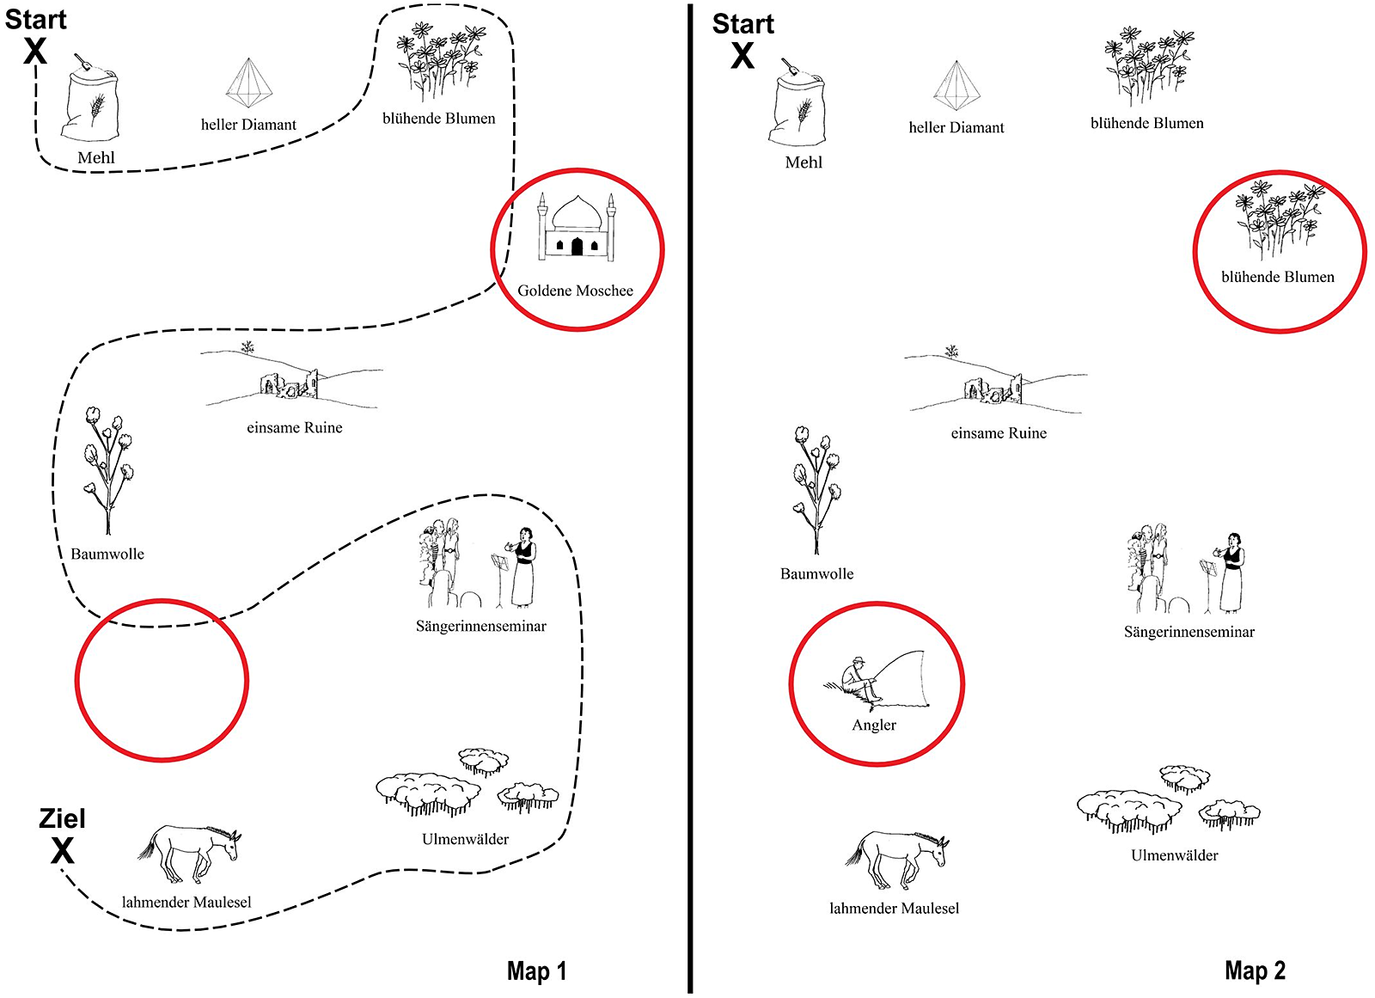
Figure 1. Example of Map Task materials. The instruction giver’s map, with a route leading from “Start” (top left) to “Ziel” (finish; bottom left), is in the left panel. Mismatches between maps are highlighted with red circles.
Map Task conversations were recorded in a sound-proof booth at the Department of Phonetics, University of Cologne. We used two head-mounted microphones (AKG C420L) connected through an audio interface (PreSonus AudioBox 22VSL) to a PC running Adobe Audition. The sample rate was 44,100 Hz (16 bit).
We only included dialogue from the start to the end of each task (as opposed to, e.g., any small talk between the first and second task) in the analysis. This was done in order to achieve a greater degree of comparability regarding conversational context. The total duration of the dialogue analysed is 4 hr and 44 min, and the mean dialogue duration per dyad is 20 min and 19 s (SD = 12 min 32 s).
2.3. Data and processing
Fig. 2 shows an example excerpt of Map Task dialogue from one of the ASD dyads, transcribed following GAT conventions (Couper-Kuhlen & Barth-Weingarten, Reference Couper-Kuhlen and Barth-Weingarten2011; Selting et al., Reference Selting, Auer, Barth-Weingarten, Bergmann, Bergmann, Birkner, Couper-Kuhlen, Deppermann, Gilles and Günthner2009). Three examples of BCs are highlighted in bold (lines 14, 16 and 21).
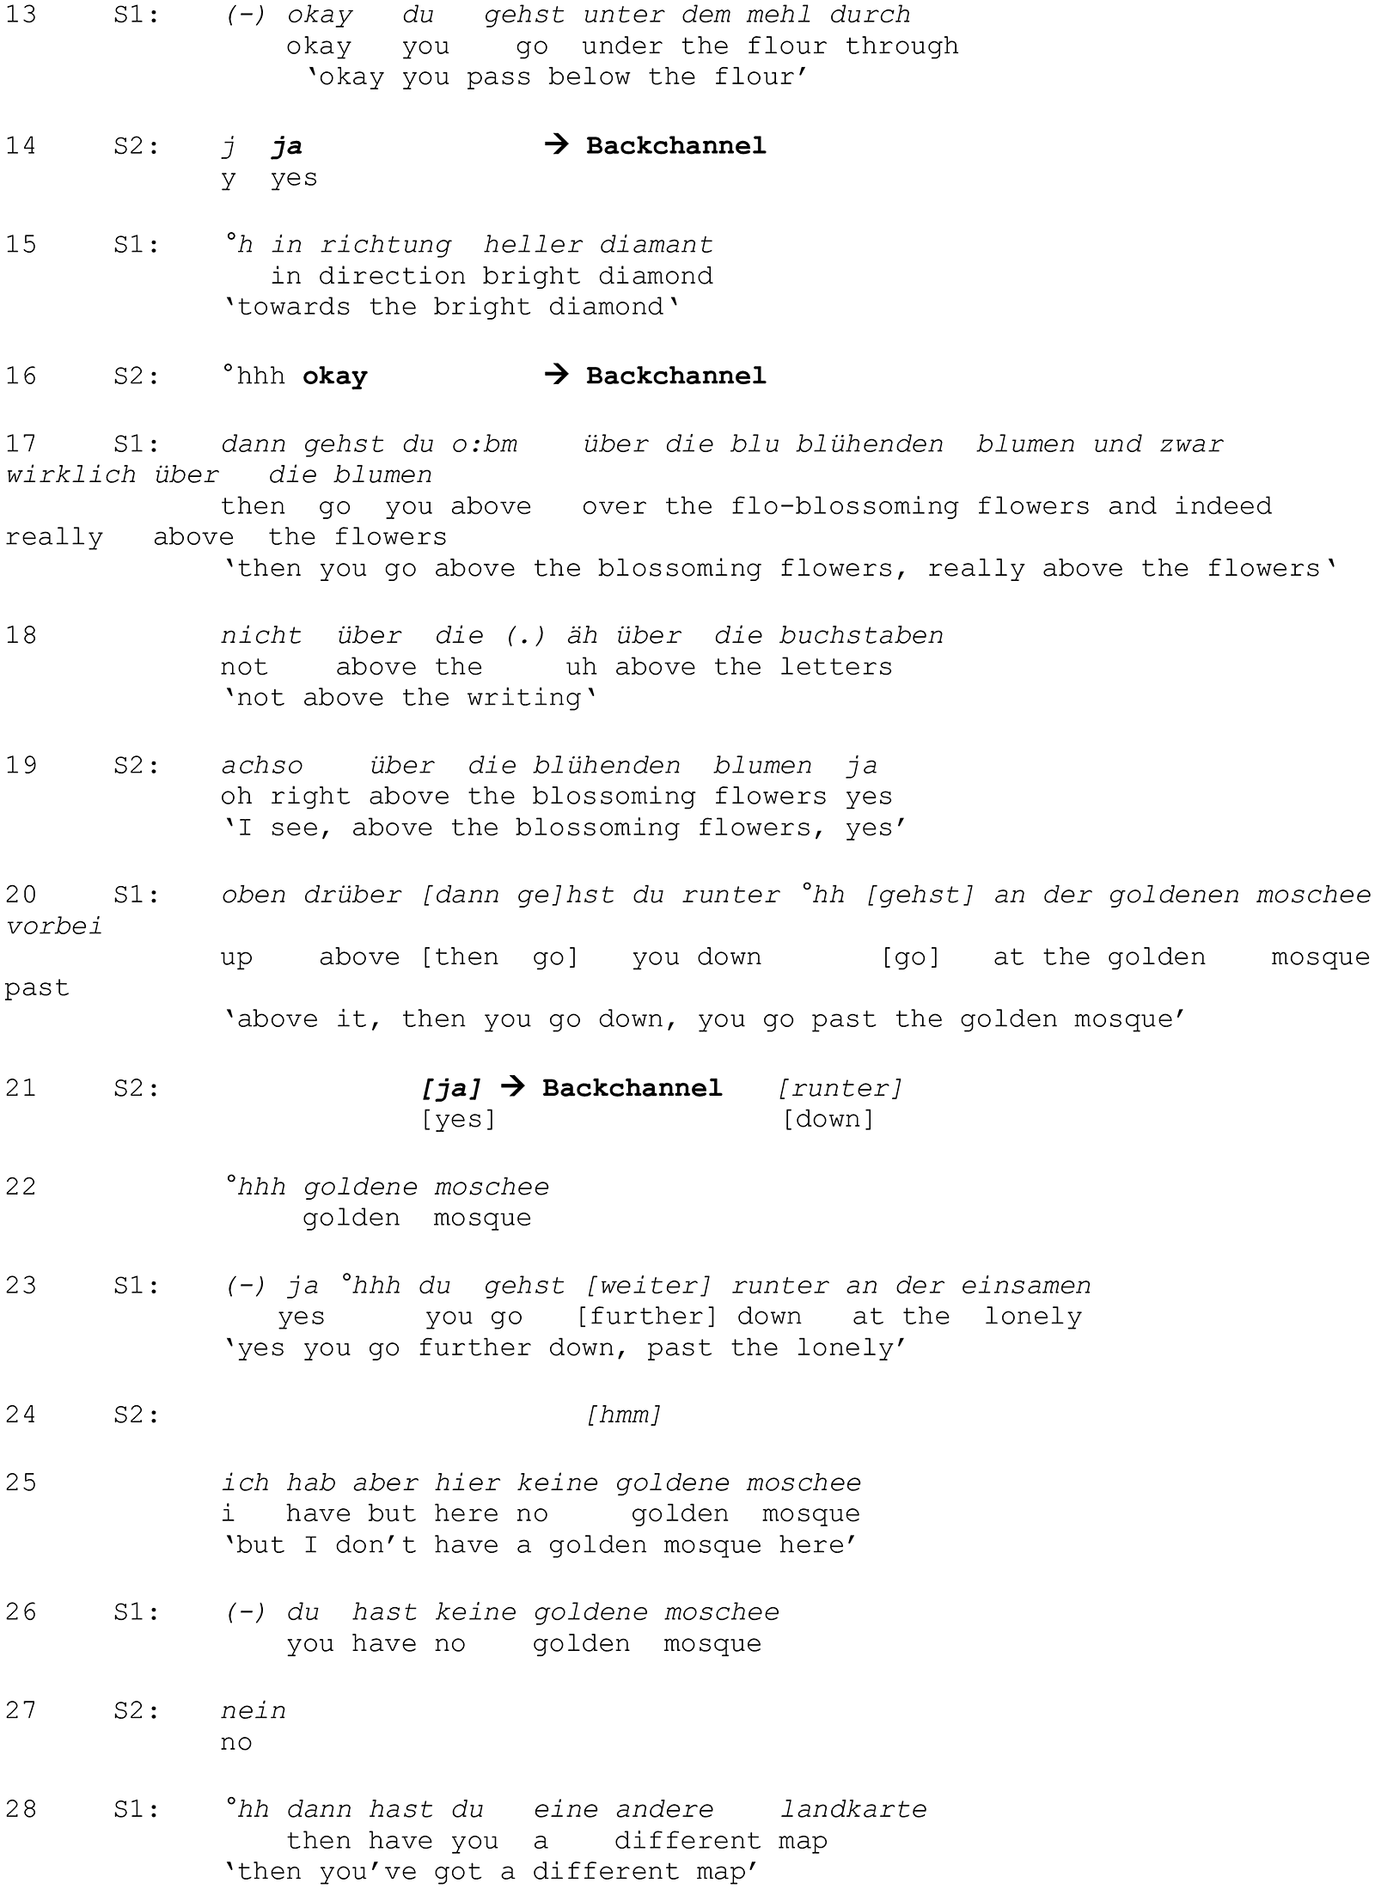
Figure 2. Example excerpt of a GAT transcription. Examples of backchannels are highlighted in bold (lines 14, 16, 21).
We extracted 2,371 BC tokens from the corpus. BCs were coded according to strict criteria, following the Acknowledgement move in Carletta et al. (Reference Carletta, Isard, Isard, Kowtko, Doherty-Sneddon and Anderson1997), but excluding repetitions. Thereby, all utterances signalling that a speaker had heard and understood their interlocutor were initially included. Importantly, all of the following were then excluded: (1) turn-initial BCs (where a BC directly precedes a more substantial utterance by the same speaker, e.g., ‘Okay, and what’s next?’), (2) answers to polar questions (such as ‘Do you see this?’) and (3) answers to tag questions (such as ‘Near the corner, right?’). The remaining utterances were, therefore, BCs in a strict sense, as they were not part of a larger unit and were not explicitly invited by the interlocutor (e.g., through a question). Note that this operationalisation of BCs differs markedly from looser categorisations such as the ‘VSU’ (very short utterance) category used in, for example, Heldner et al. (Reference Heldner, Edlund, Hjalmarsson and Laskowski2011) (see Fujimoto, Reference Fujimoto2009, for a discussion regarding issues of terminology in previous work on BCs). All annotation and coding were performed by the first author as well as a previously trained student assistant. In the very rare cases of ambiguity or disagreement regarding the coding of an utterance, both annotators discussed the issue and arrived at a unanimous solution.
For the prosodic analysis of BCs, we first hand-corrected and smoothed all pitch contours using Praat (version 6.1.09) (Boersma & Weenink, Reference Boersma and Weenink2020) and mausmooth (Cangemi, Reference Cangemi2015). We then used a custom Praat script to extract pitch values at 10% and 90% of token duration and calculated the difference between those values in semitones (STs; with a reference value of 1 Hz) (cf. Ha et al., Reference Ha, Ebner and Grice2016; Sbranna et al., Reference Sbranna, Möking, Wehrle and Grice2022; Wehrle et al., Reference Wehrle, Grice and Vogeley2023b). If there was no pitch information available at either one of these time points (usually because there were unvoiced segments at the edges or because non-modal voice quality was used), the point of extraction was moved by 10%, yielding, for example, 20%–90% or 10%–80% windows. This procedure was repeated up to a maximum of 40% at the beginning and 70% at the end. The vast majority of pitch values (>80% of our data), however, were extracted within 20% of the start duration and 80% of the end duration. We finally verified all extracted values through a comparison with the original extracted BC token and the smoothed pitch contour and excluded any tokens that were unsuitable for intonational analysis. This was typically the case for tokens with a very short vocalic portion and/or those produced with creaky voice.
2.4. Statistical analysis
In reporting experimental results, we emphasise a fully transparent and visually rich descriptive analysis combined with applications of Bayesian modelling and inference. We aim to provide a comprehensive understanding of results first through detailed description and the extensive use of data visualisation (Anscombe, Reference Anscombe1973; Matejka & Fitzmaurice, Reference Matejka and Fitzmaurice2017). Bayesian inference is used in the spirit of complementing, not superseding the descriptive, exploratory analysis that we consider to be at the heart of this work. Therefore, not all details of Bayesian modelling are reported for all analyses, but all information can be found in the accompanying OSF repository at https://osf.io/jcb7t/.
We chose a Bayesian rather than a frequentist approach mainly because it is (1) better suited to exploratory work as well as limited sample sizes, (2) more conservative, more robust and more transparent when properly applied and (3) more closely aligned with common human intuitions about the interpretation of statistical tests in general and the notion of significance in particular (Dienes, Reference Dienes2011; Gelman et al., Reference Gelman, Vehtari, Simpson, Margossian, Carpenter, Yao, Kennedy, Gabry, Bürkner and Modrák2020; McElreath, Reference McElreath2020; McShane & Gal, Reference McShane and Gal2017; Winter & Bürkner, Reference Winter and Bürkner2021).
We are also committed to an in-depth analysis appropriately accounting for individual- and dyad-specific behaviour and variability (Cangemi et al., Reference Cangemi, Krüger and Grice2015, Reference Cangemi, El Zarka, Wehrle, Baumann and Grice2016; Wehrle, Reference Wehrle2021; Wehrle et al., Reference Wehrle, Grice and Vogeley2023b). The importance of considering scientific data at the level of the individual (or dyad) is not limited to this study, nor to the fields of linguistics and cognitive science. It is, however, made all the more critical when we aim to describe and understand the behaviour of a group of speakers as intrinsically heterogeneous as the sample population of autistic adults.
We used Bayesian multilevel linear models implemented in the modelling language Stan (version 2.29) (Stan Development Team, 2022) via the package brms (version 2.16.3) (Bürkner, Reference Bürkner2017) for the statistical computing language R (version 4.1.2) (R Core Team, 2022), which we used in the software RStudio (version 2021.09.1) (RStudio Team, 2021).
Analysis and presentation of Bayesian modelling broadly follows the example of Franke and Roettger (Reference Franke and Roettger2019), but is also informed by a number of other tutorials (McElreath, Reference McElreath2020; Vasishth et al., Reference Vasishth, Nicenboim, Beckman, Li and Kong2018; Winter & Bürkner, Reference Winter and Bürkner2021).
We report expected values (𝛽) under the posterior distribution and their 95% credible intervals (CIs). We also report the posterior probability that a difference 𝛿 is greater than zero. In essence, a 95% CI represents the range within which we expect an effect to fall with a probability of 95%. We consider these CIs in and of themselves as the most relevant outcome of Bayesian modelling.
We used regularising weakly informative priors for all models (Lemoine, Reference Lemoine2019) and performed posterior predictive checks with the packages brms (version 2.16.3) (Bürkner, Reference Bürkner2017) and bayesplot (version 1.8.1) (Gabry & Mahr, Reference Gabry and Mahr2021) in order to verify that the priors were suited to the dataset. Unless otherwise specified, four sampling chains ran for 4,000 iterations with a warm-up period of 2,000 iterations for each model. We used models with skew-normal distributions for the analyses of entropy and prosody (which performed better than models with normal or log-normal distributions) and negative binomial regression for the analysis of BC rates. We tested both negative binomial regression and Poisson regression and found the negative binomial model to perform better (negative binomial regression is also usually the more conservative choice and thereby reduces the chance of Type I errors; see Winter & Bürkner, Reference Winter and Bürkner2021). Besides the packages for Bayesian modelling, we made extensive use of the packages included in the tidyverse collection for performing data import, tidying, manipulation, visualisation and programming (Wickham et al., Reference Wickham, Averick, Bryan, Chang, McGowan, François, Grolemund, Hayes, Henry and Hester2019).
3. Results
In this section, we will present results first on the rate of BCs, then on the lexical types of BCs used and finally on their prosodic realisation. The duration of individual BC tokens was very consistent and practically identical across groups, with a grand mean of 375 ms (SD = 161). It will therefore not be considered in any more detail in the following.
3.1. Rate of backchannels
Overall, speakers in the ASD group produced fewer BCs per minute of dialogue, with an average of 6.9 BCs per minute, compared to the CTR group with an average of 9.2 BCs per minute. Bayesian modelling strongly suggests that this is a robust difference between groups (see Section 3.1.1).
Analysis at the dyad level confirms the impression from the group-level analysis. The four lowest mean values of BCs per minute were produced by autistic dyads (the lowest rate being 3 BCs per minute), whereas three out of the four highest mean values were produced by non-autistic dyads (including the highest rate, 12.3 BCs per minute) (see Fig. 3). Please note that these data do not, however, suggest a clear dividing line between the behaviour of autistic and non-autistic dyads. They instead reveal a considerable degree of overlap between groups. For instance, although the ASD group as a whole clearly produced fewer BCs per minute, the dyad with the second-highest overall rate was part of the ASD group.
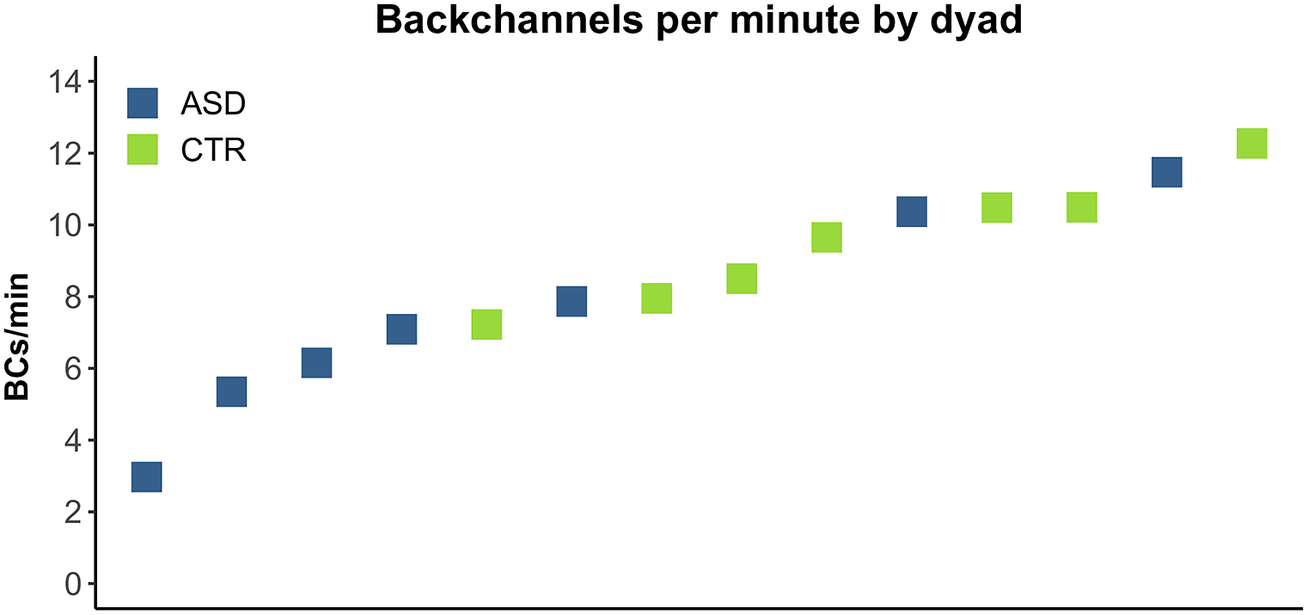
Figure 3. Rate of backchannels produced per minute of dialogue by dyad. ASD group in blue, CTR group in green.
We only considered data at the level of the dyad and not the level of the individual for this analysis. We did so because the rate of backchannelling fundamentally depends on the behaviour of the interlocutor and their production of silences and BC-inviting cues, among other factors (and because interlocutors should not be treated as independent by default, due to factors such as accommodation to the conversational partner; see, e.g., Wehrle et al., Reference Wehrle, Grice and Vogeley2023b; Winter & Grice, Reference Winter and Grice2021).
We verified that the group difference in the rate of BCs per minute of dialogue was not dependent on different overall amounts of speech produced: there were highly similar proportions of silence (ASD: 24%; CTR: 22.2%), single-speaker speech (ASD: 72.5%; CTR: 73.1%) and overlapping speech in both groups (ASD: 3.5%; CTR: 4.7%) (see Wehrle, Reference Wehrle2021, Section 12.4). A related way of corroborating this finding is to calculate the rate of BCs not per minute of dialogue but per minute of speech produced within a dialogue (i.e., excluding all stretches of silence). This analysis yields an almost identical finding to the above, with a lower rate for the ASD (9.1) compared with the CTR group (11.8). In other words, the CTR group produced about 1.3 times more BCs than the ASD group, regardless of whether we consider the rate of BCs per minute of dialogue or per minute of speech.
3.1.1. Bayesian modelling
We fitted a Bayesian model to the rate of BCs per minute using negative binomial regression. The input for the model was a data frame with one row per dyad and columns to specify the overall count of BCs and the duration of the respective dialogue. The total number of BCs was used as the dependent variable, with group as the independent variable and dialogue duration as the offset (or exposure variable).
Bayesian modelling supports the observation that there was a difference between groups of autistic and non-autistic dyads. The group difference in the model is reported with the ASD group as the reference level. Mean 𝛿 = 2.25, indicating a higher rate of BCs in the CTR group. The 95% CI [−0.22, 4.88] includes zero by a small margin and the posterior probability 𝑃 (𝛿 > 0) is 0.94. Although these values reflect a more than negligible degree of uncertainty, the overall tendency towards a higher rate of BCs in non-autistic speakers is very strong. At the very least, we can conclude that, based on the model, the data and our prior beliefs, it is far more probable that there was a reliable difference between groups than that there was not.
3.1.2. BC rate by dialogue stage and speaker role
To analyse the rate of BCs for different dialogue stages, we used the resolution of the first mismatch as a cut-off point for splitting dialogues into two epochs: ‘beginning’ and ‘remainder’. A mismatch was considered to be resolved when participants moved on from discussing the issue of the first mismatch between maps to the rest of the task, since at this point the participants had irrevocably established that their maps differed (Janz, Reference Janz2019; Wehrle, Reference Wehrle2021; Wehrle et al., Reference Wehrle, Cangemi, Janz, Vogeley and Grice2023a). The beginning stage as operationalised in this way represents approximately the first 5 min, or 25%, of overall dialogue duration on average.
Fig. 4 shows that the overall pattern of the ASD group producing fewer BCs remains very clear for the early stages of dialogue, but not for the remainder. Specifically, in the first few minutes of dialogue, the ASD group produced an average rate of 5.8 BCs per minute and the CTR group produced an average rate of 9.8 BCs per minute (𝛿 = 4). In the remainder of the dialogue, rates were more similar between groups, with the ASD group producing an average rate of 7.2 BCs per minute and the CTR group producing an average rate of 8.6 (𝛿 = 1.4).
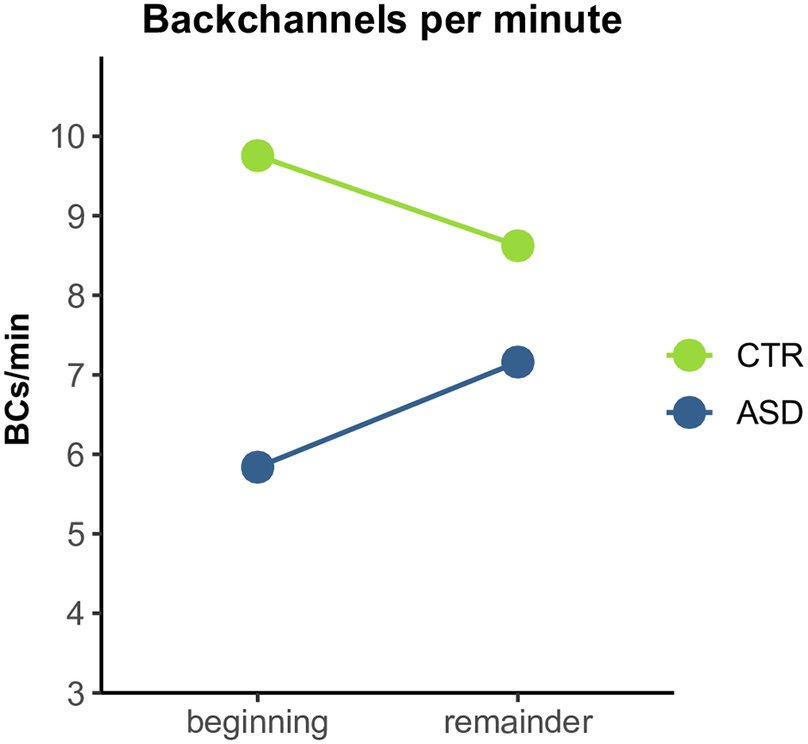
Figure 4. Rate of backchannels per minute by dialogue stage (before and after resolution of the first Mismatch). CTR group in green, ASD group in blue.
Bayesian modelling clearly confirms the difference between groups in the early stages of dialogue, but not in the remainder. Differences between groups are presented with the ASD group as the reference level. For dialogue before the resolution of the first mismatch, mean 𝛿 = 3.9, with a 95% CI of [0.9, 7.13] and a posterior probability 𝑃 (𝛿 > 0) of 0.98. This reflects a robust difference, with a higher rate of BCs in the CTR group. For dialogue after the resolution of the first mismatch, mean 𝛿 = 1.89, with a 95% CI of [−1.01, 4.89] and a posterior probability 𝑃 (𝛿 > 0) of 0.87. This is indicative of the same trend as for the early dialogue stage, but does not signify a robust difference between groups.
At the dyad level, we can see that a high degree of variability underlies the group-level results, particularly in the ASD group, where by-dyad variability was much greater than in the CTR group (see Fig. S1 in the Supplementary Material). To compare rates in the beginning and the remainder of the dialogue, we calculated ratios, such that a ratio of 2, for instance, would represent twice as many BCs after resolution of the first mismatch. For all CTR dyads, the rate of BCs was similar throughout the conversation, represented in ratios ranging from 0.78 to 1.19. In this group, two dyads produced almost exactly the same rate throughout (with ratios of 1 and 1.05, respectively), one dyad produced fewer BCs in the beginning, and three dyads produced more BCs in the beginning (see Table S1 in the Supplementary Material for ratios by dyad). Autistic dyads lie at the edges of the overall distribution, with all of them producing either higher or lower ratios than any non-autistic dyad. Ratios ranged from 0.64 to 2.78. No dyad in the ASD group produced the same (or nearly the same) rate of BCs throughout, four dyads produced fewer BCs in the beginning (reflecting the group-level results) and three dyads produced more BCs in the beginning.
Finally, for comparing the roles of instruction giver and instruction follower, we calculated the relative duration of BCs in proportion to the duration of all speech produced (excluding silence). A comparison based on overall dialogue duration would not be informative, as instruction followers produced far less speech overall than instruction givers. As BCs are specifically a signal produced by the listener, it is not surprising that instruction followers produced a much higher proportion of BCs than givers, in both the ASD group (followers: 11.2%; givers: 2.1%) and in the CTR group (followers: 14.5%; givers: 3.4%).
3.2. Lexical realisation
In this section, we examine the frequency of occurrence for different lexical types of BCs. We divided BC tokens into four main categories, that is, genau (‘exactly’), ja (‘yes/yeah’), okay and finally what we refer to as ‘non-lexical’ BCs and transcribed mmhm. The vast majority of the tokens in the mmhm category were produced with two energy peaks, leading to their perception as ‘disyllabic’ and corresponding to the orthographic form of our chosen category label, ⟨mmhm⟩. Although the remaining tokens only had one clear energy peak each, being closer in realisation to what might be transcribed as ⟨mm⟩ (or described as ‘monosyllabic’), we subsumed them under the same category of mmhm as there is no clear and categorical distinction between these two types of phonetic realisation, but rather a continuum, and because the ⟨mmhm⟩ realisation (with two peaks) was far more frequent overall.
Our four main categories (genau, ja, mmhm and okay) cover 91.8% (n = 2,177) of all BC tokens in the dataset. All remaining tokens were classified as other (n = 194). The most frequent types of BCs in this other category were gut (‘good/fine’), alles klar (‘alright’) and richtig/korrekt/exakt (‘right/correct/exactly’), in descending order of frequency.
Results at the group level show that the choice of BC type was very similar between groups overall (see Fig. S2 in the Supplementary Material). The most commonly used BC type in both groups was ja (‘yes/yeah’), with proportions of 47.7% (ASD; n = 336) and 44% (CTR; n = 733), respectively. The second most frequent BC type differed between groups. The ASD group showed a stronger preference for mmhm (25.6%; n = 180) than the CTR group (16.5%; n = 275), but in turn produced fewer okay tokens (11.6%; n = 82) than the CTR group (20.5%; n = 341). The remainder was made up of tokens from the genau [ASD: 7.4% (n = 52); CTR: 10.7% (n = 178)] and other categories [ASD: 7.7% (n = 54); CTR: 8.4% (n = 140)].
Analysis at the level of the individual reveals some intriguing speaker-specific variation that also has implications for the group comparison, but is hidden when only considering proportions averaged across speakers within a group. The general trends seen in the group analysis are clearly reflected in the behaviour of individual speakers, and the choice of BC type remained similar across groups. We can observe, however, that half of the ASD speakers used a narrower range of BC types and showed clearer preferences for particular BC types over others, compared with CTR speakers. These differences will be described first in absolute terms and then using Shannon entropy as a measure of diversity in the following.
All 14 speakers from the CTR group used all five categories of BCs. This was not the case for the ASD group, in which only 7 out of 14 speakers used BCs from all five categories and only 9 speakers used BCs from all four main categories (excluding other). Additionally, ASD speakers accounted for six out of the seven clearest individual preferences. For instance, speaker M10A produced 75% ja (n = 75) and two speakers from the same dyad both produced 69% ja [M04 (n = 40) and M05 (n = 24)]. In contrast, most CTR speakers used a fairly even mixture of different BCs. Overall, 11 out of 28 speakers used just one type of BC for 50% or more of all BC tokens produced, and 8 out of these 11 speakers (72%) were part of the ASD group.
3.2.1. Entropy as a measure of backchannel diversity
While the above pattern of results can be understood quite well through description and visualisation alone, this approach does not provide us with any quantifiable measure of how diverse the lexical realisation of BCs actually was by group or individual speakers. (We focus here on speakers rather than dyads for the sake of clarity, having verified that analysis at the dyad level yields equivalent results.) We can use the measure of Shannon entropy as an index of diversity for this purpose (Shannon, Reference Shannon1948): the higher the value of entropy (H), the more diverse the signal.
To give two extreme examples from our dataset, Speaker M13, from the CTR group, had the highest entropy value (H = 2.23) (see Fig. 5). Like all non-autistic speakers, M13 produced BCs from all five categories, and in this specific case, there was no strong preference for any one type. The least frequent category was mmhm, with 13.3% (n = 16), and the most frequent category was ja, with 34.3% (n = 36). This high degree of diversity or, in other words, less predictable behaviour, is reflected in a higher entropy value. By contrast, Speaker M10A, from the ASD group, had the lowest entropy value of all speakers (H = 1.18). Interestingly, this speaker in fact belonged to the 50% of individuals from the ASD group who did use BCs from all five categories. However, tokens were far from evenly spread out among these categories. M10A used ja in 75% of cases (n = 75), as mentioned in the preceding section, followed by mmhm with a proportion of 14% (n = 14). Such a clear preference for one type of BC corresponds to a lower degree of diversity, or in other words, more predictable behaviour, and is reflected in a lower entropy value.
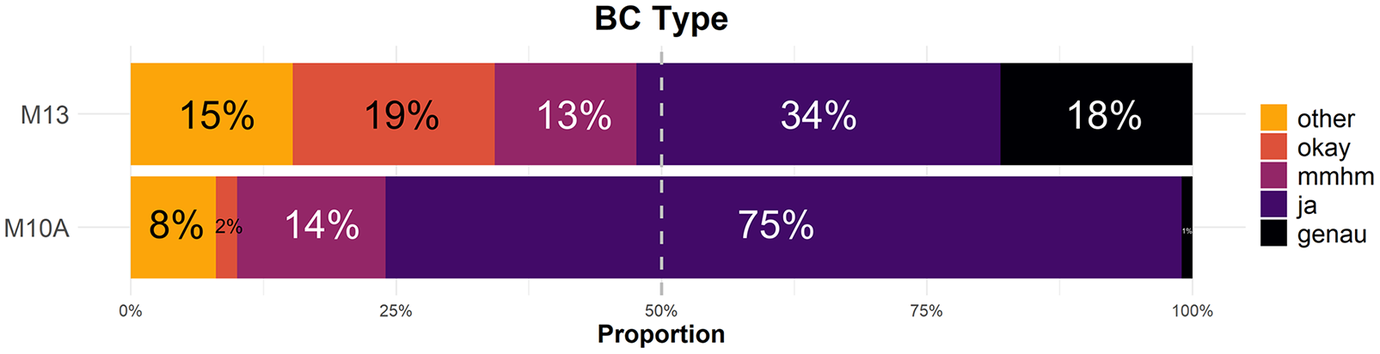
Figure 5. Stacked bar charts showing proportions of different backchannel types for the two speakers with the highest entropy value (M13, CTR group; 𝐻 = 2.23) and the lowest entropy value (M10A, ASD group; 𝐻 = 1.18), respectively.
Entropy values for all 28 speakers are shown in Fig. 6, revealing a clear pattern of higher entropy values for non-autistic speakers overall. Note that while in this case there is a fairly clear separation between groups, there is still an overlap between them. For instance, several autistic speakers have very high values of entropy and one non-autistic speaker has the second lowest entropy value overall.
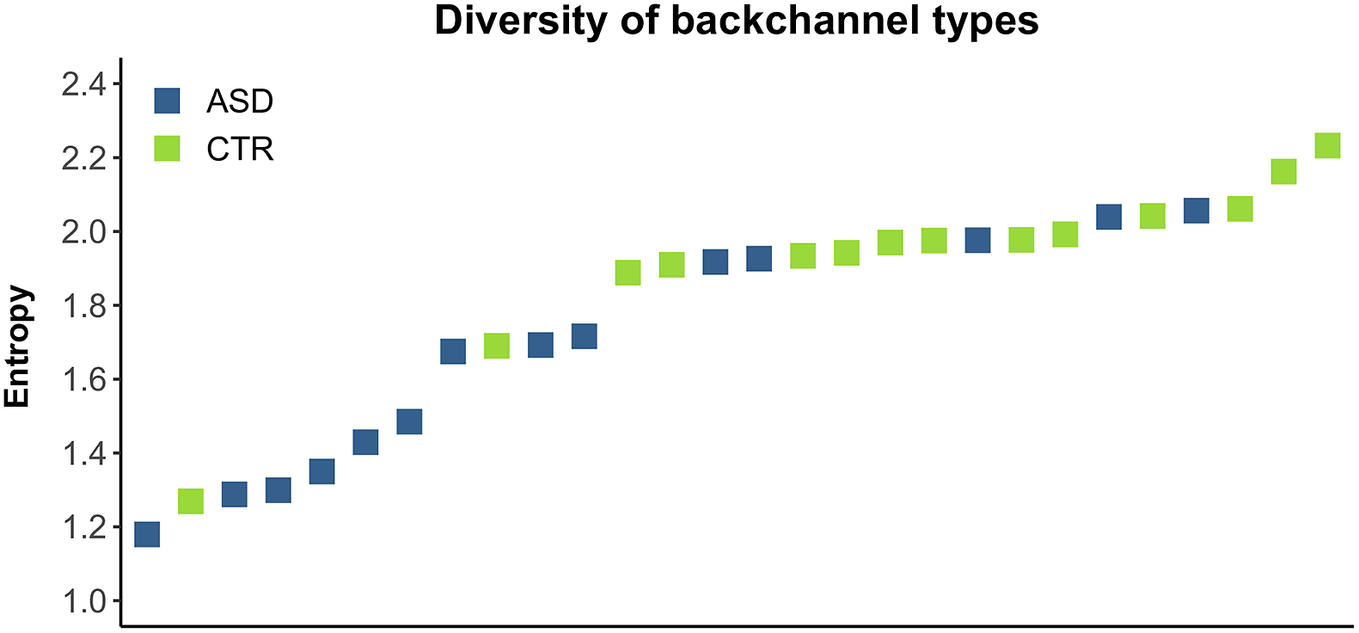
Figure 6. Entropy as a measure of the diversity of lexical types of backchannel produced, by speaker. ASD group in blue, CTR group in green.
Bayesian modelling confirms that BCs were more diverse in the CTR group. Model output clearly supports the observation that entropy was higher in the CTR than in the ASD group (reference level): 𝛿 = 0.21, 95% CI [0.05, 0.38], 𝑃 (𝛿 > 0) = 0.99. The lower end of the 95% CI is relatively close to 0, but because values are generally low (the maximum possible entropy value here is 2.32) and the posterior probability is very high, we consider this as compelling evidence.
3.2.2. Speaker roles and dialogue stages
The choice of BC type was consistent throughout across dialogue stages for both groups. When considering speaker roles, however, we found some interesting differences. For example, genau (‘exactly’) was used far more frequently in the speech of instruction givers compared with followers, across groups (ASD: followers 2.3% – givers 21.5%; CTR: followers 5% – givers 23.5%). This was compensated for with a decrease of ja (‘yes/yeah’) and mmhm, while the proportion of okay remained more or less constant (in both groups; more details in Wehrle, Reference Wehrle2021; see also Janz, Reference Janz2022; Sbranna et al., Reference Sbranna, Wehrle and Grice2023). The most obvious explanation is that genau (‘exactly’) is likely to be an appropriate choice for a speaker who possesses, provides and, crucially, confirms information regarding the route and landmarks, but less so for an instruction follower (and vice versa for the non-lexical BC type mmhm).
3.3. Intonational realisation
No sufficient pitch information for prosodic analysis could be extracted for 302 tokens; these were usually rather short and/or produced with non-modal voice quality. After careful inspection of the extracted pitch contours for the remaining tokens, we excluded a further 20 that were not suitable for intonational analysis (most of these were produced with very creaky voice). Following this step, 2,069 BC tokens remained for analysis (87.3% of the original 2,371). It is interesting to note that there was a far lower proportion of the usually disyllabic and fully voiced mmhm type (5%) in the subset of excluded tokens than in the full dataset, reflecting the fact that the other lexical types (e.g., okay) are inherently more susceptible to being realised in forms with reduced periodic energy, which in turn makes such realisations problematic for prosodic analysis.
Finally, we removed all tokens that were not part of the four main categories (ja, mmhm, okay and genau). This necessitated the exclusion of a further 137 tokens, leaving a total of 1,932 tokens (81.4% of the original 2,371). We took this step as we analysed prosodic realisation separately for different lexical types of BCs. As we shall see, speakers used very specific mappings for different BC types, thereby greatly reducing the utility of a monolithic analysis across different types.
We will first describe a continuous analysis, and then a categorical view in which realisations were split up into the three categories of rising, falling and level pitch contours. The categorical analysis not only facilitates detecting and describing overarching patterns of prosodic realisation, but also makes it possible to explicitly account for the potentially distinct status of level (or flat) intonation contours (cf. Grice et al., Reference Grice, Ritter, Niemann and Roettger2017; Sbranna et al., Reference Sbranna, Möking, Wehrle and Grice2022; Wehrle et al., Reference Wehrle, Grice and Vogeley2023b).
Dialogue stages and speaker roles did not have any major effect on intonational realisation. There was a slight tendency for more falling contours in the later stages of dialogue across groups and BC types. Similarly, there was a slight overall tendency for more falling contours in the speech of instruction givers compared with followers across groups and BC types. However, as these effects were weak and not consistent across speakers, we will disregard them in the following analyses.
3.3.1. Continuous analysis
Fig. 7 shows violin (and scatter) plots for intonation contours by BC type and across groups. Values are shown across groups in order to emphasise the differences between types of BCs. Overall, intonational realisation greatly differed according to BC type. For instance, mmhm tokens were produced almost entirely with rising intonation by both groups of speakers, while there was a clear preference for falling intonation contours on genau for both groups.
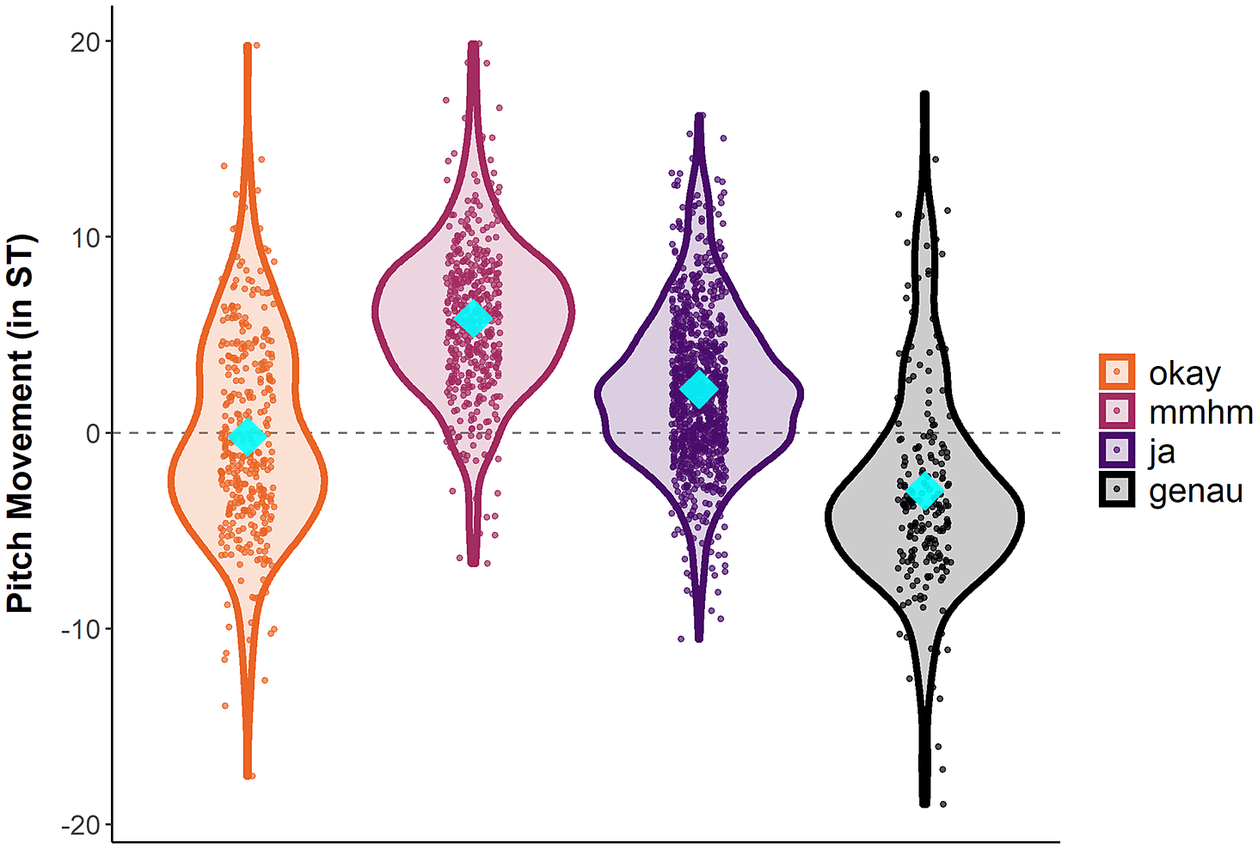
Figure 7. Intonational realisation of backchannels by type in semitones (pooled across speakers and groups). Negative values indicate falling contours; positive values indicate rising contours. Blue diamonds represent mean values.
An analysis by group and lexical type reveals that there were between-group differences in intonational realisation for all lexical types except mmhm; summary values are shown in Table 2.
Table 2. Intonational realisation of BCs by type and group. Negative values indicate falling contours; positive values indicate rising contours (ST = semitone)
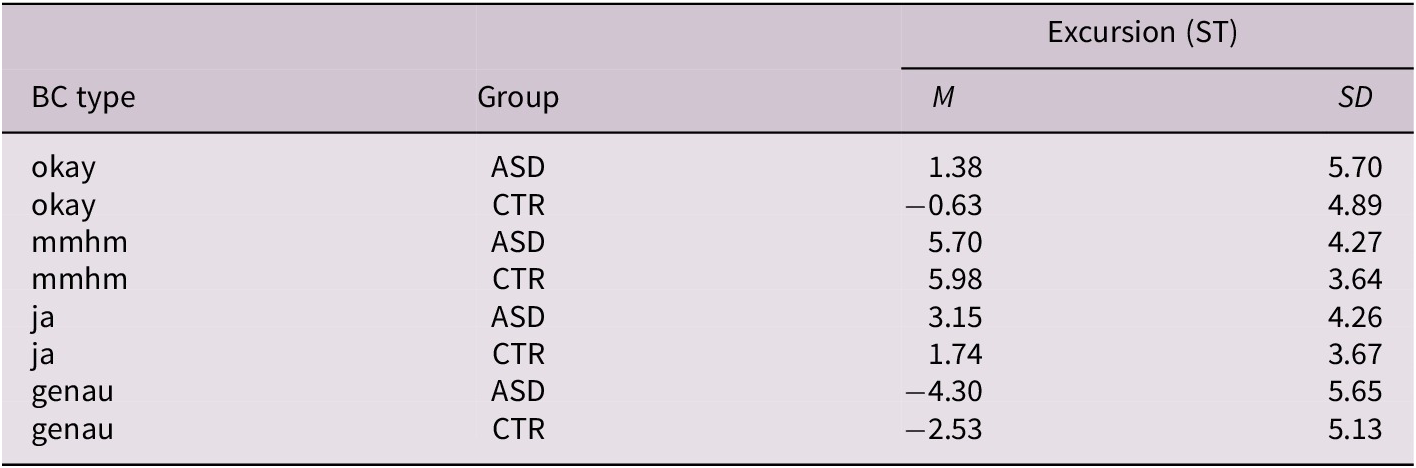
Abbreviation: ASD, autism spectrum disorder; CTR, control group.
Bayesian linear regression modelling confirms that there were robust group differences in the intonational realisation of three out of the four BC types (okay, ja and genau). In contrast, there was clearly no difference between groups for mmhm, recalling the special status of this non-lexical BC type and reflecting the fact that almost all mmhm tokens were realised with rises, in both groups. All details and model specifications can be found in the accompanying repository.
3.3.2. Categorical analysis
For the categorical analysis of intonation, we counted all contours with pitch movement within the range of ±1 ST as ‘level’ (i.e., all tokens with absolute values ≤1). An absolute pitch difference of 1 ST is somewhat greater than the thresholds of ‘just noticeable’ pitch differences reported in some experimental studies (Jongman et al., Reference Jongman, Qin, Zhang and Sereno2017; Liu, Reference Liu2013), but considerably smaller than the values proposed in ’t Hart (Reference ’t Hart1981). In any case, an auditory inspection of all tokens in the relevant range confirmed that pitch movement was subtle at most.
Fig. 8 shows the proportions of falling, level and rising pitch contours by group and BC type, and confirms that (a) differences between groups were subtle and (b) intonational realisation varied greatly by BC type. In other words, there was a specific, albeit probabilistic mapping of intonation contours to different types of BCs in the productions of both the ASD group and the CTR group. The only difference between groups noticeable at this level of analysis is a stronger overall preference for rising BCs in the ASD group. Averaging across lexical types, 67.6% (n = 427) of contours were rises in the ASD group, compared with 54% in the CTR group (n = 702). This pattern will be elucidated in the following through detailed analyses of speaker-specific behaviour and of the diversity of intonation contours produced.
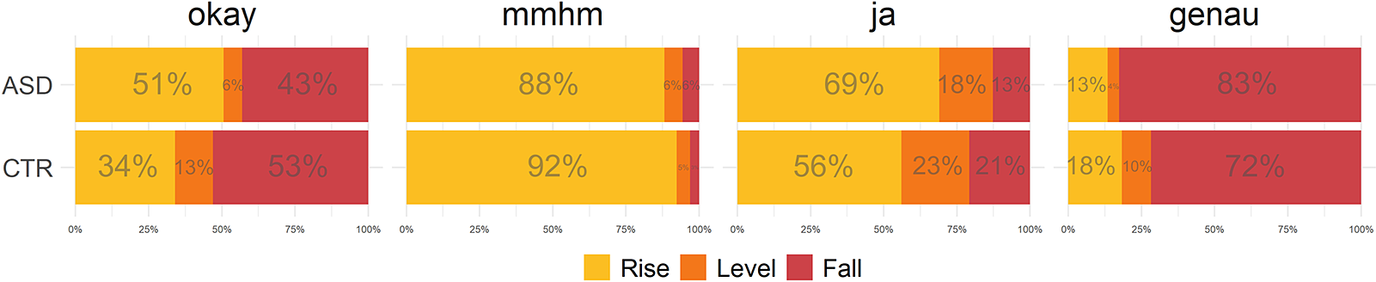
Figure 8. Intonation contour by group and backchannel type. Rising contours in yellow, level contours in orange, and falling contours in red. Level contours were defined as all tokens with a pitch difference in the range of +/- 1 semitone.
Speaker-specific analysis of the intonational realisation of BCs reveals that the behaviour of the CTR group was more homogeneous overall than that of the ASD group. The individual distributions of almost all non-autistic speakers matched the averaged group distribution to an almost uncanny degree, as shown in Fig. 9 (bottom two rows). This was not the case for the ASD group (uppermost rows), as around half of all autistic speakers used predominantly rising contours regardless of BC type.
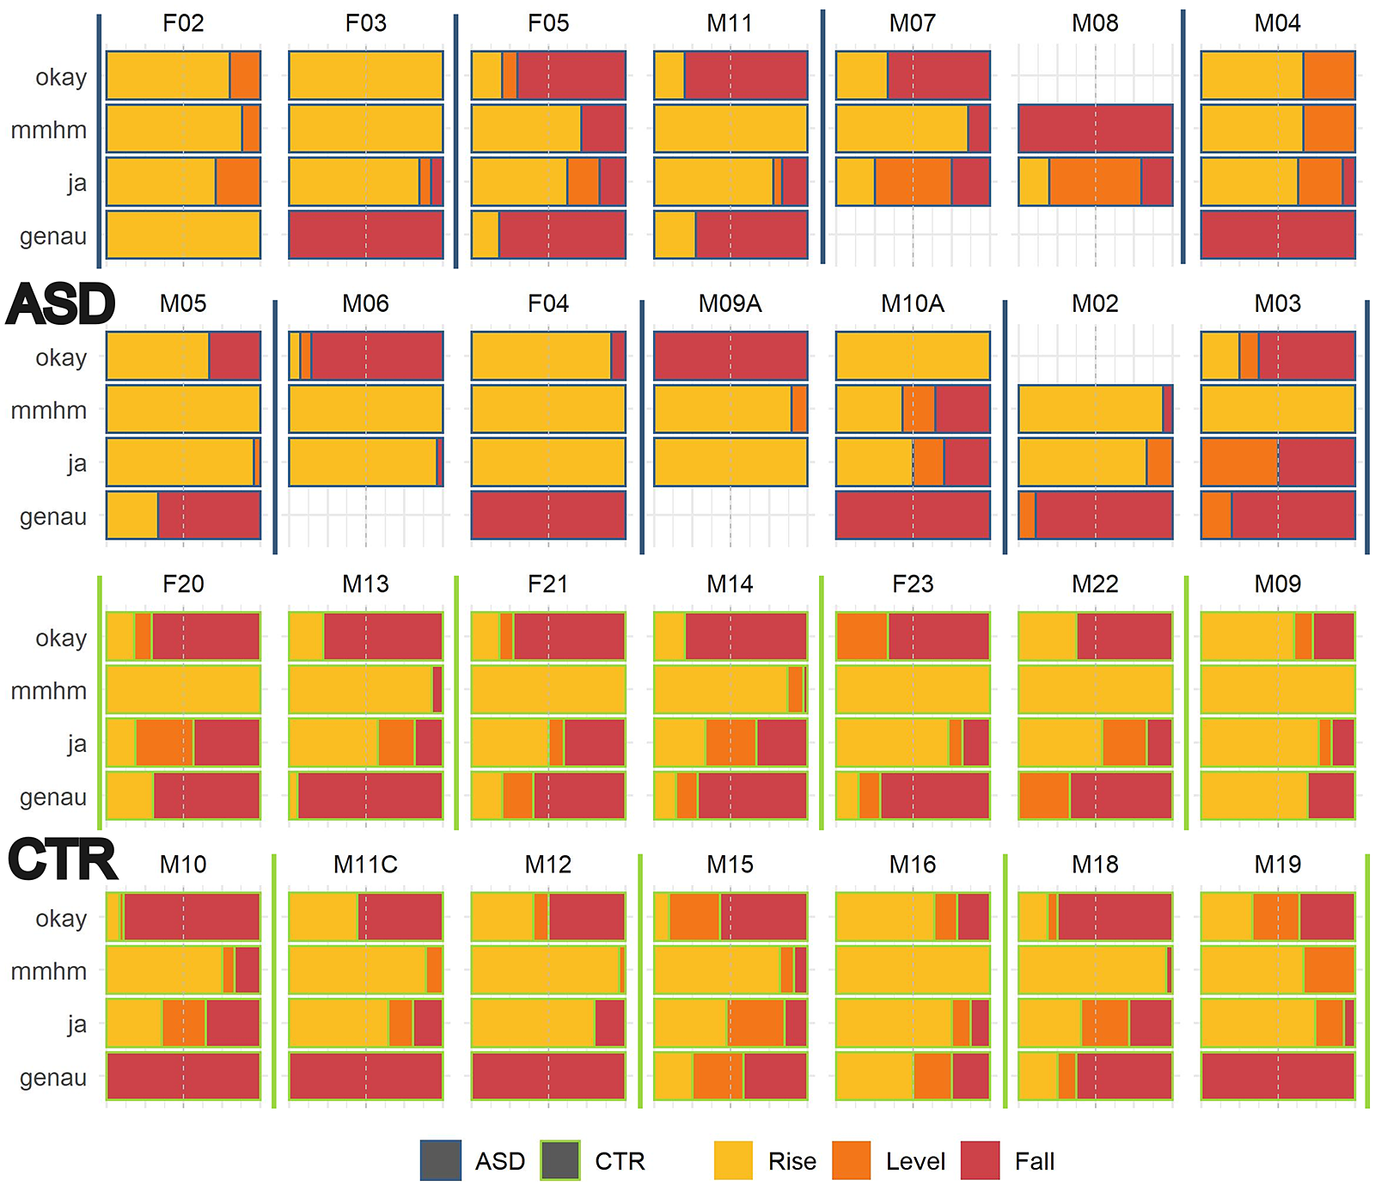
Figure 9. Intonation contour by speaker and backchannel type. ASD speakers in the first two rows and with blue outlines; CTR speakers in the bottom two rows and with green outlines. Dyads are separated by vertical lines. Rising contours in yellow, level contours in orange and falling contours in red. Level contours were defined as all tokens with a pitch difference in the range of +/- 1 semitone.
The relevance and robustness of the diversity of such distributions can be quantitatively analysed using the measure of Shannon entropy (as for the analysis of lexical types in Section 3.1). An entropy value (H) of 0 signifies that all BCs of a lexical type were produced with the same intonation contour, while the maximum entropy value, in this case, is 1.58 (equal proportions for all three types of contours). We calculated entropy per BC type and speaker. Results confirm that entropy was higher on average for non-autistic speakers in all categories except mmhm (see Table 3). Bayesian modelling confirms these group differences. The model output clearly suggests that group differences were robust for all lexical types except mmhm (details in the accompanying repository).
Table 3. Shannon entropy (H), measuring the diversity of intonation contours, by BC type and group
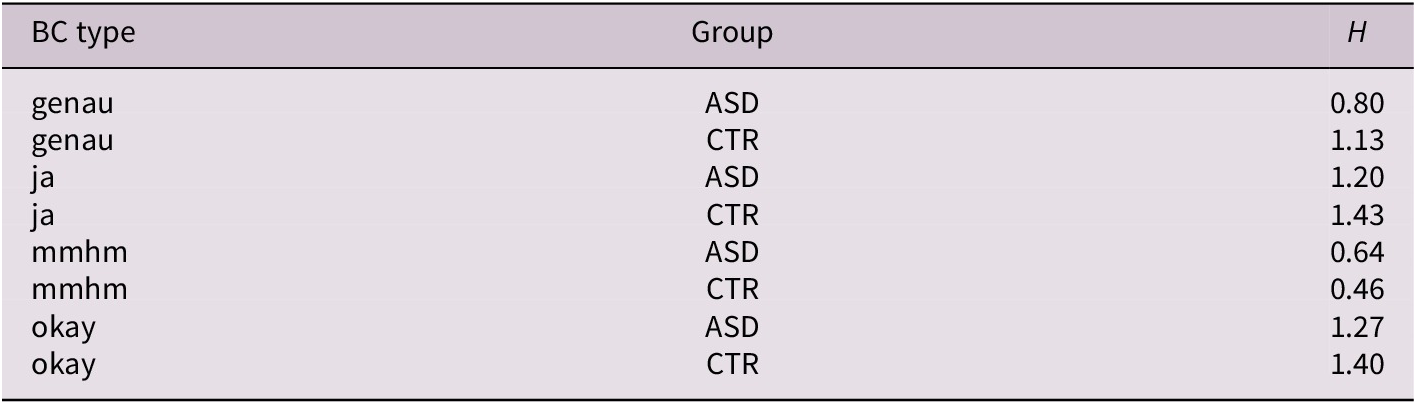
Abbreviation: ASD, autism spectrum disorder; CTR, control group.
4. Discussion
4.1. Summary
The in-depth analysis of BC productions presented in this paper has yielded a number of insights, both at a general level and specifically for the comparison of dialogues between autistic and non-autistic dyads. First, we found that ASD dyads produced fewer BCs per minute than CTR dyads and that this effect was particularly pronounced in the early stages of dialogue. Second, we found that ASD speakers showed clearer preferences for certain lexical types of BCs and used a smaller range of different types, whereas all CTR speakers employed BCs from all five lexical categories and spread tokens out more evenly across these different categories. Third, prosodic analysis revealed a number of interesting patterns. Across groups, intonation contours were (probabilistically) mapped onto specific BC types, with, for example, mmhm produced almost exclusively with rising intonation and genau (‘exactly’) produced predominantly with falling intonation. Despite these similarities, the ASD group and the CTR group differed in their prosodic realisations, with many ASD speakers, for example, preferring rises regardless of BC type, reflecting a less flexible mapping of intonation contour to BC type.
4.2. Implications
The result that autistic speakers produced fewer BCs per minute than matched controls suggests that autistic individuals are overall less inclined to verbally support the ongoing turn of their interlocutor. Backchannelling is a clearly prosocial and listener-oriented signal, which, moreover, is not governed by explicit rules and rather seems to follow complex, implicit, culture-specific conventions. Autistic individuals have been reported to show differences in understanding and interacting with their conversational partners. Furthermore, communication styles in ASD have been claimed to differ more from those of their non-autistic peers regarding implicit, rather than explicit, aspects of language. Thus, our analysis of BC rates can be linked to more general aspects of ASD.
The fact that there was a greater difference in the rate of BCs between groups in the early stages compared with the remainder of the dialogue furthermore suggests that ASD dyads eventually produced a backchannelling style quite similar to that of CTR dyads, but that they took a certain amount of time to reach this point (reflecting results from the domain of turn-timing; see Wehrle et al., Reference Wehrle, Cangemi, Janz, Vogeley and Grice2023a). We can further speculate that a lower rate of BCs in the ASD group might indicate that autistic speakers focussed more on the collaborative completion of the task at hand, rather than purely affiliative aspects of social interaction (Wehrle, Reference Wehrle2021). This interpretation is supported by results from Dideriksen et al. (Reference Dideriksen, Fusaroli, Tylén, Dingemanse and Christiansen2019), who found that (non-autistic) speakers produced a higher rate of BCs in fully free conversations compared with task-oriented conversations (such as Map Tasks).
BC productions in the ASD group were also characterised by a less flexible realisation regarding lexical choice. Autistic speakers tended to use a smaller range of different BC types, and in turn often showed a clear preference for one particular lexical type which was used for the majority of tokens. This is analogous to our findings for prosodic realisation: many autistic speakers predominantly used rises, across different BC types, whereas non-autistic speakers tended to use a more complex mapping of different intonation contours to different BC types. Differences between groups aside, this latter finding is significant in itself, as earlier accounts (of BCs in West Germanic languages) instead tended to assume a kind of ‘default’ BC contour (rising) for all different types of BCs. It is interesting to note that the prosodic realisation of the non-lexical BC mmhm comes closest to such a simple mapping—perhaps because its meaning has to be conveyed purely by means of prosody—and in turn particularly intriguing that many autistic speakers seemed to apply this one-to-one mapping to all different lexical types of BCs (in contrast to non-autistic speakers). This result can also be related to an earlier finding (involving speech from some of the same autistic subjects) according to which the ASD group showed a stronger preference (compared with a control group) for using one particular pitch accent type (H*) over other types (Krüger et al., Reference Krüger, Cangemi, Vogeley and Grice2018).
In sum, our findings suggest that a lower rate and a less variable realisation characterise BC production in ASD. We conclude (a) that autistic speakers are less inclined to use BCs in order to support the ongoing turn of their interlocutor in the early stages of a social interaction and (b) that when they do so, productions are less diverse and less flexible. This latter observation can be seen as a specific, micro-level instantiation of the pattern of circumscribed and stereotypical behaviour that is a key diagnostic criterion for ASD at the macro level.
While this work is the first study of backchannelling in (semi-)spontaneous conversations between autistic adults, our finding that autistic dyads used fewer BCs is in line with results from the only two related studies published to date (Rifai et al., Reference Rifai, Fletcher-Watson, Jiménez-Sánchez and Crompton2022; Yoshimura et al., Reference Yoshimura, Kawahara and Kikuchi2020). In expanding our perspective beyond ASD, we can further compare our findings to the extensive literature on BC productions across different cultures. This body of work suggests that listeners are highly sensitive to deviations from a given ‘standard’ realisation of BCs and that they judge such deviations negatively. It thus stands to reason that the differences in BC behaviour we have found in the ASD group are also likely to lead to misunderstandings and negative impressions, at least in interactions with non-autistic interlocutors. We would nevertheless like to stress that, while a comparative analysis of cross-cultural communication, on the one hand, and ‘cross-neurotype’ communication, on the other, doubtlessly has a certain heuristic value and intuitive appeal, cultural differences are obviously not equivalent to differences in cognitive style.
4.3. Limitations
The materials and methods used entail a number of limitations. First, we must acknowledge the fact that we deliberately limited participants to the spoken modality by placing an opaque barrier between them during the Map Task experiment. There is little doubt that visual signals such as head nods, gesture and eye gaze can be used in ways that are functionally equivalent to spoken BCs (Bevacqua et al., Reference Bevacqua, Pammi, Hyniewska, Schröder and Pelachaud2010; Hjalmarsson & Oertel, Reference Hjalmarsson and Oertel2012; Mesch, Reference Mesch2016; Rifai et al., Reference Rifai, Fletcher-Watson, Jiménez-Sánchez and Crompton2022; Saubesty & Tellier, Reference Saubesty and Tellier2016), and that there is a complex interplay between these modalities in real-life conversation. To account for this complexity and move closer to capturing natural communicative interactions, we are currently analysing speech and gaze in interactions captured with both audio and video recordings (Spaniol et al., Reference Spaniol, Janz, Wehrle, Vogeley and Grice2023).
Second, we have limited ourselves to a quantitative account and have not provided an analysis of the conversational context of BC productions here. Similarly, analysing the interaction of different functional types of feedback signals (e.g., passive recipiency vs. incipient speakership) with lexical and prosodic realisation holds promise for future investigations (Jefferson, Reference Jefferson1984; Jurafsky et al., Reference Jurafsky, Shriberg, Fox and Curl1998; Savino, Reference Savino2010; Sbranna et al., Reference Sbranna, Möking, Wehrle and Grice2022, Reference Sbranna, Wehrle and Gricen.d.).
Third, a specific methodological limitation concerns the prosodic analysis of BCs and filled pauses. In this account, we calculated the difference in pitch between two fixed time points (near the beginning and the end of each token) to represent intonation contours (having discarded all tokens for which the calculation of pitch was unreliable). As BCs are very short (<500 ms in almost all cases), this somewhat simplified view does still capture the essential qualities of intonation contours and is perceptually valid. Nevertheless, we cannot reliably account for very fine-grained details of intonational realisation and adequately capture more complex contours such as rise-fall-rises with the current method. Future investigations might avoid these shortcomings by using more temporally fine-grained techniques such as polynomial modelling (Belz & Reichel, Reference Belz and Reichel2015), generalised additive mixed modelling (Sóskuthy, Reference Sóskuthy2021) or analyses in the ProPer framework (Albert et al., Reference Albert, Cangemi and Grice2018, Reference Albert, Cangemi, Ellison and Grice2020; Cangemi et al., Reference Cangemi, Albert and Grice2019). Explorations of our dataset with the latter two methodologies suggest, however, that the very short durations of individual tokens can be problematic for analysis in at least these frameworks, and that achieving an improvement over the intonational analysis presented here is therefore not guaranteed. We will further explore approaches to the polynomial modelling of intonation contours in forthcoming work.
Finally, it is important to remember that all the differences between the groups we have described and all the characteristics of conversation in ASD that we have inferred from these differences are based on a very specific and limited sample. Not only were our participants in the ASD group German-speaking, mostly male and considerably older than the average experimental subject in linguistics and psychology. Most importantly, they were far from representative of the autism spectrum as a whole. Through a largely implicit selection procedure, participants were required to be (1) verbal, (2) willing and able to visit an outpatient clinic, (3) of average or above-average intelligence and (4) willing and able to take part in an unfamiliar experiment (in an unfamiliar location and wearing head-mounted microphones). These requirements act as a narrow-band filter, leaving us with behavioural data from only one peripheral region within the entire autism spectrum. Conversely, however, the nature of the sample analysed here also adds to the specificity and interpretability of the findings described in this paper.
5. Conclusion
We found clear differences between autistic and non-autistic speakers in terms of the rate as well as the lexical and prosodic realisation of BCs. The specific finding of a reduced rate of BCs in the early stages of interaction is likely to reflect more general differences in how unfamiliar social encounters are perceived and managed. The simple-to-calculate metric of BCs per minute might thus serve as a reliable correlate of general tendencies in autistic communication (assuming that our findings are confirmed in future investigations). Measuring the lexical diversity and prosodic realisation of BCs is a little less straightforward than measuring their rate, but the relevant finding of reduced diversity in the ASD group can be promisingly linked to the other main diagnostic criterion for ASD besides differences (or difficulties) in social communication, i.e. what is commonly described as restricted or inflexible behaviour.
The relevance of these specific findings to more general patterns of behaviour, along with the fact that BC behaviour in ASD has hardly been investigated in other studies to date, makes this area highly promising as an additional component in the description and assessment of autistic communication styles in future. This is emphasised by the fact that we found backchannelling to be the domain that differed most clearly between the ASD group and the CTR group in this corpus (Wehrle, Reference Wehrle2021), as compared with intonation style (Wehrle et al., Reference Wehrle, Cangemi, Vogeley and Grice2022), turn-taking (Wehrle et al., Reference Wehrle, Cangemi, Janz, Vogeley and Grice2023a) and the production of filled (Wehrle et al., Reference Wehrle, Grice and Vogeley2023b) as well as silent pauses (Wehrle et al., Reference Wehrle, Vogeley and Grice2023c). Ultimately, we hope that our findings might help to contribute to an acceptance of neurodiversity in highlighting ASD-specific communication strategies and their potential role in creating misunderstandings in cross-neurotype communication.
Supplementary material
The supplementary material for this article can be found at http://doi.org/10.1017/langcog.2023.21.
Acknowledgements
Very special thanks to Bodo Winter for excellent advice on and support with the analysis. Big thanks also to Martina Krüger for help with recordings and Alicia Janz for recordings, annotation and processing. We are also grateful to two anonymous reviewers for their considered and constructive feedback.
Data availability statement
All data and scripts are available in the OSF repository at https://osf.io/jcb7t/. The data folder contains csv files with the experimental and subject data. The main folder contains an RMarkdown file (in .rmd and .html formats) in which the entire manuscript is reproduced along with code chunks used to produce all analyses, plots and models, placed adjacent to the relevant parts of the text.
Funding statement
Funding was provided by the Deutsche Forschungsgemeinschaft (DFG; Grant No. 281511265; SFB 1252) and by the Studienstiftung des Deutschen Volkes. The funders had no role in study design, data collection and analysis, the decision to publish or the preparation of the manuscript. An earlier version of parts of this work was reported in one chapter of the first author’s PhD dissertation.
Author contribution
Conceptualisation: all authors; Data curation: S.W.; Formal analysis: S.W.; Funding acquisition: all authors; Investigation: S.W.; Methodology: S.W.; Project administration: all authors; Software: S.W.; Supervision: M.G., K.V.; Visualisation: S.W.; Writing – original draft preparation: S.W.; Writing – review and editing: S.W., M.G.
Competing interest
The authors declare none.


 Open access