

1. Introduction
Over the past years, the natural language processing (NLP) community has increasingly expressed the need for and the importance of human evaluation to complement automatic evaluation (Belz and Reiter Reference Belz and Reiter2006). Tasks, such as machine translation (Graham et al. Reference Graham, Baldwin, Moffat and Zobel2013), explanation generation (Nguyen 2018; Narang et al. Reference Narang, Raffel, Lee, Roberts, Fiedel and Malkan2020; Clinciu, Eshghi, and Hastie Reference Clinciu, Eshghi and Hastie2021), text-to-speech generation (Cardoso, Smith, and Garcia Fuentes Reference Cardoso, Smith and Garcia Fuentes2015; Clark et al. Reference Clark, Silén, Kenter and Leith2019), question answering (Chen et al. 2019; Schuff, Adel, and Vu 2020), and automatic summarization (Owczarzak et al. Reference Owczarzak, Conroy, Dang and Nenkova2012; Paulus, Xiong, and Socher Reference Paulus, Xiong and Socher2018), still rely heavily on automatic measures like BLEU or F1 scores. However, these scores have been shown to correlate only loosely with human perception of such systems (Callison-Burch, Osborne, and Koehn Reference Callison-Burch, Osborne and Koehn2006; Liu et al. Reference Liu, Lowe, Serban, Noseworthy, Charlin and Pineau2016; Mathur, Baldwin, and Cohn Reference Mathur, Baldwin and Cohn2020; Schuff et al. 2020; Iskender, Polzehl, and Möller Reference Iskender, Polzehl and Möller2020; Clinciu et al. Reference Clinciu, Eshghi and Hastie2021) (schematically depicted in Figure 1) and do not necessarily reflect how a system might perform with respect to extrinsic evaluations, such as downstream tasks (Gaudio, Burchardt, and Branco Reference Gaudio, Burchardt and Branco2016).

Figure 1. Relying on automatic evaluation alone (e.g., via accuracy, F1 or BLEU scores) can be misleading as good performance with respect to scores does not imply good performance with respect to human evaluation.
As a concrete example, BLEU scores are commonly used to quantify how similar a generated sentence is compared to a ground-truth reference sentence, for example, in machine translation. BLEU scores rely on the n-gram overlap between the generated text and the reference text. However, this approach has two important shortcomings: (i) relying on “ground-truth” reference texts ignores the breadth of possible correct translations (in the context of machine translation) and (ii) assuming that similarity of meaning can be inferred from n-gram overlap discounts, for example, that certain words in the sentence contribute more to shaping its meaning. For example, consider the German sentence “Der Junge ging gestern mit seinem Hund spazieren” and its English reference translation “The boy walked his dog yesterday.” Now, consider the two candidate translations (a) “the boy walked his pet yesterday” and “the boy ate his dog yesterday.” Both candidates receive identical BLEU-2 scores; however from a human perspective, sentence (a) seems to much better reflect the original German sentence.Footnote a
Similarly, automatic evaluation measures used by other NLP tasks face the same problem (Callison-Burch et al. Reference Callison-Burch, Osborne and Koehn2006; Liu et al. Reference Liu, Lowe, Serban, Noseworthy, Charlin and Pineau2016; Mathur et al. Reference Mathur, Baldwin and Cohn2020; Schuff et al. 2020, Reference Schuff, Yang, Adel and Vu2021; Iskender et al. Reference Iskender, Polzehl and Möller2020; Clinciu et al. Reference Clinciu, Eshghi and Hastie2021). Therefore, human evaluation has begun to gain more and more attention in the NLP community (especially in the context of natural language generation tasks, including machine translation Belz and Reiter Reference Belz and Reiter2006; Novikova, Dusek, and Rieser Reference Novikova, Dusek and Rieser2018; van der Lee et al. Reference van der Lee, Gatt, van Miltenburg, Wubben and Krahmer2019). This trend is shown in Figure 2.
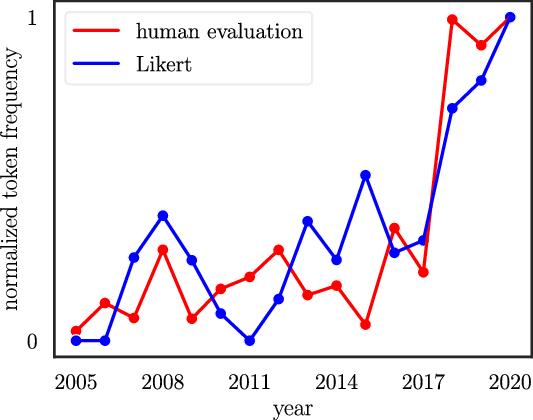
Figure 2. Normalized frequencies of “human evaluation” and “Likert” (as in the Likert scale questionnaire type) in the ACL anthology from 2005 to 2020 showing the growing attention on human evaluation.
But how can NLP researchers new to human evaluation get started? On the one hand, there are numerous text books on human evaluation, experimental design, and experimental evaluation, such as those from Dean et al. (Reference Dean and Voss1999), Field and Hole (Reference Field and Hole2002), Field (Reference Field2013), Montgomery (Reference Montgomery2017). However, they can become overwhelming for a practically oriented researcher due to their breadth of topics. On the other hand, there are task-specific NLP resources. For example, van der Lee et al. (Reference van der Lee, Gatt, van Miltenburg, Wubben and Krahmer2019, Reference van der Lee, Gatt, van Miltenburg and Krahmer2021), Belz, Mille, and Howcroft (Reference Belz, Mille and Howcroft2020) provide guidelines on human evaluation with a focus on natural language generation (NLG), Sedoc et al. (Reference Sedoc, Ippolito, Kirubarajan, Thirani, Ungar and Callison-Burch2019) present an evaluation methodology specifically for chatbots, and Iskender, Polzehl, and Möller (Reference Iskender, Polzehl and Möller2021) provide guidelines for human evaluation for summarization tasks. These contain valuable details for the particular evaluation setting, but lack discussions of broader human aspects, such as ethical considerations and cross-task NLP topics, such as crowdsourcing. Similarly, Dror et al. (Reference Dror, Baumer, Shlomov and Reichart2018) focus on statistical significance testing in NLP for automatic evaluation, but do not touch upon the needs of human evaluation analyses.
Consequently, this paper aims to provide an overview that focuses on commonalities of human evaluation across NLP without restriction to a single task and seeks a good balance between generality and relevance to foster an overall understanding of important aspects in human evaluation, how they are connected, and where to find more information. In particular, we address NLP researchers who are new to human evaluation and walk them through how to consider ethical aspects (Section 2) which may influence their study, formulate hypotheses (Section 3), determine which (in)dependent and confounding variables are relevant to their experiment (Section 4), choose appropriate metrics and questionnaires and know their level of measurement (Section 5), select a suitable experimental design (Section 6), set up a crowdsourced study (Section 7), and calculate appropriate statistics (Section 8).
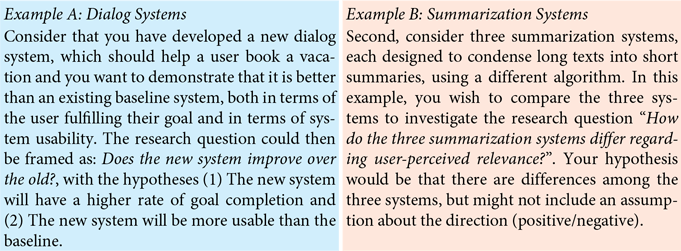
We complement our discussions with concrete examples from various NLP tasks and particularly provide two running examples (i.e., a dialog system and a summarization system), which demonstrate how theoretical aspects discussed in a section may be concretely implemented.
1.1. Overview for quick reference
As not all topics may be relevant to all researchers, we here provide a brief summary of each section so that readers may quickly find the information that they are looking for. Section 2 discusses ethical and legal considerations that precede any (human) experiment, including concepts such as informed consent, participant welfare, data privacy, and what data are considered personal. Section 3 distinguishes different types of research questions and discusses the concepts of null hypotheses and alternative hypotheses. Section 5 discusses common scales, metrics, and levels of measurement, concepts which directly influence what statistical tests will be appropriate for analyzing collected data. Section 6 explains the differences between within-subject and between-subject experimental designs and when each may be appropriate. Section 7 highlights aspects to consider when designing a crowdsourcing experiment. Section 8 introduces the most common statistical tests for analyzing human evaluations and details practical aspects such as power analysis for sample size calculation, test selection, post hoc testing, and more exotic NLP-specific statistical methods. Throughout the entire paper, there are two fictional running examples. Example A, in the blue boxes, describes the evaluation of two dialog systems, and Example B, in the orange boxes, presents a comparison of three summarization systems.
2. Ethical and legal considerations
When designing an experiment involving human participation, it is critical to consider ethical and legal implications. As legal aspects vary with country, it is important for researchers to check with their institution to understand which review processes or legal requirements exist, for example, institutional review boards, ethics committees, or relevant data collection laws. As these review mechanisms may take time, it is important to include them in the timeline of the study.
2.1. Privacy
Before beginning an experiment, it is important to consider what data are actually necessary to collect, how the data will be stored and protected, and for how long the data will be kept. In particular, this is important for any data that could contain personal information about a participant which could later be used to identify them. Ideally, the collection of personally identifying information (including participants’ names, contact information, or IP addresses, but also biometric data such as speech or video) should be kept to the minimum needed to fulfill the purpose of the experiment. Finck and Pallas (Reference Finck and Pallas2020) discuss what can be considered personal data in detail. For example, if using crowdsourcing workers, rather than storing their responses with their website username, new ids should be generated which cannot be traced back to the original participants. For more information on approaches to achieve so-called pseudonymization, we refer to Finck and Pallas (Reference Finck and Pallas2020). In particular, as speech and video data are often of particular interest to NLP researchers, we also refer to Siegert et al. (Reference Siegert, Varod, Carmi and Kamocki2020) for a discussion on anonymization techniques.
Information about data collection should then be clearly and transparently communicated to users before starting an experiment so they understand what personal data are being collected from them, how long it will be stored, and how they can request it to be deleted. For researchers in the European Union, the General Data Protection Regulation (European Commission 2018) makes this type of disclosure legally required in the form of a data agreement. However, ethically, data protection should be a priority in experimental design regardless of the presence or absence of legal obligations (Floridi Reference Floridi2018).
2.2. Informed consent
Additionally, it is important to make sure participants have true informed consent before beginning an experiment, (Nuremberg Code Reference Nuremberg1949, APA Ethical Principles and Code of Conduct 2002, EU Data Protection Regulation 2018, Declaration of Helsinki 2018). This means that participants should know: (1) The purpose of the research, (2) That they have the right to end participation at any time, (3) The potential risks an experiment poses/factors why someone might not want to participate, (4) Prospective benefits of the experiment, (5) Any limits to confidentiality, such as how the data collected will be used or published, (6) Incentives for participation, And (7) who to contact in case of questions. For example, while it is clear that one cannot make video recordings if a user has only consented to providing answers to a survey, it also violates participants’ consent to use their data for a purpose beyond what they have consented to. For example, if a participant agrees to allow speech data to be recorded in an anonymized setting for training a speech recognition system, it would not be ethical to use these recordings as the basis for training the voice of a text-to-speech system. We refer to Nijhawan et al. (Reference Nijhawan, Janodia, Muddukrishna, Bhat, Bairy, Udupa and Musmade2013) for a more detailed discussion of informed consent.
2.3. Respect for participants
In addition to consent and privacy considerations, researchers should also prioritize the dignity of participants. Studies should be conducted in order to provide a benefit to society rather than randomly. However, participant welfare must take a priority over the interests of science and society. Therefore, studies should be conducted so as to avoid all unnecessary physical and mental suffering and injury (Nuremberg Code Reference Nuremberg1949, APA Ethical Principles and Code of Conduct 2002, Declaration of Helsinki 2018). This is especially important when working with vulnerable populations. For example, intentionally inducing negative emotions to study, for example, participants’ interaction with a chatbot under high-stress conditions could be ethically problematic. For further reading we refer to Shaw (Reference Shaw2003) and Leidner and Plachouras (Reference Leidner and Plachouras2017).
3. Research questions and hypotheses
In essence, the purpose of a user study is to answer one or more research questions. These broadly fall into two categories:
exploratory research questions, where the research question’s purpose is to generate assumptions, which can then be tested in a subsequent confirmatory research question, for example, “Which factors (of the set of measured variables) influence the users’ enjoyment of system B?” and
confirmatory research questions, where the research question aims to test a specific assumption, for example, “Does the explanation method of system B increase the users’ trust in the system compared to that of system A?”
This distinction has a direct influence on all later stages of the study. In the case of an exploratory research question, an experiment should be designed to collect initial evidence which can then be used to generate post hoc hypotheses. In contrast, for a confirmatory research question, an experiment should be designed so that one or more hypotheses can be statistically confirmed or rejected. As much NLP research focuses on iteratively improving models, we will focus on confirmatory, comparative research questions in the remainder of this paper.
Once one or more confirmatory research questions have been chosen, they need to be transformed into hypotheses, which propose a relationship between multiple variables. Staying with our example, the hypothesis “The new system B changes users’ enjoyment compared to the old system A” is called the alternative hypothesis, which assumes an effect of the (independent) variable “system type” on the (dependent) variable “user enjoyment,” in contrast to the null hypothesis that postulates that there will be no change. We detail what independent and dependent variables are in the following section. A potential pitfall when selecting hypotheses is to choose a hypothesis that is too general and therefore cannot be clearly accepted or rejected within an experiment, for example, “The ellipsis resolution System A is better than that System B” without specifying what “better” concretely means. System A may be better at resolving verbal ellipses (missing verbs), while System B may be better at resolving nominal ellipses (missing nouns), so it is not possible to say concretely that System A or System B concretely “better” is. We provide two running examples below which will be expanded on in the following sections.
4. Variables
Before discussing experimental designs and evaluation methods, it is important to distinguish, which variables are intentionally being changed, which variables are being measured, and which variables one cannot control. In order to support a repeatable experiment that reliably answers a research question, we first have to choose an operationalization, that is, a clear, measurable definition for each of these variables.
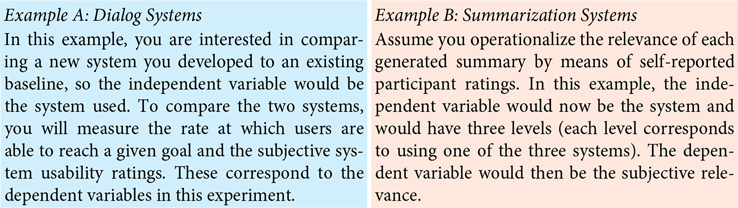
4.1. Independent
The independent variable(s) are those which we control in our study, also called factors. Experimental designs involving a single independent variable are referred to as unifactorial, and experiments involving multiple independent variables are referred to as multifactorial. The values a variable can take are called levels. For example, if the variable is “translation system architecture,” levels might be “old system” and “new system,” where the difference between is operationalized as a clear intervention on the model architecture. Here it is important to be deliberate about the changes between the two systems so it is clear that any changes observed are as a result of the independent variable in question, for example, the implemented model architecture. For example, here it would be important to make sure that both models were trained on the same dataset so the only difference between them is their architecture. Otherwise, one might not be able to attribute an observed difference in the dependent variables to a difference in the factor of interest (architecture), but only be able to conclude this difference as the result of the combined effects (architecture and dataset) without being able to disentangle the effects of each variable.
4.2. Dependent
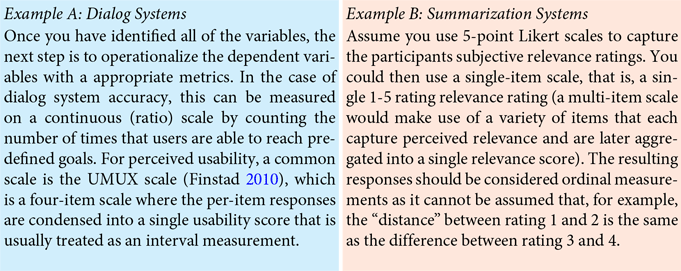
The dependent or response variable(s) are those which are measured and whose changes are a result of the independent variable. For this, it is important to consider not just the general concept (construct) but also what concrete measurement to take. This process is known as operationalization. For example, in order to evaluate the hypothesis that “the new translation system will generate better translations than the old system,” it is necessary to first operationalize the construct ”better” into a dependent variable, which can be concretely measured. In this case, one could decide, for example, that better refers to higher subjective user ratings on “intelligibility” and “fidelity” scales (Carroll Reference Carroll1966; Han, Jones, and Smeaton Reference Han, Jones and Smeaton2021).
4.3. Confounding
A confounding variable or confounder is a variable that affects the dependent variable, but cannot be controlled for, for example, age, gender, or education of the participants. Education, for example, might affect how a user perceives the “intelligibility” of a generated text, but one cannot deliberately change the education level of participants. Potential confounding variables should either be accounted for in the experiment design or in the statistical evaluation of the collected responses. One way of doing this is to include confounding variables as random effects, as discussed in Section 8.2.4. Therefore, it is important consider what variables might be confounding variable and to measure these when conducting an experiment.
5. Metrics
Depending on the choice of dependent variable(s), there are different means to concretely quantify user responses. Here, we focus on Likert scales as a measure of subjective user responses (Section 5.1), but depending on the research question at hand, other quantitative (Section 5.2) or qualitative measurements (Section 5.3) may be equally important. For quantitative measurements, it is crucial to be aware of the measurement level of the collected responses (Section 5.4) as it will directly affect which statistical tests can be applied to the collected data.
5.1. Likert scales
While it is clear how to collect objective measures, for example, the length of a dialog, it is less straightforward how to collect scores of trust, cognitive load, or even creepiness. For such subjective metrics, one usually obtains scores via a validated scale (Hart and Staveland Reference Hart and Staveland1988; Körber Reference Körber2018; Langer and König Reference Langer and König2018), for example, in the form of a questionnaire.
A scale is designed to quantify a construct, for example, “system usability,” that may comprise multiple aspects, called dimensions, e.g., efficiency, effectiveness, and satisfaction (Brooke Reference Brooke1996; Finstad Reference Finstad2010). The most common type of scale is the Likert scale, containing (multiple) items, rated by the user on a discrete range. Figure 3 shows an example for a scale containing five-point Likert items. The overall score for a dimension or construct is calculated by combining the numbers related to the answer from each item (Körber Reference Körber2018). Depending on the exact scale, the procedure used may vary, so it is important to look this up before applying a scale. It is important to stress that the single questions are not scales themselves but rather are items and the group of items together constitutes the scale.

Figure 3. A subset of Likert items from the trust in automation scale by Körber (Reference Körber2018).
Using multiple items instead of a single rating allows one to assess the scale’s internal consistency, for example, via Cronbach’s alpha (DeVellis Reference DeVellis2016). Although we cannot directly assess how well an item is related to the latent variable of interest (e.g., trust) because this is what we want to capture via the items, we still can quantify these relationships indirectly via item-item correlations. If the items have a high correlation with the latent variable, they will have a high correlation among each other (DeVellis Reference DeVellis2016).
Designing a valid and reliable scale requires a precise development process, summarized by Boateng et al. (Reference Boateng, Neilands, Frongillo, Melgar-Quiñonez and Young2018) and explained in detail by DeVellis (Reference DeVellis2016). For NLP, the fields of psychology, human-computer interaction, and robotics already offer a valuable range of scales. Validated questionnaires exist, for example, for evaluating trust (Körber Reference Körber2018), usability (Brooke Reference Brooke1996; Finstad Reference Finstad2010), cognitive load (Hart and Staveland Reference Hart and Staveland1988), social attribution (Carpinella et al. Reference Carpinella, Wyman, Perez and Stroessner2017), or user interface language quality (Bargas-Avila and Brühlmann Reference Bargas-Avila and Brühlmann2016). A potential pitfall in designing and applying (Likert) scales is to use scales that have not been validated. Although such unvalidated scales can yield valid measurements, the researcher does not know for certain that they will and runs the danger of not measuring the construct that was intended to be measured.
5.2. Other useful metrics for NLP
As an alternative to Likert scales, continuous rating scales like the visual analog scale (VAS) can be used to measure a construct. Santhanam and Shaikh (Reference Santhanam and Shaikh2019) showed that continuous rating scales can yield more consistent results than Likert scales for dialog system evaluation. In tasks like generating text or speech, direct comparisons or ranked order comparisons (ranked output from multiple systems best to worst) can be a good option (Vilar et al. Reference Vilar, Leusch, Ney and Banchs2007; Bojar et al. Reference Bojar, Federmann, Haddow, Koehn, Post and Specia2016). Another option for tasks involving text generation is error classification, which involves users annotating text output from a set of predefined error labels (Secară Reference Secară2005; Howcroft et al. Reference Howcroft, Belz, Clinciu, Gkatzia, Hasan, Mahamood, Mille, van Miltenburg, Santhanam and Rieser2020). Other measurements of interest to NLP research include completion time and bio-signals, such as gaze, EEG, ECG, and electrodermal activity. Bio-signals may provide insight into, for example, emotional state (Kim and André Reference Kim and André2008), engagement (Renshaw, Stevens, and Denton Reference Renshaw, Stevens and Denton2009), stress (McDuff et al. Reference McDuff, Hernandez, Gontarek and Picard2016), and user uncertainty (Greis et al. Reference Greis, Karolus, Schuff, Wozniak and Henze2017).
5.3. Qualitative analysis
In addition to quantitative analysis, qualitative analysis can provide valuable insights into users’ perspectives by allowing them more freedom of expression than metrics like a Likert scale. For example, in order to understand a user’s perception of a chatbot, free response questions can be used alongside, for example, Likert scales, allowing the users to express which aspects of the chatbot had the largest impact on them. These responses can then be analyzed with techniques such as content/theme analysis (Hsieh and Shannon Reference Hsieh and Shannon2005; Braun and Clarke Reference Braun and Clarke2006), where user responses are “coded” using a set of labels generated from the collected data, to identify similar themes across responses. These codes can then be quantified and patterns can be analyzed about how often certain codes/themes appeared and under which conditions. For example, one code might be “smart”, then all user responses that indicated that they found the chatbot to be intelligent could be marked with this label. Researchers could then, for example, analyze that 76% of users found the chatbot to be intelligent and that this correlated highly with users who reached their goal.
5.4. Level of measurement
It is important to consider the scale on which a variable is measured in order to choose a correct statistical test (Section 8) and measures of central tendency (i.e., mode, median, and mean). Typically, four types of measurement scales are considered: nominal, ordinal, interval, and ratio.
5.4.1. Nominal
On a nominal (categorical) scale, items are simply named, with no concept of order or distance between them. An example is emotions perceived in a generated voice (“happiness,” “sadness,” “fear,” etc.). If the scale only contains two choices, it is called dichotomous. The only measure of central tendency applicable to such data is the mode.
5.4.2. Ordinal
An ordinal scale adds order to the elements. However, the distance between them cannot be assumed to be equal. An example is measuring intelligibility using the values “very low,” “low,” “medium,” “high,” and “very high.” In addition to the mode, ordinal data also enable the derivation of a median.
5.4.3. Interval
On an interval scale, the elements are ordered with an equal distance between them, allowing one to additionally take the mean. Scores obtained from multi-item Likert scales (as shown in the trust scale in Figure 3) are frequently considered interval data. There has been a long debate between ordinalists who claim that Likert scales should be treated as ordinal data and non-parametric statistics have to be used, and intervalists who argue for an interval interpretation and thus support parametric approaches (Jamieson Reference Jamieson2004; Carifio and Perla Reference Carifio and Perla2008; De Winter and Dodou Reference De Winter and Dodou2010). For a deeper discussion as well as practical recommendations, we refer to Harpe (Reference Harpe2015).
5.4.4. Ratio
A ratio measurement adds the property of a true zero point making ratios of interval measurements sensible. An example is interaction times with an interactive explanation generation system or the number of dialog turns for a chatbot.
6. Experimental designs
Next, one has to choose how participants are assigned to conditions, that is, to levels of the independent variable(s) (as described in Section 4.1). This design determines applicable statistical tests and can mitigate confounding effects. To illustrate the design choices, we will use the example of investigating the perceived naturalness of a text-to-speech system with the independent variable “system,” the levels “old” and “new,” and the confounding variable “native speaker,” that is, that some participants are native speakers while others are not.
6.1. Within-subject
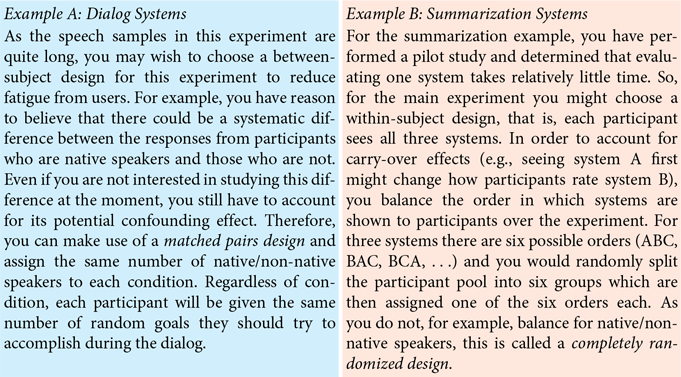
In this study design, also called a repeated-measures design, participants are exposed to all study conditions and can thus make comparisons between them. With a fixed number of participants, this allows to collect more samples than a between-subjects design. However, a within-subject design cannot be scaled to an arbitrary number of conditions both because users are often unwilling to participate in longer studies and because they will be affected by fatigue after too many conditions. Additionally, repeated measures may cause participant responses for later conditions to be affected by their responses to earlier ones due to carry-over effects and learning. One way to account for carry-over effects is to control the order of conditions the participants are exposed to. Typical approaches are randomization (i.e., participants are shown conditions in a random order), blocking (i.e., participants are grouped into blocks regarding a participant characteristic such as age), and Latin square designs. For details, we refer to Dean et al. (Reference Dean and Voss1999). Within-subject designs require a statistical comparison of differences per subject which is accounted for using paired tests.
In our example, we could use a within-subject approach and mitigate carry-over effects by sampling all possible four combinationsFootnote b equally often. We could account for the possibly confounding effect of being a native speaker by balancing the number of native/non-native speakers per condition.
6.2. Between-subject
In this design, each participant is only exposed to one condition. While collecting a fixed number of samples requires a higher number of participants than a within-subject design, a between-subject design can easily be scaled to arbitrarily high number of conditions, assuming the research budget supports this.
Participant responses collected with a between-subject design must be analyzed using unpaired tests as there are no paired responses, but rather two (or more) independently-sampled groups.
In our example, it could be preferable to use a between-subject approach if the interaction of the users with the system takes a long time, and, thus, users could become fatigued when being exposed to both conditions (i.e., old and new system).
7. Crowdsourcing for NLP
Crowdsourcing provides an attractive way to quickly collect responses from a population that has been shown to be more diverse than samples from, for example, college students and internet samples (Buhrmester, Kwang, and Gosling Reference Buhrmester, Kwang and Gosling2011). In NLP, Schnoebelen and Kuperman (Reference Schnoebelen and Kuperman2010) find crowdsourcing to be a reliable source for linguistic data. However, there are differences between designing a crowdsourcing study and a traditional lab experiment, which we outline below.
7.1. Fair compensation
In a traditional study, participants are often volunteers interested in aiding research. On crowdsourcing platforms, participants might not have another full time job and rely on the money they earn by completing tasks (Williamson Reference Williamson2016). Therefore, it is important to ensure the pay structure is non-exploitative and takes into account the average amount of time users will spend on the task and individual workers that spend significantly more time on the task should be rewarded via, for example, bonus payments. If a user is unable to complete a task due to an error in the task itself, their time should still be respected.
7.2. Platform rules
Different platforms, for example, Amazon Mechanical Turk, CrowdFlower, MicroWorkers, Prolific, or Qualtrics, have different rules and capabilities. For example, some require participants to be paid on completion of task, while others allow the results to be reviewed first. Some platforms only support users filling out surveys, while others allow for building more complex interactions/experiment designs or providing links to an external website of the researchers own design. As each platform also has its own rules and norms, it is also important to ensure an experiment is compliant with these (Palmer and Strickland Reference Palmer and Strickland2016).
7.3. Task description
The task description should explicitly contain all necessary steps that a worker needs to fulfill in order to be paid. A good description should also give a realistic estimate of the time a task will take. It should give workers an accurate idea of requirements and expectations so they can make an informed choice about accepting the task.
7.4. Incentives and response quality
Crowdsourcing workers often want to get through an experiment quickly to maximize their pay, so this should be kept in mind to ensure that the experiment aligns with worker incentives. For example, interfaces should be easy-to-use so workers do not get frustrated about wasted time. Bonuses for especially high quality responses can also help motivate workers to provide thoughtful answers.
Attention checking questions, for example, having a question with the correct answer in the instructions, or free response questions may also help to ensure workers are not just clicking through tasks to finish quickly (Meade and Craig Reference Meade and Bartholomew Craig2012). We also recommend that experiments are designed such that workers cannot submit a task unless they have completed all subtasks. For example, if evaluating a speech generation system, the user must actually play samples before they can be evaluated. Finally, interactions should be kept as short as possible as participants may suffer from survey fatigue (i.e., giving less thoughtful answers over time) if a survey/interaction takes too much time (Ben-Nun Reference Ben-Nun2008).
7.5. Pilot study
Pilot studies, that is, small-scale trials before a larger study, allow for testing the experimental design and technical setup. In short: answering the questions “Does the experiment work as anticipated?” and/or “Does the method collect the anticipated data?”
Performing pilot studies allows researchers to discover errors early on, saving resources and time. For more details on designing pilot studies, we refer to Van Teijlingen and Hundley (Reference Van Teijlingen and Hundley2002) and Hassan, Schattner, and Mazza (Reference Hassan, Schattner and Mazza2006). Note that pilot studies conducted in a lab setting may not generalize to the data collected on crowdsourcing websites, due to the difference in populations. Thus, it is a good idea to also conduct a small pilot study on the crowdsourcing platform.
7.6. Data collection
If an experiment involves anything more than a survey, the interaction of the user with the system will often generate interesting data in and of itself. Even if it does not seem immediately relevant to the research goal, logging only costs storage space and can provide insights when analyzing the experimental data, so long as the extra data does not contain personally identifying information. Additionally, if the focus of the experiment shifts, rather than re-running the study, the “extra” data logged may already contain the needed information. For example if we want to measure translation quality, it could also be interesting to log, for example, mouse movements and time taken to rate each translation as these might later provide insights into how comprehensible translations were. It is important to note, however, that users should be informed of any data collected and collecting personally identifying data should be avoided.
7.7. Further reading
We refer to Pavlick et al. (Reference Pavlick, Post, Irvine, Kachaev and Callison-Burch2014) for a discussion of Mechanical Turk’s language demography and to Paolacci (Reference Paolacci2010), Schnoebelen and Kuperman (Reference Schnoebelen and Kuperman2010), and Palmer and Strickland (Reference Palmer and Strickland2016) for further advice on conducting a crowdsourcing study, Jacques and Kristensson (Reference Jacques and Kristensson2019) for information on crowdsourcing economics as well as Iskender et al. (Reference Iskender, Polzehl and Möller2020) for best practices for crowdsourced summarization evaluation.
8. Statistical evaluation for NLP
In their review of INLG and ACL papers that conduct a human evaluation, van der Lee et al. (Reference van der Lee, Gatt, van Miltenburg, Wubben and Krahmer2019) note that only 33% of the papers report statistical analyses. This section aims to offer a guideline to choose an appropriate sample size, select an applicable statistical test, and decide whether a post hoc test and a multiplicity adjustment need to be used. Although this paper’s scope does not allow to discuss each of these topics in detail, we still want to mention different positions and provide selected references to help readers develop their own, informed opinion.
8.1. Estimating the required sample size
Before starting a user study, an important step is to consider what sample size will be necessary to make meaningful claims about the results. If, for example, too few participants are chosen, it will reduce the statistical power of the study, and thereby the probability of recognizing a statistically significant difference between experimental groups if one occurs. In short, statistical power is important to consider because it represents the likelihood of not reporting a false negative. Therefore, designing an experiment with enough power is critical to ensure that time, energy, and money are not wasted conducting a study only to report a false-negative result because there were not enough participants. A power level of 0.80 or higher is generally recommended (Bausell and Li Reference Bausell and Li2002) as it represents that if an experimental design is carried out correctly, 80% of the time, a significant difference will be detected by the chosen statistical test if such a difference exists.
To ensure enough statistical power in an experiment, researchers can conduct a power analysis before starting their experiment to hypothesize what power they can expect given an estimated effect size, a number of participants (N), and a desired significance level. In the sections below, each of these factors is discussed in more detail, and an example is provided to show how one can perform such an analysis.
8.1.1. Effect size
The effect size refers to the size or magnitude of an effect (difference between experimental groups) which would be expected to be observed in a population. In general, there are three different ways to calculate effect size: (1) As a standardized result (e.g., standard deviation units from the mean) which allows for interpretation across applications, (2) Using the original units (e.g., difference of means) which may be useful for domain specific interpretation of results, and (3) As a unit-free result (e.g., a correlation coefficient) (Sullivan and Feinn Reference Sullivan and Feinn2012).
For NLP system comparisons, the independent variable is categorical and one of the most common methods for calculating standardized unit effect sizes is Cohen’s d. Cohen’s d measures the difference between the mean from two Gaussian-distributed variables in standard deviation units. It can be calculated by taking the difference between the means of two groups and dividing this by the pooled standard deviation of both samples.
While estimating effect size before starting the actual experiment can be difficult, previous research in the field or the results from a pilot study can provide a good starting point. However if there is no prior information available on the expected effect size, the values 0.2, 0.5, and 0.8 are commonly used as Cohen’s d values for a small, medium, or large expected effect (Cohen Reference Cohen1988). In a meta-study of 302 social and behavioral meta-analyses, Lipsey and Wilson (Reference Lipsey and Wilson1993) found the average effect size to be exactly 0.5. As an important note, the smaller the effect size is, the more participants will be required to achieve the same statistical power.
8.1.2. Sample size
The general goal of a power analysis is to identify the minimum sample size needed to achieve a desired level of power (normally 0.8). To this end, increasing the sample size will always increase the power of an experiment. In some cases, however, this may not be feasible. In these cases, it is advisable to try to reduce the number of experimental groups (levels of the independent variable) to as few as is scientifically defensible. The fewer groups there are, the higher the number of participants per group. Alternatively, a within-subject design, if applicable, can also greatly increase the statistical power of a study (Cohen Reference Cohen1988).
8.1.3. Significance level
Finally, it is important to consider what statistical test will be run on the data and what significance level, alpha ( $\alpha$
) level, is appropriate for the study. Generally, an alpha level of 0.05 is chosen which represents that 95% of the time if a statistically significant difference is observed, it is not due to random chance. For more information on choosing the right statistical test, see Section 8.2.
$\alpha$
) level, is appropriate for the study. Generally, an alpha level of 0.05 is chosen which represents that 95% of the time if a statistically significant difference is observed, it is not due to random chance. For more information on choosing the right statistical test, see Section 8.2.
8.1.4. Performing a power analysis
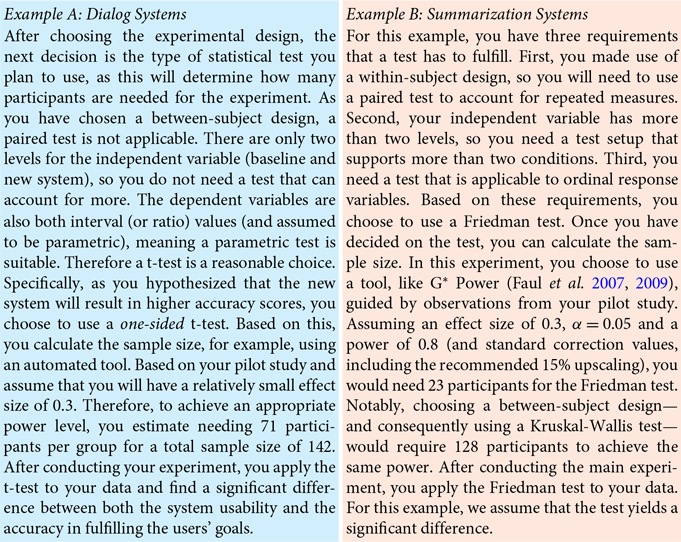
Once all of these pieces of information have been decided, a power analysis can be performed to determine the expected power of the planned study. This is commonly used to determine what the minimal number of participants needed will be to ensure a study with sufficient power. To better illustrate the meaning of statistical power, an example of a hand calculation for power analysis of a t-test is provided below. However, in practice designs may be much more complex, in this case tools like that of Faul et al. (Reference Faul, Erdfelder, Buchner and Lang2009) exist, which, given a set of experimental parameters, can perform the power analysis automatically.
To illustrate statistical power, we adapt the following example from Cohen (Reference Cohen1988): Assuming a between-subjects design aiming to test the hypothesis that system A produces shorter interaction times than system B, an appropriate statistical test would be a one-sided t-test. Statistical power can be estimated by first calculating the critical t value, $t_{\text{crit}}$
, which represents the t value that would be needed for a result to be significant with N participants per group and significance level
$t_{\text{crit}}$
, which represents the t value that would be needed for a result to be significant with N participants per group and significance level $\alpha$
. Assuming there were 64 participants per condition, this results in a
$\alpha$
. Assuming there were 64 participants per condition, this results in a $t_{\text{crit}}$
of 1.98. Next, given the expected effect size,
$t_{\text{crit}}$
of 1.98. Next, given the expected effect size, $t_{\text{hyp}}$
can be calculated. This represents the t value that would be expected if the predicted effect size was observed, and there were N participants per group. Assuming a Cohen’s d effect size of 0.5, this results in a
$t_{\text{hyp}}$
can be calculated. This represents the t value that would be expected if the predicted effect size was observed, and there were N participants per group. Assuming a Cohen’s d effect size of 0.5, this results in a $t_{\text{hyp}}$
of 2.82. Next, assuming that the experiment was hypothetically carried out perfectly an infinite number of times and that the expected effect size was correct, it could be assumed that the collected t values would fall along a normal distribution centered at
$t_{\text{hyp}}$
of 2.82. Next, assuming that the experiment was hypothetically carried out perfectly an infinite number of times and that the expected effect size was correct, it could be assumed that the collected t values would fall along a normal distribution centered at $t_{\text{hyp}}$
as the only sources of error in the experiment would be random. Statistical power can therefore be calculated by looking at what percentage of the t values in this distribution fall above
$t_{\text{hyp}}$
as the only sources of error in the experiment would be random. Statistical power can therefore be calculated by looking at what percentage of the t values in this distribution fall above $t_{\text{crit}}$
, otherwise stated as what percentage of t values would lead to a significant result. In this example, 80% of the values in a normal distribution centered at 2.82 will be above 1.98, so a power of 0.8 would be hypothesized. To choose the correct sample size, different values of N can be tested until the desired power is achieved.
$t_{\text{crit}}$
, otherwise stated as what percentage of t values would lead to a significant result. In this example, 80% of the values in a normal distribution centered at 2.82 will be above 1.98, so a power of 0.8 would be hypothesized. To choose the correct sample size, different values of N can be tested until the desired power is achieved.
8.1.5. Further reading
For more information, including tables with the relationship between power, N, and hypothesized effect size as well details on calculating power with more complex study designs, Dean et al. (Reference Dean and Voss1999), Bausell and Li (Reference Bausell and Li2002), Sullivan and Feinn (Reference Sullivan and Feinn2012), and Montgomery (Reference Montgomery2017) provide a solid introduction to the topic and VanVoorhis et al. (Reference Wilson VanVoorhis and Morgan2007) discuss common rules of thumbs of sample size. Additionally, Faul et al. (Reference Faul, Erdfelder, Buchner and Lang2009) provide an open-source tool for performing power analysis including support for most common statistical tests.Footnote c
8.2. Choosing the correct statistical test
The (set of) applicable statistical test(s) is determined by the experimental setup including the choice of measurement scale (Section 5.4) and the experimental design (Section 6). To choose a test, one has to determine the number of levels (groups), if the samples were collected in a paired or unpaired design, the measurement scale of the dependent variable, and whether parametric assumptions apply. In the following, we discuss these aspects and present common tests. Figure 4 summarizes these tests within a flow chart, illustrating the conditions under which each test is applicable.

Figure 4. A flow chart to help find an appropriate test to analyze collected responses. Starting from the middle, the chart shows tests suited to analyze experiments with two levels of independent variables (e.g., system A and system B) on the left and tests suited to analyze experiments with more than two levels of independent variables (e.g., systems A, B, and C) on the right. A paired test needs to be used if; for example, a within-subject design is used and the level of measurement determines whether a parametric test can be used. For example, yes/no ratings are nominal/dichotomous by definition and cannot be analyzed using a t-test. $^*$
The pairwise differences have to be on an ordinal scale, see Colquhoun (Reference Colquhoun1971) for more details.
$^*$
The pairwise differences have to be on an ordinal scale, see Colquhoun (Reference Colquhoun1971) for more details.
8.2.1. Paired and unpaired tests
Whether a paired or an unpaired test is the correct choice directly depends on the choice of experimental design (see Section 6) as different designs require accounting for the subject-dependent variances in the responses differently. A paired test is applicable if the samples were collected in a within-subject design (repeated measures), that is, from one group. An unpaired test is applicable if the samples were collected in a between-subjects design, that is, from different groups.
8.2.2. Parametric and non-parametric tests
Parametric tests make assumptions on the underlying population distribution (such as normality), and non-parametric tests do not make assumptions on the distributions, but still can make other assumptions (Colquhoun Reference Colquhoun1971). Therefore, the measurement scale of the dependent variable can directly determine whether a parametric test is applicable. For example, we cannot run a t-test (which is parametric) on ordinal responses from {“often,” “sometimes,” “never”}. It is often claimed that parametric tests offer higher statistical power. This statement has to be restricted to very specific conditions and Colquhoun (Reference Colquhoun1971) argues to prefer non-parametric tests as long as there is no experimental evidence of the error distribution. We refer to Colquhoun (Reference Colquhoun1971) for a discussion of the differences between parametric and non-parametric methods and to Sprent (Reference Sprent2012) and Corder and Foreman (Reference Corder and Foreman2014) for details on non-parametric statistics.
8.2.3. Frequently-used tests for NLP
In the following, we present a selection of common statistical tests, highlight important assumptions they make, and provide examples of NLP applications they are relevant to. We do not exhaustively discuss all assumptions of each test here, but instead offer first guidance in choosing the right test. We first discuss tests that are applicable to experiment designs with one factor that has two levels (e.g., the factor chatbot system with the levels “system A” and “system B”).
Thereafter, we consider tests involving one factor with more than two levels (e.g., the factor chatbot system with an additional third “system C”). These tests are called omnibus tests, which means that they only can detect that “there is a difference” but make no statement about pairwise differences. Therefore, pairwise post hoc tests are usually used after detecting a significant difference with an omnibus test.
Unpaired and Paired Two-Sample t-test: In the context of user studies, the t-test is usually used to test if the means of two samples differ significantly, that is, a two-sample t-test.Footnote d In NLG evaluation, the time a participants takes to read a sentence generated by one versus another system could be compared using a t-test. For the two-sample test, one further distinguishes an unpaired or independent test and a paired or dependent test. The t-test assumes that the errors follow a normal distribution which is usually decided subjectively by inspecting the quantile-quantile (Q-Q) plot of the data (Hull Reference Hull1993). When analyzing Likert scale responses, the choice of test depends on whether one regards the scale scores to be measures to be ordinal or interval measures (Section 5.4). For more detailed recommendations when and when not to apply parametric statistics to Likert responses, we refer to Harpe (Reference Harpe2015). However, De Winter and Dodou (Reference De Winter and Dodou2010) compare error rates between the non-parametric Mann-Whitney U test with the parametric t-test for five-point Likert items and find that both tests yield similar power.
A typical situation to apply a t-test is to compare task completion times, for example, the time it takes a participant to read a text or the time a user takes to engage with a chatbot.
Mann-Whitney U test and Wilcoxon Signed-Rank: Although the t-test can be robust to violations of normality (Hull Reference Hull1993), non-parametric alternatives, such as the Mann-Whitney U test for unpaired samples and the Wilcoxon signed-rank test for paired samples, are preferable for non-parametric data. The Mann-Whitney U test is the non-parametric counterpart to the unpaired t-test. In contrast to the t-test, which is restricted to interval data, it is additionally applicable to ordinal data as well as interval data that does not fulfill the parametric assumptions. For example, testing user acceptance of a voice assistant could involve asking participants how often they would use the system: “daily,” “weekly,” “monthly,” or “never.” The paired counterpart to the Mann-Whitney U test is the Wilcoxon signed-rank test which compares median differences between the two groups and can be applied as long as the pairwise differences between samples can be ranked. If this is not possible, a sign test should be used instead (Colquhoun Reference Colquhoun1971). An application for the Mann-Whitney U test and the Wilcoxon signed-rank test are Likert ratings of, for example, text fluency or coherence.
Fisher’s Exact, $\chi^2,$
and McNemar Test: If the measurement scale is nominal, the Mann-Whitney U test and the Wilcoxon signed-rank test are not applicable. Instead, Fisher’s exact test test should be used for unpaired groups if the dependent variable is dichotomous, that is, can only take two values like “yes” and “no,” for example for rating the correctness of answers generated by a question answering system. If it can take more values, for example additionally “I do not know,” a chi-square (
$\chi^2$
) test can be used. When samples are paired, the test of choice should be a McNemar test. An exemplary NLP application of these two tests are binary responses, to, for example, “is this sentence grammatically correct?” (Fisher’s exact or chi-square test for unpaired samples and McNemar test for paired samples) or categorial responses to, for example,“for which tasks would you use this travel chatbot most likely (a) searching for travel information, (b) booking a travel, or (c) making a modification to a booked travel?” (chi-square test for unpaired samples and McNemar test for paired samples).
$\chi^2,$
and McNemar Test: If the measurement scale is nominal, the Mann-Whitney U test and the Wilcoxon signed-rank test are not applicable. Instead, Fisher’s exact test test should be used for unpaired groups if the dependent variable is dichotomous, that is, can only take two values like “yes” and “no,” for example for rating the correctness of answers generated by a question answering system. If it can take more values, for example additionally “I do not know,” a chi-square (
$\chi^2$
) test can be used. When samples are paired, the test of choice should be a McNemar test. An exemplary NLP application of these two tests are binary responses, to, for example, “is this sentence grammatically correct?” (Fisher’s exact or chi-square test for unpaired samples and McNemar test for paired samples) or categorial responses to, for example,“for which tasks would you use this travel chatbot most likely (a) searching for travel information, (b) booking a travel, or (c) making a modification to a booked travel?” (chi-square test for unpaired samples and McNemar test for paired samples).One-Way and Repeated-Measures ANOVA: So far, we only addressed tests that compare two groups, such as samples from “dialog system A” to samples from “dialog system B.” When we add a third or more conditions, the discussed tests are no longer applicable. Instead, if the samples are parametric, a one-way ANOVA can be applied to unpaired samples and a repeated-measures ANOVA can be applied to paired samples.
For example, when interaction times with three different explainability methods should be compared, one can use a one-way ANOVA when using an between-subjects design (i.e., each participant sees only one method) and a repeated-measures ANOVA if each participant sees each method (in a randomized order), that is a within-subject design.
Kruskal-Wallis and Friedmann Test: Like the Mann-Whitney U test and the Wilcoxon signed rank test are the non-parametric counterparts to the paired and unpaired t-test, one can use the non-parametric Kruskal-Wallis test instead of a one-way ANOVA and the non-parametric Friedmann test instead of a repeated-measures ANOVA. For further details, we refer to Ostertagova, Ostertag, and Kováč (Reference Ostertagova, Ostertag and Kováč2014) and Pereira, Afonso, and Medeiros (Reference Pereira, Afonso and Medeiros2015). In the above explainability methods example, these tests are appropriate choices if instead of measuring interaction times (interval scale), one, for example, asks participants to rate trust on a single-item Likert scale (ordinal scale).


8.2.4. More complex models and tests
In addition to the tests above, there also are more general models and tests, which may be useful for some NLP applications. If the response variable is, for example, categorial (such as responses like “dog” or “cat”), linear models can be extended to generalized linear models (Nelder and Wedderburn Reference Nelder and Wedderburn1972), where the (e.g., categorial) response scale is linked to a latent scale (e.g., logits) via a link function. If the experimental setup requires accounting for, for example, subject-specific influences (e.g., mother tongue or literacy) or repeated measures of one factor within a mixed design (e.g., a design in which each participant uses one version of a dialog system, i.e., a between-subjects factor, but all participants perform the same set of tasks, i.e., a within-subject factor), generalized linear mixed models can be an appropriate statistical model. The difference between a linear and a linear mixed model is that the latter is extended to include random effects such as individual participant characteristics on top of fixed effects such as “system type” resulting in a mixed model. Intuitively, the purpose of including random effects is to get a clearer picture of the fixed effects and not to falsely attribute, for example, an effect of participant age to be a difference between two chatbots. An introduction to linear mixed models and their usage in R is provided by Winter (Reference Winter2013). More details can be found in McCulloch and Neuhaus (Reference McCulloch and Neuhaus2005) and Jiang (Reference Jiang and Nguyen2007). Howcroft and Rieser (Reference Howcroft and Rieser2021) discuss ways to improve power in human evaluations in NLP and recommend to make use of ordinal mixed effects models. Other commonly used models are Generalized Additive Models (GAMs) (Hastie and Tibshirani Reference Hastie and Tibshirani1990; Hastie, Tibshirani, and Friedman Reference Hastie, Tibshirani and Friedman2009) who model the response variable as a sum of general basis functions. We refer to Wood (Reference Wood2017) for an introduction using R. Two concrete applications of (ordinal) GAMs are discussed by Divjak and Baayen (Reference Divjak and Baayen2017) who analyze grammaticality ratings and Schuff et al. (Reference Schuff, Jacovi, Adel, Goldberg and Vu2022) who study human perception of explanations.
8.3. Post Hoc tests
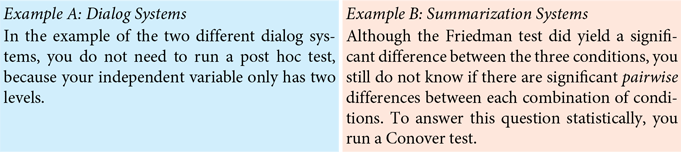
The presented omnibus tests do not allow to make statements about pairwise differences between conditions. For example, an ANOVA might detect a significant difference within the groups {“system A,” “system B,” “system C”} but makes no statement if there is for example a significant difference between “system A” and “system B.” In such cases, one needs to use a post hoc test. The respective post hoc test is typically only applied if the omnibus test found a significant effect and—depending on the method—requires a multiple testing adjustment. Commonly used tests are Tukey HSD, Scheffé, Games-Howell, Nemenyi, and Conover.
8.4. The multiple comparisons problem
The intuition behind the multiple comparisons problem is that every time a statistical test is run, it bears the risk of a Type I error, that is, falsely reporting a positive result. When one considers the standard significance level, $\alpha$
of 0.05, this represents 95% confidence in a reported significant difference or a 5% chance that there was a Type I error. However if multiple hypotheses are tested, the chance for a type I error over the entire experiment increases. For example, if two hypotheses are tested each with a 95% confidence level, the confidence for the entire experiment drops to 0.9 (the likelihood that test 1 and 2 were both not falsely positive): (0.95 * 0.95) or an
$\alpha$
of 0.05, this represents 95% confidence in a reported significant difference or a 5% chance that there was a Type I error. However if multiple hypotheses are tested, the chance for a type I error over the entire experiment increases. For example, if two hypotheses are tested each with a 95% confidence level, the confidence for the entire experiment drops to 0.9 (the likelihood that test 1 and 2 were both not falsely positive): (0.95 * 0.95) or an $\alpha$
= 0.1.
$\alpha$
= 0.1.
Thus, when a researcher wishes to test multiple hypotheses at once, the individual $\alpha$
levels need to be adjusted. A simple and well-known adjustment method is the Bonferroni correction, that divides the
$\alpha$
levels need to be adjusted. A simple and well-known adjustment method is the Bonferroni correction, that divides the $\alpha$
level per test by the number of tests to ensure a given familywise error rate—error rate across the entire experiment—is achieved. Considering the example above of two hypotheses, each with an original
$\alpha$
level per test by the number of tests to ensure a given familywise error rate—error rate across the entire experiment—is achieved. Considering the example above of two hypotheses, each with an original $\alpha$
level of
$\alpha$
level of $\alpha$
= 0.05, the
$\alpha$
= 0.05, the $\alpha$
level of the experiment before correction is
$\alpha$
level of the experiment before correction is $\alpha$
= 0.10. After correction, the
$\alpha$
= 0.10. After correction, the $\alpha$
level of each experiment would be 0.025, but the familywise
$\alpha$
level of each experiment would be 0.025, but the familywise $\alpha$
level (test 1 and test 2 do not have a type I error) would be
$\alpha$
level (test 1 and test 2 do not have a type I error) would be $0.05 \,(1 - 0.975\,^{*}\,0.975)$
. The Bonferroni correction can be applied to any statistical test; however, it is a very conservative measure and in the case of many hypotheses being tested can decrease the power of the experiment, making it challenging to find statistical differences if they do exist.
$0.05 \,(1 - 0.975\,^{*}\,0.975)$
. The Bonferroni correction can be applied to any statistical test; however, it is a very conservative measure and in the case of many hypotheses being tested can decrease the power of the experiment, making it challenging to find statistical differences if they do exist.
A marginally less conservative test is the Šidák correction. This test is performed similarly to the Bonferroni correction; however instead of dividing by the number of comparisons, the comparison-level $\alpha$
level is calculated as
$\alpha$
level is calculated as $\alpha_{SID} = (1 - (1-\alpha)^{1/m})$
, where m is the number of tests to be conducted. In the case of the previous example, the per test
$\alpha_{SID} = (1 - (1-\alpha)^{1/m})$
, where m is the number of tests to be conducted. In the case of the previous example, the per test $\alpha$
level for two comparisons would be
$\alpha$
level for two comparisons would be $1 - (1-0.05)^{1/2}$
or 0.0253. The Šidák correction makes the assumption that each comparison is independent of each other, if this is not the case, the Bonferroni correction is more appropriate as it does not make this assumption.
$1 - (1-0.05)^{1/2}$
or 0.0253. The Šidák correction makes the assumption that each comparison is independent of each other, if this is not the case, the Bonferroni correction is more appropriate as it does not make this assumption.
Less conservative methods, such as the Benjamini-Hochberg technique or the Holm procedure, also called the Holm-Bonferroni method can provide more power for an experiment (Bender and Lange Reference Bender and Lange2001; Streiner and Norman Reference Streiner and Norman2011). The Benjamini-Hochberg technique can be performed by ranking all comparisons by their p-value, where 1 represents the comparison with the smallest p-value and m represents the comparison with the largest. For each comparison, a Benjamini-Hochberg critical value is then computed using the formula: $(i/m)\,^{*}Q$
, where i represents the comparison’s rank, m the total number of comparisons, and Q the desired
$(i/m)\,^{*}Q$
, where i represents the comparison’s rank, m the total number of comparisons, and Q the desired $\alpha$
value for the entire experiment. All comparisons with a p-value below the Benjamini-Hochberg critical value are then considered significant after correction. The Holm-Bonferroni method similarly ranks all comparisons by ascending p-values. For each p-value
$\alpha$
value for the entire experiment. All comparisons with a p-value below the Benjamini-Hochberg critical value are then considered significant after correction. The Holm-Bonferroni method similarly ranks all comparisons by ascending p-values. For each p-value $p_{i}$
in the experiment, the null hypothesis is rejected if
$p_{i}$
in the experiment, the null hypothesis is rejected if $p_{i} < \frac{\alpha}{m + (1-i)}$
, where i is the comparison’s rank, m is the total number of comparisons, and
$p_{i} < \frac{\alpha}{m + (1-i)}$
, where i is the comparison’s rank, m is the total number of comparisons, and $\alpha$
is the familywise alpha level for the experiment. Alternatively, if the data in an experiment were suitable for an ANOVA test, the Tukey HSD, also called the Tukey test, can be a good choice. When and when not to apply
$\alpha$
is the familywise alpha level for the experiment. Alternatively, if the data in an experiment were suitable for an ANOVA test, the Tukey HSD, also called the Tukey test, can be a good choice. When and when not to apply $\alpha$
adjustments is discussed by Rothman (Reference Rothman1990), Ottenbacher (Reference Ottenbacher1998), Moyé (Reference Moyé1998), Bender and Lange (Reference Bender and Lange2001), Streiner and Norman (Reference Streiner and Norman2011).
$\alpha$
adjustments is discussed by Rothman (Reference Rothman1990), Ottenbacher (Reference Ottenbacher1998), Moyé (Reference Moyé1998), Bender and Lange (Reference Bender and Lange2001), Streiner and Norman (Reference Streiner and Norman2011).
8.5. Further analysis methods for NLP
As NLP systems are frequently evaluated in side-by-side comparisons, the collected variables can also be ranks or preferences (Callison-Burch et al. Reference Callison-Burch, Fordyce, Koehn, Monz and Schroeder2007; Grundkiewicz, Junczys-Dowmunt, and Gillian 2015). For example, participants can be asked to rank pairs of translations or generated speech snippets. TrueSkill $^{\rm TM}$
(Herbrich, Minka, and Graepel Reference Herbrich, Minka and Graepel2006; Sakaguchi, Post, and Van Durme Reference Sakaguchi, Post and Van Durme2014) can be used to construct ranks from pairwise preferences. Pairwise preferences can be analyzed statistically using models, such as (log-linear) Bradly-Terry models (Bradley and Terry Reference Bradley and Terry1952; Dras Reference Dras2015) or approaches based on item response theory (Sedoc et al. Reference Sedoc, Ippolito, Kirubarajan, Thirani, Ungar and Callison-Burch2019; Sedoc and Ungar Reference Sedoc and Ungar2020). Further, hybrid approaches that combine ranking with scale ratings (Novikova et al. Reference Novikova, Dusek and Rieser2018) or human judgments with automatic evaluation (Hashimoto, Zhang, and Liang Reference Hashimoto, Zhang and Liang2019) have been proposed for NLG.
$^{\rm TM}$
(Herbrich, Minka, and Graepel Reference Herbrich, Minka and Graepel2006; Sakaguchi, Post, and Van Durme Reference Sakaguchi, Post and Van Durme2014) can be used to construct ranks from pairwise preferences. Pairwise preferences can be analyzed statistically using models, such as (log-linear) Bradly-Terry models (Bradley and Terry Reference Bradley and Terry1952; Dras Reference Dras2015) or approaches based on item response theory (Sedoc et al. Reference Sedoc, Ippolito, Kirubarajan, Thirani, Ungar and Callison-Burch2019; Sedoc and Ungar Reference Sedoc and Ungar2020). Further, hybrid approaches that combine ranking with scale ratings (Novikova et al. Reference Novikova, Dusek and Rieser2018) or human judgments with automatic evaluation (Hashimoto, Zhang, and Liang Reference Hashimoto, Zhang and Liang2019) have been proposed for NLG.
8.6. Worked example
To showcase a complete statistical analysis (including data and code), we consider a scenario in which we want to compare three chatbot systems with respect to the levels of trust they evoke in users.Footnote e More formally, we investigate the effect of three levels of the independent variable “personalization” on the variable user trust. We suppose that we operationalize user trust using the trust scale by Körber (Reference Körber2018) and consider the scale scores to lie on an interval scale. We assume that we conducted a pilot study and collected the full study data using a within-subject design balancing for native speakers. The next step is to determine an appropriate statistical test. For this example, we suppose that a Q-Q plot indicated that the collected responses are not parametric. Since we chose a within-subject design, the ratings are paired. Therefore, we need to use a paired non-parametric test and choose the Friedmann test. Supposing the Friedmann test detects a significant difference, we subsequently run a Nemenyi test to determine which pairs of groups significantly differ. In our example, we might find that trust ratings of two levels of personalization are significantly higher than the third level, but that between these two levels, there is no significant difference.
9. Conclusion
In this paper, we provided an overview of the most important aspects for human evaluation in natural language processing. We guided the reader along the way from research questions to statistical analysis, reviewed general experimental design approaches, discussed general ethical and legal considerations, and gave NLP-specific advice on metrics, crowdsourcing, and evaluation techniques. We complemented our discussions with two running example scenarios from NLP and a code example for a statistical analysis with R. In doing so, we offered a quick start guide for NLP researchers new to the field of human evaluation and provided pointers to in-depth resources.
Conflicts of interest
The authors declare none.


 Open access