


Introduction
Environmental issues have increasingly become one of the most contentious topics in Turkish politics over the last decade. These issues have gained saliency, especially after the Gezi Park demonstrations, which began in 2013 to defend the last green area in Taksim, the main square in İstanbul.Footnote 1 Despite this increased attention, no systemic empirical evidence exists to inform us about the correlates of deforestation. In the absence of empirical evidence, while environmental resistance movements blame the Justice and Development Party (AKP) government, which has been in power since 2002, for destroying forests for infrastructural and energy projects and mining activities, the government and its leader President Recep Tayyip Erdoğan deny the allegations. Erdoğan even claims that his government planted “4.5 billion trees” under his leadership.Footnote 2 These conflicting claims are made when high-resolution satellite data on forests are available, making it possible to analyze deforestation.
Although the desire to grow economically at the expense of the environment has been the central theme in every political movement in Turkey (Arsel Reference Arsel, Adaman and Arsel2016), Turkey’s current “competitive authoritarian” regime (Esen and Gumuscu Reference Esen and Gumuscu2016; Levitsky and Way Reference Levitsky and Way2010) poses two distinct threats to the environment. While the competitive nature of elections, despite its unfairness, can make politicians more willing to sacrifice trees for votes (Cisneros et al. Reference Cisneros, Kis-Katos and Nuryartono2021; Pailler Reference Pailler2018), the absence of effective horizontal checks on the executive branch, such as an independent judiciary, creates amenable conditions for political rent creation (Acemoglu et al. Reference Acemoglu, Robinson and Torvik2013; Persson et al. Reference Persson, Roland and Tabellini1997) in which forests are abused through corrupt practices.
Although we know that forests have been destroyed throughout the last few decades in Turkey,Footnote 3 no study has so far empirically investigated the impacts of both central and local governments’ extractivist policies in various sectors, such as mining, energy, and tourism. In the absence of any systemic empirical analyses, we do not know how much each factor correlates with deforestation in the country. This article studies the correlates of deforestation using high-resolution Landsat data. Deforestation in this context is defined as “as a stand-replacement disturbance or the complete removal of tree cover canopy at the Landsat pixel scale” (Hansen et al. Reference Hansen, Potapov, Moore, Hancher, Turubanova, Tyukavina, Thau, Stehman, Goetz, Loveland, Kommareddy, Egorov, Chini, Justice and Townshend2013, p. 850).
The article conducts a systemic empirical analysis by bringing together possible major drivers of deforestation and using high-resolution satellite data to measure tree loss. The satellite data has various advantages over administrative data on forest coverage. First, the General Directorate of Forestry (Orman Genel Müdürlüğü) does not release annual data on forests (Türkiye Ormancılar Derneği 2019, p. 14). The directorate works on a forested area of around two million hectares each year, taking ten years to cover the whole country. The latest data on forested areas in certain regions is twenty years old (Türkiye Ormancılar Derneği 2019). Therefore, it is not possible to use official data on forests to understand the drivers of deforestation because the data comes with severe time lag.Footnote 4 Moreover, the released data are at the province level and do not allow fine-granular analysis at smaller geographical units. Third, data transparency and quality pose serious issues, especially in democratically backsliding countries like Turkey, because information manipulation is one of the primary ways to maintain legitimacy (Guriev and Treisman Reference Guriev and Treisman2019).
However, high-resolution satellite data allows us to track changes in forested areas at fine-granular levels (thirty-meter resolution) annually. More importantly, data quality is not impacted by political considerations. Finally, defining deforestation with respect to the Landsat pixel scale means that the measurement does not suffer from different definitions of forest,Footnote 5 making the data comparable across time and space.
By combining this satellite data with various data sources on possible drivers, I show that three factors consistently correlate with deforestation in Turkey: local AKP rule, new hydropower plants, and mining activities. Having a district (ilçe) whose municipalities are all governed by AKP mayor(s)Footnote 6 correlates with higher tree loss by around forty-two football fields in a given district for each election period. Similarly, a district has higher tree loss by about 253 football fields if the share of mining enterprises increases from none to 7 percent.Footnote 7 Building new hydropower plants is also correlated with higher tree loss: Going from one new hydropower plant to seven new plants, which is the maximum observed in the sample, is positively associated with tree loss by around 120 football fields in that district.
This article makes several contributions. It provides the first empirical evidence on the correlates of deforestation in Turkey by paying specific attention to politics. Therefore, it contributes to the empirical political science and economics literature on deforestation (Burgess et al. Reference Burgess, Hansen, Olken, Potapov and Sieber2012; Cisneros et al. Reference Cisneros, Kis-Katos and Nuryartono2021; Pailler Reference Pailler2018; Sanford Reference Sanford2021). It is also linked with scholarly works that analyze the impact of local governments on deforestation (Cisneros et al. Reference Cisneros, Kis-Katos and Nuryartono2021; Lemos and Agrawal Reference Lemos and Agrawal2006; Ribot et al. Reference Ribot, Agrawal and Larson2006). Second, it gives credence to the argument that local governments in Turkey are important actors despite their limited role in the design of environmental policies (Orhan Reference Orhan, Bulut, Eren, Karakaya and Aydın2013). Last, quantifying impacts allows us to compare the adverse impacts of various industries.
This article’s structure is as follows: The following section focuses on the correlates of deforestation within the context of Turkey. The next section introduces the empirical strategy and explains the data sources and how variables are constructed. The results are presented in the fourth section. The discussion is upended with a conclusion.
Correlates of deforestation
Since the foundation of the Turkish republic, the idea of development through rapid economic growth has not been challenged by any political movement (Arsel Reference Arsel, Adaman and Arsel2016). Despite differences in other dimensions (economic ideology and progressive or conservative values), political parties in Turkey, irrespective of their ideology, have always supported developmental projects (Paker et al. Reference Paker, Adaman, Kadirbeyoğlu and Özkaynak2013; Turhan et al. Reference Turhan, Mazlum, Şahin, Şorman and Gündoğan2016). However, the desire to grow economically at the expense of the environment has increased dramatically with the AKP governments (Akbulut and Adaman Reference Akbulut and Adaman2013), both through the actions/policies of the central and local AKP governments. This became possible with the AKP’s increasing authoritarianism as authoritarian power makes it easier for central and local AKP governments to ignore environmental protection for economic growth and rent creation.
However, how rising authoritarianism can impact the environment is not theoretically clear. Although politics is recognized as an essential contributor to environmental issues in general and deforestation in particular, disagreement exists in how the two interact. It is known that democracies provide more welfare to their citizens than nondemocracies (Przeworski et al. Reference Przeworski, Alvarez, Cheibub and Limongi2000) because democracy forces the leaders to heed the needs of the masses (Mill Reference Mill2004 [1861]) and makes political leaders more responsive to the popular demands for environmental protection (Barrett and Graddy Reference Barrett and Graddy2000; Farzin and Bond Reference Farzin and Bond2006). Therefore, it is theoretically plausible that deforestation should be more severe in authoritarian countries.
This logic indeed drives local and global environmental organizations to focus on decentralization and community-based forest management as an institutional reform to prevent tree loss (Klopp Reference Klopp2012, p. 352). By “democratizing” the environmental governance, decentralization aims to include locals, who are most likely to be affected by the destruction of forests, in decision-making processes.
However, others point out that the relationship between democracy and the environment is not that clear cut (Buitenzorgy and Mol Reference Buitenzorgy and Mol2011) and that democratization and local governance do not guarantee the prevention of tree loss. On the contrary, patronage politics causes further tree loss, especially in settings with competitive elections. Forests can be used as resources for political purposes to satisfy the private interests in exchange for votes (Klopp Reference Klopp2012). Reelection incentives make politicians more willing to sacrifice trees for votes (Cisneros et al. Reference Cisneros, Kis-Katos and Nuryartono2021; Pailler Reference Pailler2018), creating “political logging cycles” (Burgess et al. Reference Burgess, Hansen, Olken, Potapov and Sieber2012). The recent evidence has shown that democratization can bring further deforestation, especially in weak democracies with highly competitive elections (Sanford Reference Sanford2021).
Turkey’s regime is best characterized as “competitive authoritarian” (Çalışkan Reference Çalışkan2018; Esen and Gumuscu Reference Esen and Gumuscu2016; Levitsky and Way Reference Levitsky and Way2010). In these regimes, elections are still competitive despite being unfair.Footnote 8 I argue that the competitive authoritarian nature of the regime provides a setting that gets the environmentally damaging characteristics of both democratic and authoritarian regimes. Reelection pressures do not fade away in competitive authoritarian regimes, unlike fully authoritarian regimes. The electoral pressures coming from competitive elections make the government ignore the environment because protecting it does not pay off electorally in the short run.
At the same time, horizontal institutions of accountability such as the independent judiciary or civil society cannot effectively check the government for environmental regulations, unlike fully consolidated democracies. Moreover, the public cannot effectively check the government’s rent-seeking behaviors with the politically captured media (Adiguzel Reference Adiguzel2022). This absence of checks and balances, as a result, brings about greater flexibility for both central and local AKP governments to cater to private interests at the expense of the environment.
As a result, the central government pursues a similar developmentalist logic compared to previous governments, albeit with a much-increased pace and without any input from the public (Özkaynak et al. Reference Özkaynak, Turhan, Aydın and Tezcür2020), due to the nature of the competitive authoritarian regime. In such an institutional setting, local AKP governments, in addition to the central government, gets more leeway to transfer forested lands to politically connected business people for rent creation. Indeed, the evidence shows that private interests were more easily catered to over the last decade in Turkey (Gürakar-Çeviker Reference Gürakar-Çeviker2016; Gürakar-Çeviker and Meyersson Reference Gürakar-Çeviker and Meyersson2016). As a result, “unprecedented extractivist drive” (Adaman et al. Reference Adaman, Arsel and Akbulut2019, p. 514) in various sectors such as mining, energy, and construction became possible, which brought significant environmental problems, including deforestation (Adaman and Akbulut Reference Adaman and Akbulut2021).
The energy sector is one of the primary sectors where we see the impacts of AKP’s unprecedented modernist ambitions (Özkaynak et al. Reference Özkaynak, Turhan, Aydın and Tezcür2020). The AKP government started a series of legal changes that opened the electricity market to the private sector after they came to power (Eren Reference Eren2018). The desire to reduce dependence on fossil fuels made hydroelectric power plants one of the favorite methods to produce electricity. As a result, the government has been aiming to construct dams in all major rivers by 2023, causing an immediate increase in the number of newly built small-scale hydroelectric power plants in the country (ibid.). Indeed, in a speech in 2020, President Erdoğan claimed that his government built 585 new hydroelectric power plants.Footnote 9 The decision to dramatically expand the number of power plants was not taken with active public participation, and their impacts on the local ecosystems and communities have largely been ignored (Özkaynak et al. Reference Özkaynak, Turhan, Aydın and Tezcür2020). Yet, the energy production capacity increased threefold (Erensü Reference Erensü2018). Although these small-scale hydroelectric plants are believed to have minimal impact on the environment, their extensive utilization means that their environmental impacts are no different than large-scale dams (Abbasi and Abbasi Reference Abbasi and Abbasi2011; Pang et al. Reference Pang, Zhang, Ulgiati and Wang2015). Unsurprisingly, their adverse effects on the environment, including but not limited to tree loss, created especially local opposition (Sayan Reference Sayan2019; Sayan and Kibaroglu Reference Sayan and Kibaroglu2016).
Another critical sector that is dramatically impacted by the AKP’s extractivist desire is mining. The government subcontracted mining operations to the private sector in many settings to increase production (Adaman et al. 2022). In addition to increasing environmental costs, this practice also brought about tragic incidents such as the Soma mining disaster.Footnote 10
By using remote sensing methods, some previous studies have already shown adverse environmental impacts of mining operations (Gül et al. Reference Gül, Zorlu and Gül2019). In Soma, for instance, where 31 percent of the domestic lignite production takes place, places around the mining areas witness water and air pollution, lower agricultural yield, and deforestation (Karadag Reference Karadag2012). Even when such mining operations stop, studies showed that abandoned open-pit mines can continue to pollute the environment (Yucel and Baba Reference Yucel and Baba2013).
Tourism is another critical industry affected by such extractivist desire due to its links with the construction sector. According to the World Tourism Barometer, Turkey is the sixth most visited country globally (UNWTO 2020). However, while Turkey’s tourism policy aimed to increase the number of tourists, the environment has not been the priority, resulting in the conversion of significant forested lands into tourism-related facilities such as hotels (Kuvan Reference Kuvan2010). Especially after wildfires, the possibility of turning burned forested areas into luxury holiday resorts and hotels has been one of the primary concerns in the opposition media.Footnote 11
In addition to the central government’s extractivist drive in mining, energy, and construction, the competitive authoritarianism also incentivizes local AKP governments to prioritize economic growth and rent creation at the expense of the environment. Although political patronage has always been a historical problem for Turkey (Heper and Keyman Reference Heper and Keyman1998), the AKP government made it the basis of the competitive authoritarian regime (Esen and Gumuscu Reference Esen and Gumuscu2018, p. 351). Local governments are not the primary actors in the design of environmental policies; however, they are important actors when it comes to the execution of these policies (Orhan Reference Orhan, Bulut, Eren, Karakaya and Aydın2013). Moreover, local governments in Turkey play direct roles in preserving green areas in urban spaces because they are responsible for taking care of them within their jurisdiction. Both the municipal law (5993 Sayılı Belediye Kanunu) and the metropolitan municipal law (5216 sayılı Büyükşehir Belediye Kanunu) make clear that local governments are responsible for green areas (Toprak Reference Toprak2017). Moreover, local governments can directly affect tree cover within their boundaries due to their authority in city development plans. They can modify existing plans and create rents at the expense of the environment.
Last, some previous studies have argued that conflict between insurgent Kurdistan Workers Party (PKK) and the Turkish state forces can also increase deforestation (Gurses Reference Gurses2012; Van Etten et al. Reference Van Etten, Jongerden, de Vos, Klaasse and van Hoeve2008). These studies argue that state forces’ deliberate attempts to limit the insurgents’ capacity to wage war can also bring about deforestation. That is why I also analyze the impact of conflicts on deforestation in the analyses that follow.
After presenting the empirical strategy and data in the next section, I will show that activities in the mining and energy sectors correlate with deforestation in the country. Moreover, I will show that deforestation is higher in districts run by AKP mayors.
Empirical strategy and data
Analyzing correlates of deforestation requires data collection from various sources. I rely on high-resolution spatial data to construct the dependent variable, tree loss, which comes from Hansen et al. (Reference Hansen, Potapov, Moore, Hancher, Turubanova, Tyukavina, Thau, Stehman, Goetz, Loveland, Kommareddy, Egorov, Chini, Justice and Townshend2013). They use Landsat data to compile high-resolution global maps of tree cover change. Satellites use remote sensing technology to collect high-resolution reflectance characteristics of the ground. Each pixel reflects lights in a different way. For instance, water reflects lights differently than forests. Based on these reflectance characteristics, each pixel is classified (Iverson et al. Reference Iverson, Graham and Cook1989).
Because this data is high resolution (around thirty meters), I aggregated them at the district (ilçe) level. In particular, I calculated the percentage of tree loss of the total net land.Footnote 12 That is, for each district and year, I first counted the number of pixels—each is around 625 m2 —that witnessed tree loss.Footnote 13 Then, I divided this by the total number of pixels (the total net land) and multiplied by 100 to get the percentage of tree loss per year for each district. I use this variable, Total % Tree Loss, as my main dependent variable in the analysis.
To show the fine granularity of the data, I created an İstanbul map in which I highlighted pixels that witnessed tree loss in different periods. As you can see in Figure 1, the new airport’s damage to tree coverage is immediately apparent. One can also visually track the damage caused by the newly built highway for the third bridge. I construct Total % Tree Loss by essentially tracking these pixels.
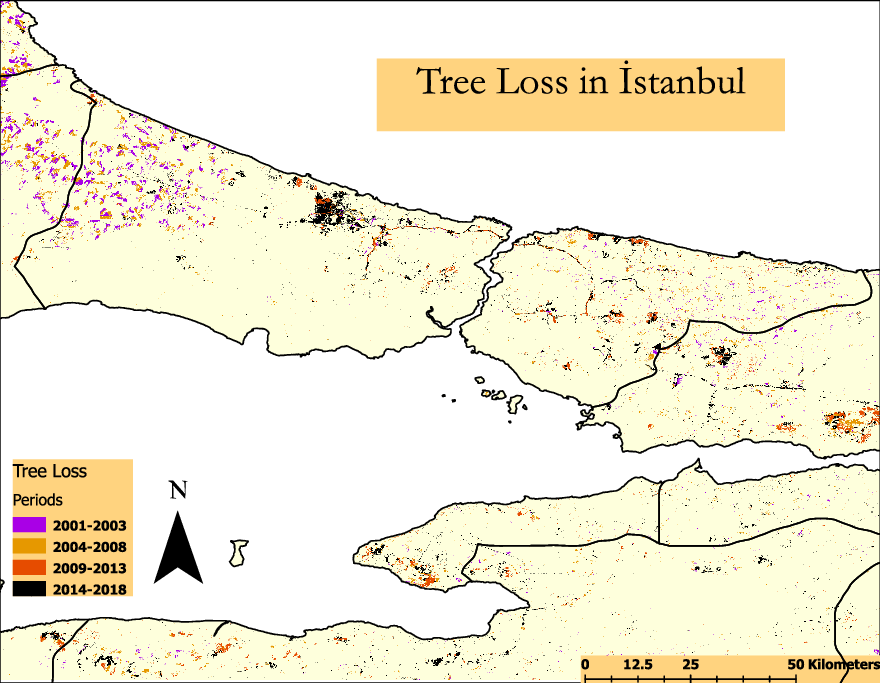
Figure 1. Tree loss in İstanbul and its surroundings in different periods.
Based on the discussion in the previous section, I identified several variables that would correlate with deforestation. First, to identify local governments’ impact on deforestation, I created a measure to proxy for the AKP’s local rule intensity. For each election period, I identify the mayors’ partisan affiliations. Because municipalities are nested within districts, I used a weighted ratio variable to measure the AKP local rule’s intensity. In particular, I divided the number of voters that live under AKP municipalities by the total number of voters within each district. This weighted ratio variable takes into account differences in municipality sizes. For instance, in a district with two municipalities, if the AKP mayor is running a municipality twice as large as the non-AKP municipality, the AKP local rule variable will be two-thirds in this weighted specification, as opposed to one-half. Although I use this weighted AKP local rule variable as my independent variable in the analyses that follow, I also show that the results are robust to different specifications. Also, note that each district has exactly one municipality in provinces with metropolitan status after the 2014 change in the Metropolitan Municipal Law.
To measure the impact of hydroelectric plants, I created an original dataset on the new hydropower plants built in the analyzed period. I used various sources such as the online energy atlasFootnote 14 and various government reportsFootnote 15 to determine the date and the location of each new hydropower plant built. As a result, I managed to identify 502 hydropower plants built in the analyzed period (2004–2018). Because this is a count variable, I log-transformed it before using it in the analyses and created No. of New Hydropower Plants (log) variable.Footnote 16
For the mining sector, I use data from the Turkish Statistical Institute’s Workplace survey, which was last conducted in 2002, and create the Mining Share variable, defined as the ratio of the number of workplaces in the mining sector over the total number of workplaces in a given district. Given that the mining law has changed in 2004, the numbers from 2002 are mostly underestimating the current mining practices. Although this data is not up-to-date, it gives us a good baseline to account for differences across mining practices.
I use a dummy variable for the tourism sector that takes the value one if the district is on the Mediterranean or Aegean shores. To the extent that tourism affects deforestation adversely, we should see that these coastal districts lose more trees than the rest of the country.
I also use an extensive set of control variables that might correlate with deforestation. For instance, I use two variables to control general economic activities in districts. Previous studies have shown that population pressures and economic activities increase deforestation (Geist and Lambin Reference Geist and Lambin2002; Günşen and Atmiş Reference Günşen and Atmiş2019; Tolunay Reference Tolunay2017). Therefore, we should expect higher tree loss in places that witness higher economic activity and population growth. The first measure is Nightlight Difference, which captures changes in economic activity in a given district. The literature has shown that nightlights are a good proxy for economic activities, and many empirical studies employed nightlight data to proxy for economic growth in cases in which official statistics do not exist or are not reliable (Düşündere Taşöz Reference Düşündere Taşöz2019; Henderson et al. Reference Henderson, Storeygard and Weil2012; Hu and Yao Reference Hu and Yao2019). Because the nightlight data series changed after 2013,Footnote 17 I standardized the nightlight values within each period to make them comparable across different periods. Then, I calculated their difference, and I used this differenced variable in the regressions to proxy for economic growth. I also created the Average Population Growth variable because population growth can also cause increases in tree loss.
As mentioned in the preceding text, because various studies have also shown that conflict can also cause tree loss because of fires, I counted the number of conflicts that took place in Turkey between 2004 and 2018 using UCDP Georeferenced Event Dataset (Sundberg and Melander Reference Sundberg and Melander2013). This dataset includes information about the location of conflicts worldwide.Footnote 18 Using this location information, I counted the number of conflicts for each district in each period. I log-transformed this variable as well before using it in the analyses.Footnote 19
I also control for climatic factors that can explain tree loss in certain regions in three ways. First, all model specifications in the following text include province dummies (province fixed effect). This makes sure that we are only comparing provinces within themselves, and we are not comparing across provinces. Hence, fixed-effect models ensure that we are not comparing, say, Artvin, a province on the Black Sea coast with high forest area, with Yozgat, a province without significant green spaces. Province fixed effect also absorbs any uncontrolled time-invariant heterogeneity across provinces that could explain tree loss differences. Second, I use high-resolution temperature and precipitation data, which is available from 1960 at a monthly level for the whole world with around twenty kilometer spatial resolution (Fick and Hijmans Reference Fick and Hijmans2017). Using these monthly data, I constructed the average temperature range (maximum-minimum temperature in Celcius) and average precipitation (in mm) for every district. To further control for baseline differences in terms of tree coverage across districts, I also control for baseline green share in certain specifications.
Lastly, I control for fires using high-resolution firing data from NASA.Footnote 20 It records every fire captured by the satellites, and I counted the total number of fires within each district across years. Similar to other count variables, I also log-transformed this variable before using it in the analyses.
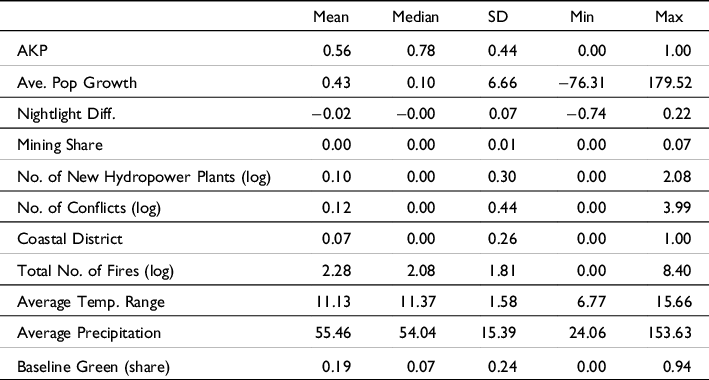
Using this data, I constructed a panel dataset for each district for three election periods: 2004–2008, 2009–2013, and 2014–2018. I aggregated at the election period level because mayors are the same within an election period. Therefore, my unit of analysis is the district-election period. The descriptive statistics are presented in Table 1.
Table 1. Descriptive statistics of all variables used in the analyses
Then, using this panel dataset, I estimated the following linear model:
 \begin{align}&
{\rm{TreeLos}}{{\rm{s}}_{{\rm{it}}}} = {{\rm{\gamma }}_1}{\rm{AK}}{{\rm{P}}_{{\rm{it}}}} + {{\rm{\gamma }}_2}{\rm{LogNewHydroPlant}}{{\rm{s}}_{{\rm{it}}}} + {{\rm{\gamma }}_3}{\rm{MiningShar}}{{\rm{e}}_{{\rm{it}}}} + {\rm{X\beta }} + {{\rm{\alpha }}_{\rm{j}}} + {{\rm{\theta }}_{\rm{t}}}\\
&\quad + {\varepsilon _{{\rm{it}}}}\end{align}
\begin{align}&
{\rm{TreeLos}}{{\rm{s}}_{{\rm{it}}}} = {{\rm{\gamma }}_1}{\rm{AK}}{{\rm{P}}_{{\rm{it}}}} + {{\rm{\gamma }}_2}{\rm{LogNewHydroPlant}}{{\rm{s}}_{{\rm{it}}}} + {{\rm{\gamma }}_3}{\rm{MiningShar}}{{\rm{e}}_{{\rm{it}}}} + {\rm{X\beta }} + {{\rm{\alpha }}_{\rm{j}}} + {{\rm{\theta }}_{\rm{t}}}\\
&\quad + {\varepsilon _{{\rm{it}}}}\end{align}
where ${\rm{TreeLos}}{{\rm{s}}_{{\rm{it}}}}$
is the percentage of tree loss for district i within the period t, t ∈ (2004–2008, 2009–2013, 2014–2018).
${\rm{TreeLos}}{{\rm{s}}_{{\rm{it}}}}$
is the percentage of tree loss for district i within the period t, t ∈ (2004–2008, 2009–2013, 2014–2018). $AK{P_{it}}$
is the share of AKP-controlled municipalities (weighted by voters) in a given district i for the period t,
$AK{P_{it}}$
is the share of AKP-controlled municipalities (weighted by voters) in a given district i for the period t, $LogNewHydroPlant{s_{it}}\;$
and
$LogNewHydroPlant{s_{it}}\;$
and $MiningShar{e_{it}}$
are the logged number of new hydro power plants built and the share of mining enterprises in a given district i for the period t, respectively.
$MiningShar{e_{it}}$
are the logged number of new hydro power plants built and the share of mining enterprises in a given district i for the period t, respectively. $X$
is the set of other covariates as summarized above.
$X$
is the set of other covariates as summarized above. ${{\rm{\alpha }}_j}$
is the set of province dummies (province fixed effect), and
${{\rm{\alpha }}_j}$
is the set of province dummies (province fixed effect), and ${{\rm{\theta }}_t}$
is the set of period dummies (time fixed effect).Footnote
21
${{\rm{\theta }}_t}$
is the set of period dummies (time fixed effect).Footnote
21
Results
Before presenting the main results, we can see how tree loss geographically varies across districts. To see that, I created the following map (see Figure 2). It shows that especially coastal districts witnessed higher tree loss in these years while Central Anatolian districts have lower tree loss. Of course, this is partly driven by the weak tree cover in Central Anatolia in the first place. That being said, however, Eastern Black Sea districts seem to perform slightly better than Mediterranean and Aegean districts despite having dense tree cover.
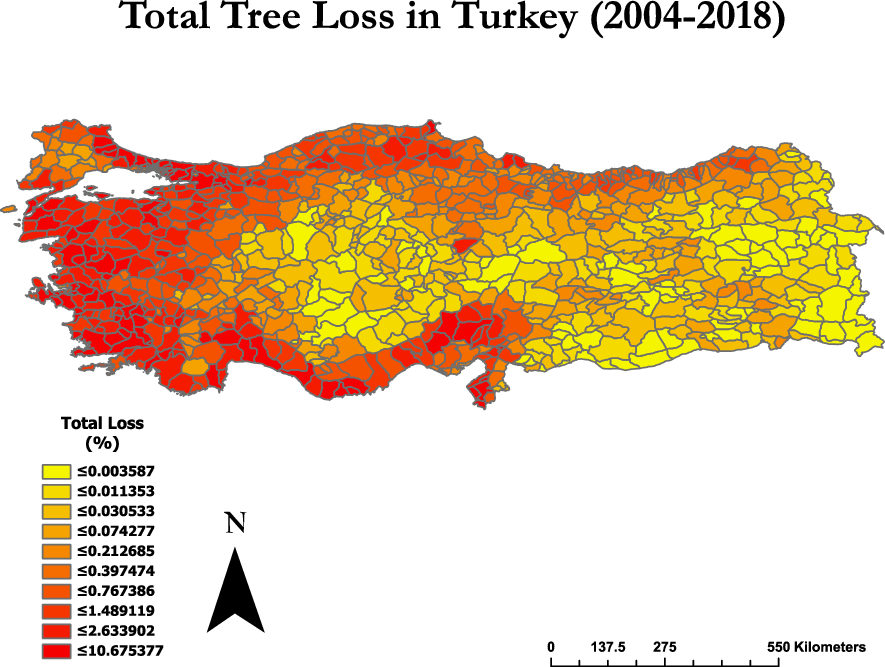
Figure 2. Total tree loss in Turkey.
To systematically analyze the correlates of deforestation, I estimated the model specified in the preceding text. The main results are presented in Table 2. To make sure that outliers do not drive the results, I also excluded extreme values based on the tree loss distribution.Footnote 22 In each model, I introduce a new set of variables. All models include every primary variable of interest: AKP rule, average population growth, nightlight difference, mining share, number of new hydropower plants, and number of conflicts. I also add geographic (coastal district) and climatic variables (total number of fires, average temperature range, average precipitation, and baseline green share) in order. I control for baseline green areas in the last two models because regions with already poor green areas have fewer trees to lose in the first place. The last model also includes a period fixed effects to account for common shocks. Among all models, three variables are consistently correlated with deforestation in the expected directions: AKP rule, mining share, and the number of new dams.
Table 2. The correlates of tree loss in Turkey
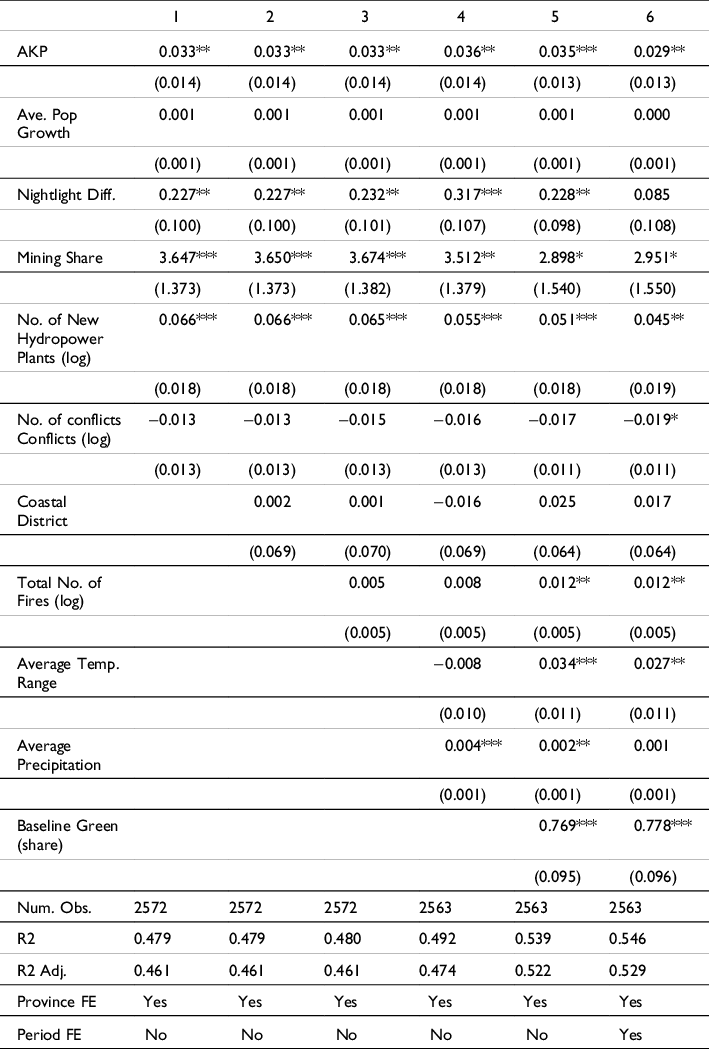
Standard errors are clustered at the district level.
* p < 0.1, ** p < 0.05, *** p < 0.01.
First, the local AKP rule is positively associated with deforestation at the district level. Using Model 5, we see that one unit increase in local AKP rule, meaning going from a district with no AKP mayor to a district ruled only by AKP mayor(s), positively correlates with tree loss by around 0.035 percent. This is around 1/10 of the standard deviation of the outcome variable. Given the limited impact of local governments on environmental policy design, this is a substantively sizeable impact. This translates into around forty-two football fields (or approximately 0.3 km2). Because Model 5 uses data from 827 different districts (excluding outliers), a back-of-the-envelope calculation suggests that in a hypothetical scenario in which only AKP mayors rule in every municipality, there would be tree loss equivalent to a combined area of 35,000 football fields in each election period.
These results only compare the differential impact of local AKP rule on tree loss by comparing districts among each other. Therefore, they do not capture the effect of the central government. Because the central government’s actions can affect tree cover in non-AKP municipalities as well, these results are underestimating the AKP’s actual impact on the tree cover.
Turning to the central government’s extractivist policies in mining, energy, and tourism, we see that the mining share variable is positively associated with deforestation, although this variable is statistically significant only at the 10 percent level in the preferred specification (model 5). In the sample, many districts, such as Çanakkale-Bozcaada, Adana-Feke, and Bolu-Gerede, have zero shares of mining enterprises in 2002 while the maximum mining share is in Kastamonu-Küre (7.2 percent). Holding everything else constant, going from minimum (0) to maximum value (0.072) of mining share increases tree loss by around 0.21 percent (0.072 × 2.898). This suggests that going from a district with no mining activity to the maximum observed in the sample translates into tree loss equivalent to an area of 253 football fields in a single district for each election period.
Similarly, building new hydropower plants positively correlates with tree loss. Going from one hydropower plant to the maximum observed in the sample (seven hydropower plants) translates into tree loss equivalent to an area of 120 football fields in a single district for each election period. Being a coastal district by itself, however, is not correlated with tree loss.
Other variables are also correlated with tree loss in expected directions, although some are not statistically significant at conventional levels. For instance, nightlight difference, a proxy for economic activity, is positively correlated with tree loss, although it is not significant in the last model. Similarly, the coefficient for average population growth is positive but not significant. The number of conflicts does not seem to be correlated with deforestation either.
Among the climatic factors, we see that temperature range is positively correlated with deforestation, suggesting that places with higher variability in temperature are also more likely to witness tree loss. However, Average Precipitation is not correlated with tree loss once I include baseline green share and period fixed effects in the models (as in Model 6).
Last, we see that the total number of fires is positively correlated with tree loss as expected. The average number of fires per period is around sixty per district, while Mardin-Kızıltepe has the highest number with 4,456 fires recorded for the period 2014–2019, which is a clear outlier. Holding everything else constant, going from one fire (25th percentile) to thirty-three fires (75th percentile) in a given district suggests an increase in tree loss by around 0.04 percent for a given district in each period. This translates into an area equivalent to fifty football fields.
To further analyze how our main variables of interest, AKP rule, mining share, and new dams, jointly impact tree loss in the analyzed time frame, I use Model 5 in Table 2 to simulate expected tree loss under two hypothetical scenarios. The first hypothetical district has no AKP mayor and has no mining activity or new hydropower plant built during the analyzed period. The second hypothetical district’s municipalities are all governed by AKP mayors, have the highest observed mining activity in the sample (7.2 percent of all enterprises in the district is mining), and witnessed the highest number of new hydropower plants built (seven). I hold all other variables at their central tendencies (mean or median) and calculate their predicted tree loss shares for these two hypothetical districts. The result is plotted in Figure 3. The predicted tree loss share in the first hypothetical district is 0.84 percent [0.68, 0.99]. In the second hypothetical district with no AKP mayor, a new hydropower plant, or mining activity, however, the predicted tree loss is 0.49 percent [0.42, 0.56]. These results imply that the combined effect of all these three variables brings about an average 71.4 percent increase in tree loss.

Figure 3. Predicted tree loss in two hypothetical districts.
To show that the results are not model dependent, I conduct a series of robustness analyses. First, I repeat the analyses in Table 3 by excluding three major cities (İstanbul, Ankara, İzmir) in the first two models. In the following two models, I exclude central districts from the sample and repeat the analyses. The results are substantively similar for our main variables of interest, alleviating the concerns that the results are purely driven by İstanbul, Ankara, İzmir or central districts in each province. In the Appendix, I repeat the analyses by including the outliers into the sample, and the results are substantively similar (Table A1 in the Appendix).
Table 3. The correlates of tree loss in Turkey (excluding major cities and central districts)

Standard errors are clustered at the district level.
*p < 0.1, **p < 0.05, ***p < 0.01.
As a further robustness check, I created another variable to measure the intensity of the local AKP rule. Instead of weighting by the population under AKP municipalities, I created a dummy variable that takes the value one if AKP mayors govern all people in the district. The rest is coded as zero. Note that this is the most conservative measure for local AKP rule because many AKP-ruled municipalities are coded as 0 in this approach. Hence, this variable compares districts exclusively governed by AKP mayors with others. The results are presented in the Appendix and repeated for all the analyses conducted in the preceding text.Footnote 23
Conclusion
This article provides the first systemic empirical analysis on the correlates of deforestation in Turkey. The results show that deforestation in districts with AKP municipalities is higher than in non-AKP municipalities. Similarly, new hydropower plants and increased mining activities are positively associated with deforestation. These results are robust to including a different set of controls and model specifications. By providing an empirical analysis, this article aims to contribute to the debates on the drivers of deforestation in Turkey.
Although the results show that AKP municipalities are more likely to witness tree loss, they do not tell us why this is the case. One plausible mechanism is rent seeking: AKP municipalities are more flexible in catering to private interests at the expense of the environment when judicial oversight does not work and the media is politically captured. It could also be that AKP municipalities might be more willing to sacrifice the environment in exchange for votes with various infrastructural, residential, and industrial projects. The empirical analysis presented in this article cannot disentangle these different mechanisms, and future studies should focus more on identifying distinct mechanisms that affect tree loss.
The impact of other factors is easier to interpret and put into context. The results show that mining activities and new hydropower plants positively correlate with deforestation. Holding everything else constant, going from no mining activity to the maximum level of activity observed in the sample is correlated with higher deforestation by an area of around 253 football fields in a given district. The adverse impact of the hydropower plants is around half the mining impact because building six new power plants, the maximum observed in the sample, is positively correlated with deforestation by around 120 football fields. It should be kept in mind that these results should not be interpreted as the “causal” effects because the research design does not allow us a clear causal identification strategy.
Conflict does not seem to be correlated with deforestation, unlike the findings of the previous studies. Two reasons could drive this. First, these studies focus on the 1990s, during which the conflict between Kurdish insurgents and the state forces was the most intense (Gurses Reference Gurses2012; Van Etten et al. Reference Van Etten, Jongerden, de Vos, Klaasse and van Hoeve2008). This article, however, focuses on the post-2000s, in which the intensity of conflict was much lower. Second, both studies that found an impact focus only on one region, while this study conducts a systemic analysis of all districts for three different election periods.
Satellite data allows us to study the correlates of deforestation in Turkey while it is not feasible to conduct the same analysis with official data. In addition to studying deforestation, future studies can also leverage remote sensing to study other environmental problems such as air pollution (Gupta et al. Reference Gupta, Christopher, Wang, Gehrig, Lee and Kumar2006) and water quality (Ritchie et al. Reference Ritchie, Zimba and Everitt2003) and analyze how politics, both at the national and local level, impacts these environmental issues. Using such data alleviates the need for official data, which might be distorted, low quality, aggregated at levels that mask the variation, or nonexistent at all. Future studies should look more for such data sources, especially in authoritarian settings where governments manipulate information (Adiguzel et al. Reference Adiguzel, Cansunar and Corekcioglu2020).
Supplementary material
To view supplementary material for this article, please visit https://doi.org/10.1017/npt.2022.28
Financial Support
This research received no specific grant funding form any funding agency, commercial, or not-for-profit sectors.


 Open access