


Introduction
The primary forests of the Congo basin, a vast area that encompasses large parts of six Central African countries, are of special interest for carbon sequestration and climate change mitigation (Justice et al., Reference Justice, Wilkie, Zhang, Brunner and Donoghue2001; Xu et al., Reference Xu, Saatchi, Shapiro, Meyer, Ferraz and Yang2017), as well as for biodiversity conservation (e.g. Gibson et al., Reference Gibson, Lee, Koh, Brook, Gardner and Barlow2011). However, there is a lack of base data on the biodiversity of this region (Gibson et al., Reference Gibson, Lee, Koh, Brook, Gardner and Barlow2011; Verbeeck et al., Reference Verbeeck, Boeckx and Steppe2011). Such data are required for effective conservation as this region is subject to deforestation, forest degradation and other anthropogenic pressures (Nasi et al., Reference Nasi, Taber and Van Vliet2011; Potapov et al., Reference Potapov, Turubanova, Hansen, Adusei, Broich and Altstatt2012; Ernst et al., Reference Ernst, Mayaux, Verhegghen, Bodart, Christophe and Defourny2013; Megevand et al., Reference Megevand, Mosnier, Hourticq, Sanders, Doetinchem and Streck2013). We acknowledge the value of local knowledge (Alempijevic et al., Reference Alempijevic, Hart, Hart and Detwiler2021) but we refer here to documented evidence in databases, specimen collections or publications.
The lack of ecological research in the eastern part of the Congo basin, particularly in the Democratic Republic of the Congo (DRC), arises from logistical challenges and periods of armed conflicts and political instability (Draulans & Van Krunkelsven, Reference Draulans and Van Krunkelsven2002; Anthony et al., Reference Anthony, Atteke, Bruford, Dallmeier, Freedman and Hardy2015; Butsic et al., Reference Butsic, Baumann, Shortland, Walker and Kuemmerle2015). These challenges extend to the protection of biodiversity and ecosystems in formally recognized protected areas, historically a key tool for conservation. Threats include encroachment by artisanal mining, increases in illegal bushmeat hunting, ivory extraction, a lack of political and financial support for protected area management, armed conflicts and attacks on protected area staff (Draulans & Van Krunkelsven, Reference Draulans and Van Krunkelsven2002; de Merode & Cowlishaw, Reference de Merode and Cowlishaw2006; Beyers et al., Reference Beyers, Hart, Sinclair, Grossmann, Klinkenberg and Dino2011; Butsic et al., Reference Butsic, Baumann, Shortland, Walker and Kuemmerle2015; Verweijen & Marijnen, Reference Verweijen and Marijnen2018).
Given the challenges to conservation and research in formally protected areas in DRC, community-based conservation initiatives may be considered for both the protection of biodiversity and the facilitation of ecological field research (Baghai et al., Reference Baghai, Miller, Blanken, Dublin, Fitzgerald and Gandiwa2018). The effectiveness and sustainability of such conservation efforts have been debated and depend largely on the socio-economic model employed (Pagdee et al., Reference Pagdee, Kim and Daugherty2006) and financial considerations (Lescuyer et al., Reference Lescuyer, Kakundika, Lubala, Ekyamba, Tsanga and Cerutti2019). Community-based conservation models need to be tailored to local environments and species to be effective, especially when considering sustainable human use of forest resources (Vermeulen et al., Reference Vermeulen, Julve, Doucet and Monticelli2009). For this, improved documentation of biodiversity is required for these largely unexplored forests (Anthony et al., Reference Anthony, Atteke, Bruford, Dallmeier, Freedman and Hardy2015), a task for which camera-trap surveys are particularly useful (Tobler et al., Reference Tobler, Carrillo-Percastegui, Pitman, Mares and Powell2008; Mugerwa et al., Reference Mugerwa, Sheil, Ssekiranda, van Heist and Ezuma2013; Agha et al., Reference Agha, Batter, Bolas, Collins, Gomes da Rocha and Monteza-Moreno2018; Bruce et al., Reference Bruce, Amin, Wacher, Fankem, Ndjassi and Ngo Bata2018).
Here, we present the results of a multi-year survey of the mammalian fauna of a community-managed forest in eastern DRC, the Nkuba Conservation Area (hereafter Nkuba), with camera traps and transects. This area was initially selected for collaborative conservation efforts because of the presence of two globally threatened great apes, the eastern chimpanzee Pan troglodytes schweinfurthii and Grauer's gorilla Gorilla beringei graueri, the ranges of which are only marginally included in protected areas (Plumptre et al., Reference Plumptre, Nixon, Caillaud, Hall, Hart, Nishuli and Williamson2016). By providing a list of mammals present in this forest, we provide an insight into the conservation value of this area, and baseline data for future research and management. Our surveys also provide insights into the diel activity patterns of species, which may be of value for comparative studies across locations and communities (Frey et al., Reference Frey, Fisher, Burton and Volpe2017; Mills et al., Reference Mills, Do Linh San, Robinson, Isoke, Slotow and Hunter2019). We did not have specific predictions for activity patterns but expected to find both nocturnal and diurnal species, with at least some species that are likely to have antagonistic interactions (e.g. predators and prey, or food competitors) partially separated by non-overlapping diel activity patterns (Mills et al., Reference Mills, Do Linh San, Robinson, Isoke, Slotow and Hunter2019).
Although our surveys were originally designed to study the Critically Endangered Grauer's gorilla (Plumptre et al., Reference Plumptre, Nixon, Kujirakwinja, Vieilledent, Critchlow and Williamson2016), they provide a relatively complete overview of the terrestrial mammal community of the area, including the presence of other threatened species, indicating the high conservation value of these forests (Díaz et al., Reference Díaz, Concepción, Oviedo, Caparrós, Farizo and Campos2020). These insights are unique for eastern DRC, where camera-trap studies are as yet uncommon in comparison to other areas of sub-Saharan Africa (e.g. Mugerwa et al., Reference Mugerwa, Sheil, Ssekiranda, van Heist and Ezuma2013; Bruce et al., Reference Bruce, Amin, Wacher, Fankem, Ndjassi and Ngo Bata2018).
Study area
The Nkuba Conservation Area encompasses a vast tract of primary lowland evergreen rainforest in western Nord Kivu province of DRC (Fig. 1). The area covers c. 1,300 km2, of which c. 1,100 km2 is officially recognized as a local community forest concession (Lescuyer et al., Reference Lescuyer, Kakundika, Lubala, Ekyamba, Tsanga and Cerutti2019). There are no roads passable by motorized vehicles and no permanent human settlements, although there are several temporary artisanal mining settlements and hunting camps. Hunting, historically focused on subsistence, is ongoing but there is limited commercialization (Dian Fossey Gorilla Fund International, pers. obs., 2021). Exceptions are the harvest of the African green pigeon Treron calvus and grey parrot Psittacus erithacus, the latter categorized as Endangered on the IUCN Red List (BirdLife International, 2018), which are sold locally for consumption and at more distant markets for the pet trade, respectively, and, formerly, hunting of the African forest elephant Loxodonta cyclotis for the ivory trade.
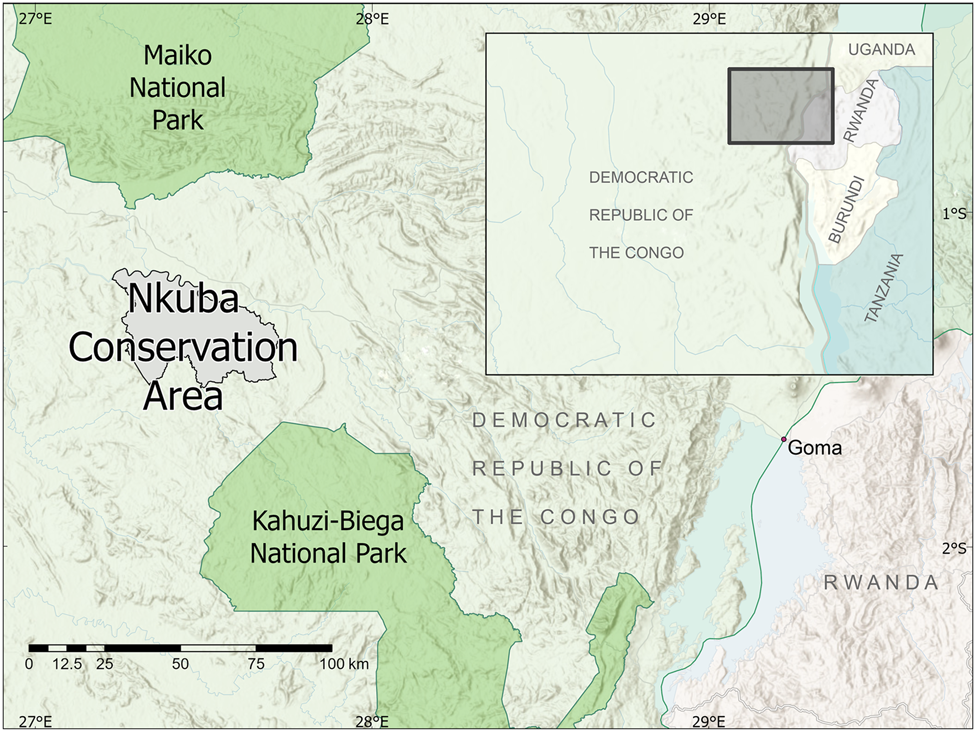
Fig. 1 Location of the Nkuba Conservation Area in eastern Democratic Republic of the Congo.
There is a buffer zone of secondary forest and crop fields between the Lowa river that serves as the northern boundary of Nkuba and the nearest road and larger settlements (of > 100 people, particularly the village of Nkuba). There are no local climate records, but interpolations from regional data indicate that mean annual temperatures are 20–27 °C and mean annual precipitation 2,100–2,500 mm (Karger et al., Reference Karger, Conrad, Böhner, Kawohl, Kreft and Soria-Auza2017a,Reference Karger, Conrad, Böhner, Kawohl, Kreft and Soria-Auzab).
Methods
Camera-trap surveys
We initially planned to space cameras c. 300 m apart, in a 4 × 3 grid across a relatively small area in the centre of Nkuba, chosen to maximize captures of Grauer's gorillas (Fig. 2). However, in practice we often placed cameras off this grid, following indirect observations of animal presence (e.g. trails, faeces) or the presence of fruit trees, with the restriction that cameras were at least 50 m apart (Fig. 2). We started with 12 cameras in 2014, which were placed at a different location approximately every year, but doubled the number of cameras in 2016. Cameras were installed and memory cards and batteries changed by field teams comprising various personnel; EB, UN and DC supervised the initial installation, and YvdH was involved from 2018.
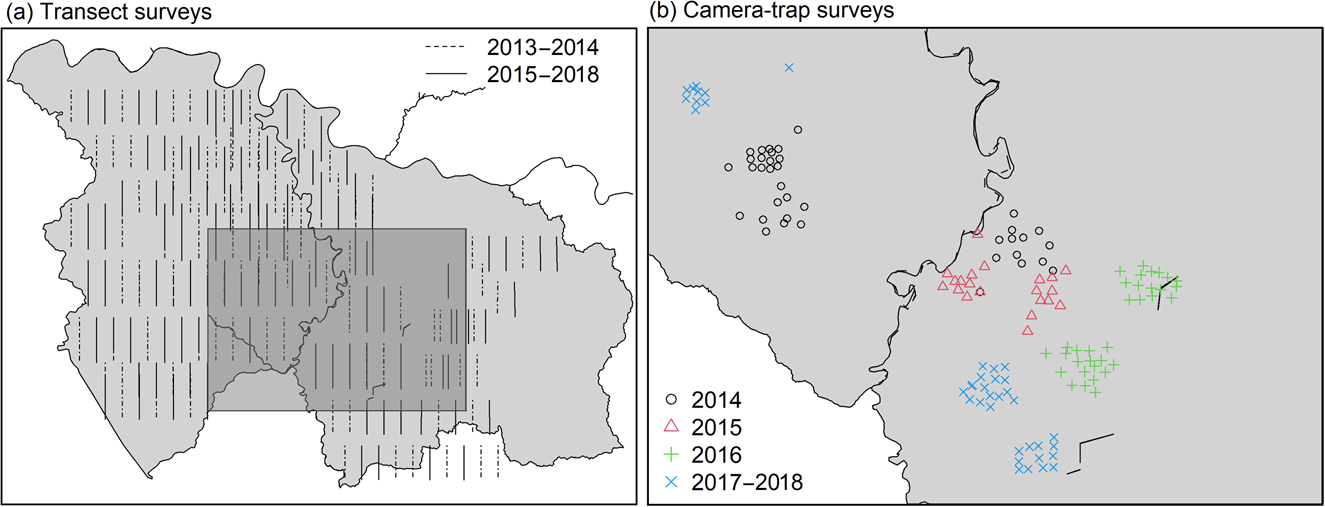
Fig. 2 Locations of (a) transects surveyed during 2013–2014 and 2015–2018, and (b) camera-trap surveys during 2014–2018 in Nkuba Conservation Area (Fig. 1).
We used automatic digital infrared Bushnell (Bushnell, Overland Park, USA) and Reconyx (Reconyx, Holmen, USA) camera traps mounted 25–50 cm above the ground. We set cameras to take either high sensitivity and continuously triggered photographs, with a 1-s interval between consecutive images, or videos. We used a GPS with an accuracy of c. 15 m to record the altitude and location of each camera trap.
Images were initially checked for the presence of animals by four volunteers and YvdH, a team that also made preliminary identifications based on Kingdon (Reference Kingdon2013) and various articles and online resources (e.g. Bruce et al., Reference Bruce, Amin, Wacher, Fankem, Ndjassi and Ngo Bata2018). During this process, we excluded images without any animals and those of particularly low quality or with unidentifiable organisms (e.g. because they were blurred). The final identification was made by YvdH, where necessary in consultation with experts on various taxa (see Acknowledgments).
We focused on predominantly terrestrial mammals > 1 kg. We note the presence of birds, reptiles, and smaller-bodied or arboreal mammals without providing further details on their numbers. We chose 1 kg as the cut-off following initial identifications, recognizing that most smaller species (e.g. mice) could not be confidently identified. We were able to identify two small mammals weighing < 1 kg, but we omitted them from most of our analyses as we may have failed to detect and identify them accurately in all camera images. For mammal taxonomy, we referred to Kingdon et al. (Reference Kingdon, Happold, Butynski, Hoffmann, Happold and Kalina2013).
Transect surveys
To complement the camera-trap data, which were obtained from a relatively small section of Nkuba, we also used records of direct observations, tracks, nest sites or faecal signs of mammals obtained in transect surveys across Nkuba in 2013–2014 and 2015–2018 (Fig. 2). These transects, which were 3–4 km long and 1.5 km apart, were walked slowly by 3–6 observers who recorded identifiable animal signs and locations, with a GPS. Over 20 individuals were involved as observers, with EB supervising the surveys and UN and DC supervising fieldwork and the survey protocol.
Because of logistical challenges, we were unable to maintain a systematic annual monitoring protocol, making adjustments from year to year. In 2013–2014, we walked 91 transects, each 4 km long, once each during March–December, with the team leader following the transect line and other observers walking in parallel 5–10 m from this line. We repeated these surveys between December 2015 and February 2018, but changed the location of some transects and curtailed the length of transects to 3 km.
Identification to species was unreliable for duikers of the genus Cephalophus except the large-bodied yellow-backed duiker Cephalophus silvicultor. Thus, for Cephalophus species except the yellow-backed duiker we listed visual observations of each species but listed all other signs as Cephalophus sp. As with the camera-trap surveys, we focused on mammals > 1 kg.
Statistical analyses
Consecutive images of the same species within 1 hour at a camera-trap station were considered a single event (event hour, following Tobler et al., Reference Tobler, Carrillo-Percastegui, Pitman, Mares and Powell2008). Although we provide summaries of the number of individuals recorded in camera-trap events, we counted the recording of multiple individuals of the same species in an image as one event. We calculated the capture frequency of a given species as the number of events in which a species was present/100 camera days. We also summarized camera events per species by the number of event hours and event days (i.e. the number of days over which a species was recorded).
To estimate species richness for large (> 1 kg) terrestrial mammals we used the vegan package (Oksanen et al., Reference Oksanen, Kindt, Legendre, O'Hara, Stevens, Oksanen and Suggests2007) in R 4.1.1 (R Core Team, Reference R Core Team2020) to compute, with camera-trap days as the sampling unit, the mean of the first- and second-order jackknife estimates of 1,000 permutations, following suggestions that these species richness estimators are more accurate than alternative estimators such as Chao (Tobler et al., Reference Tobler, Carrillo-Percastegui, Pitman, Mares and Powell2008). We also created species rarefaction curves using the exact method and first-order jackknife estimates outlined by Oksanen et al. (Reference Oksanen, Kindt, Legendre, O'Hara, Stevens, Oksanen and Suggests2007). We repeated these analyses for the transects, with transect as the sampling unit.
We examined diel patterns of activity using the camera-trap images. Firstly, we estimated the circular kernel density distribution of the activity patterns of all mammals for which we had at least 5 event hours, using the circular package in R (Oliveira-Santos et al., Reference Oliveira-Santos, Zucco and Agostinelli2013; Agostinelli & Lund, Reference Agostinelli and Lund2017). From this, we calculated the 95% (general activity period) and 50% (core activity period) isopleth for each species, using the modal.region.circular function in the circular package and a bandwidth, κ, of 5. This bandwidth corresponds with that used by Oliveira-Santos et al. (Reference Oliveira-Santos, Zucco and Agostinelli2013) and was estimated using the getBandWidth function of the overlap package in R (Ridout & Linkie, Reference Ridout and Linkie2009). We plotted these estimated activity patterns with the densityPlot function of the overlap package. We used the core activity period to determine whether a species was predominantly nocturnal (18.00–6.00), crepuscular (5.00–6.00/18.00–19.00; from the beginning of astronomical twilight to sunrise/from sunset to the end of astronomical twilight), diurnal (6.00–18.00), or cathemeral (active throughout the daily cycle).
After determination of these activity periods, we estimated the range of time over which a species was active (i.e. the range of 95 and 50% isopleths) and the activity level. We calculated the activity level, which corresponds to the proportion of a day a species is active (0 to 1), using the activity package in R (Rowcliffe, Reference Rowcliffe2016), following Rowcliffe et al. (Reference Rowcliffe, Kays, Kranstauber, Carbone and Jansen2014) and Mills et al. (Reference Mills, Do Linh San, Robinson, Isoke, Slotow and Hunter2019). We ran 1,000 bootstrap iterations of this activity estimation, from which we derived the standard error and 95% confidence intervals. We estimated these activity levels for all terrestrial mammals > 1 kg for which we recorded > 2 event hours, even though these estimates are sensitive to sample size and may require ≥ 100 event hours to stabilize (Lashley et al., Reference Lashley, Cove, Chitwood, Penido, Gardner, DePerno and Moorman2018).
We examined overlap (Δ in Ridout & Linkie, Reference Ridout and Linkie2009) in the activity patterns of selected groups of mammals: (1) between carnivores, (2) between the two largest carnivores in Nkuba and five of their potential prey species, (3) between three duiker species, and (4) between chimpanzees and gorillas. We chose these species as the sample size for each was > 15. This is less than the ≥ 100 threshold recommend for such studies (Lashley et al., Reference Lashley, Cove, Chitwood, Penido, Gardner, DePerno and Moorman2018) but enabled convergence of the totalvariation.circular function in the circular package. An additional reason to select these species is that they are potentially antagonistic in behaviour (competitors or prey–predator pairs) and may require temporal separation to coexist. We estimated overlap for both 95 and 50% activity isopleths, with overlap = 0 implying complete separation of diel activity pattern between two species and overlap = 1 indicating full overlap of activity patterns.
We noted the presence of any infants and the maximum number of individuals in a single camera-trap event. For the latter, we considered the total number of individuals present in a single video, photograph, or the cumulative number over a series of photographs. An example of such a series would be a continuous series of photographs of a group moving through a camera trap's captured area. Individuals arriving in this scene would need to be different from those leaving the scene (e.g. silverback vs infant gorilla). We stopped counting individuals of a group when a series of consecutive photographs was interrupted by an empty photograph, photographs of other species, or a gap to the next photograph of > 1 s. This implies that these counts are a minimum estimate of group size.
Results
Camera-trap surveys
During 2014–2018, we set cameras at 136 locations and recorded for 3–329 days at each (median 77 ± SD 76 days), for a total of 16,414 camera-trap days. We obtained records of 5,686 hourly camera-trap events, of which 4,107 events were of identifiable species and 3,669 events were of mammals > 1 kg identifiable to species. In total, we recorded 29 mammal species > 1 kg in our camera traps, along with other species (Table 1, Supplementary Fig. 1, Supplementary Table 1). Three species (the Vulnerable owl-faced monkey Cercopithecus hamlyni, 1,487 events; blue duiker Philantomba monticola, 674; giant pouched rat Cricetomys sp., 617), together accounted for > 50% of the hourly events, whereas other species, such as the African civet Civettictis civetta, were recorded only once. We recorded seven species categorized as threatened on the IUCN Red List (IUCN, 2020) in 1,355 hourly events, of which 56 and 148 were of gorillas and chimpanzees, respectively.
Table 1 Mammals ≥ 1 kg recorded by camera traps and along transects in the Nkuba Conservation Area, with their IUCN Red List status and details of camera-trapping rates and/or sign counts. Blank cells indicate species not recorded; NA indicates species recorded but not counted.

1 LC, Least Concern; NT, Near Threatened; VU, Vulnerable; EN, Endangered; CR, Critically Endangered.
2 Number of records within 1 hour at a camera-trap station.
3 Number of days on which a species was recorded.
4 Number of cameras, of a total of 167, at which a species was recorded.
Transect surveys
During 2013–2018, we recorded 7,521 signs (7,285 indirect and 236 direct observations) of medium- and large-sized mammals (Table 1). We recorded at least 22 terrestrial mammal species of which six are categorized as threatened on the IUCN Red List (IUCN, 2020). Duikers accounted for 5,438 (c. 73%) records. We recorded 374 gorilla and 208 chimpanzee signs. Not all species recorded by camera traps were also recorded along the transects. This is probably because of failure to identify signs of certain species (e.g. signs of Weyns's duiker Cephalophus weynsi may have been listed as Cephalophus sp.) or the fact that recording signs of smaller species (e.g. mongoose of the genera Atilax and Herpestes) was not a priority for the transect survey.
Species richness
Species rarefaction curves (Fig. 3) and species richness estimates indicate that additional surveys using the same methods would not have recorded many additional species. We recorded a total of 33 terrestrial mammals > 1 kg with the two survey methods combined (29 with camera traps, 22 with transects), and estimated species richness is 32.0 ± SD 1.4 and 22.5 ± SD 8.5 for the camera-trap and transect surveys, respectively.
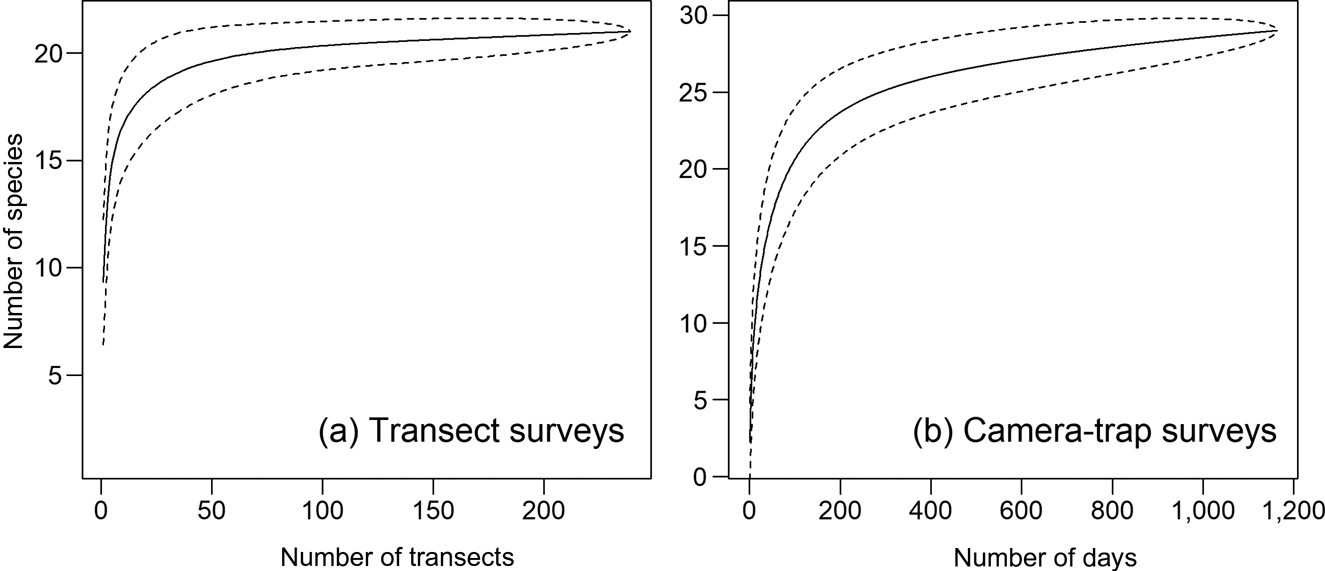
Fig. 3 Species rarefaction curves for terrestrial mammals in the Nkuba Conservation Area from (a) transect surveys and (b) camera-trap surveys. Note the different y-axis scales. The dashed lines indicate the 95% confidence intervals.
Diel activity patterns and records of infants
Of the 26 mammals for which we had sufficient records of hourly events to model diel activity, we found that the 50% core activity of 10 species was largely nocturnal, 12 were largely diurnal, and four were cathemeral (Fig. 4, Supplementary Table 2). No species were strictly crepuscular, but the 50% isopleth of core activity of 10 species overlapped with hours of dawn (5.00–6.00) or dusk (18.00–19.00). Fourteen species showed bimodal or trimodal core activity periods. For some species, these multimodal distributions of diel activity are periods of core activity before and after a resting period, such as the paucity in activity near midday for the chimpanzee. But, for a species such as the servaline genet Genetta servalina, whose lowered activity between bimodal peaks in core activity coincided with the core activity period of the potentially dominant African golden cat Caracal aurata, this pattern is less clear-cut as the sample size did not reach the threshold of 100 above which estimates of activity periods stabilize.
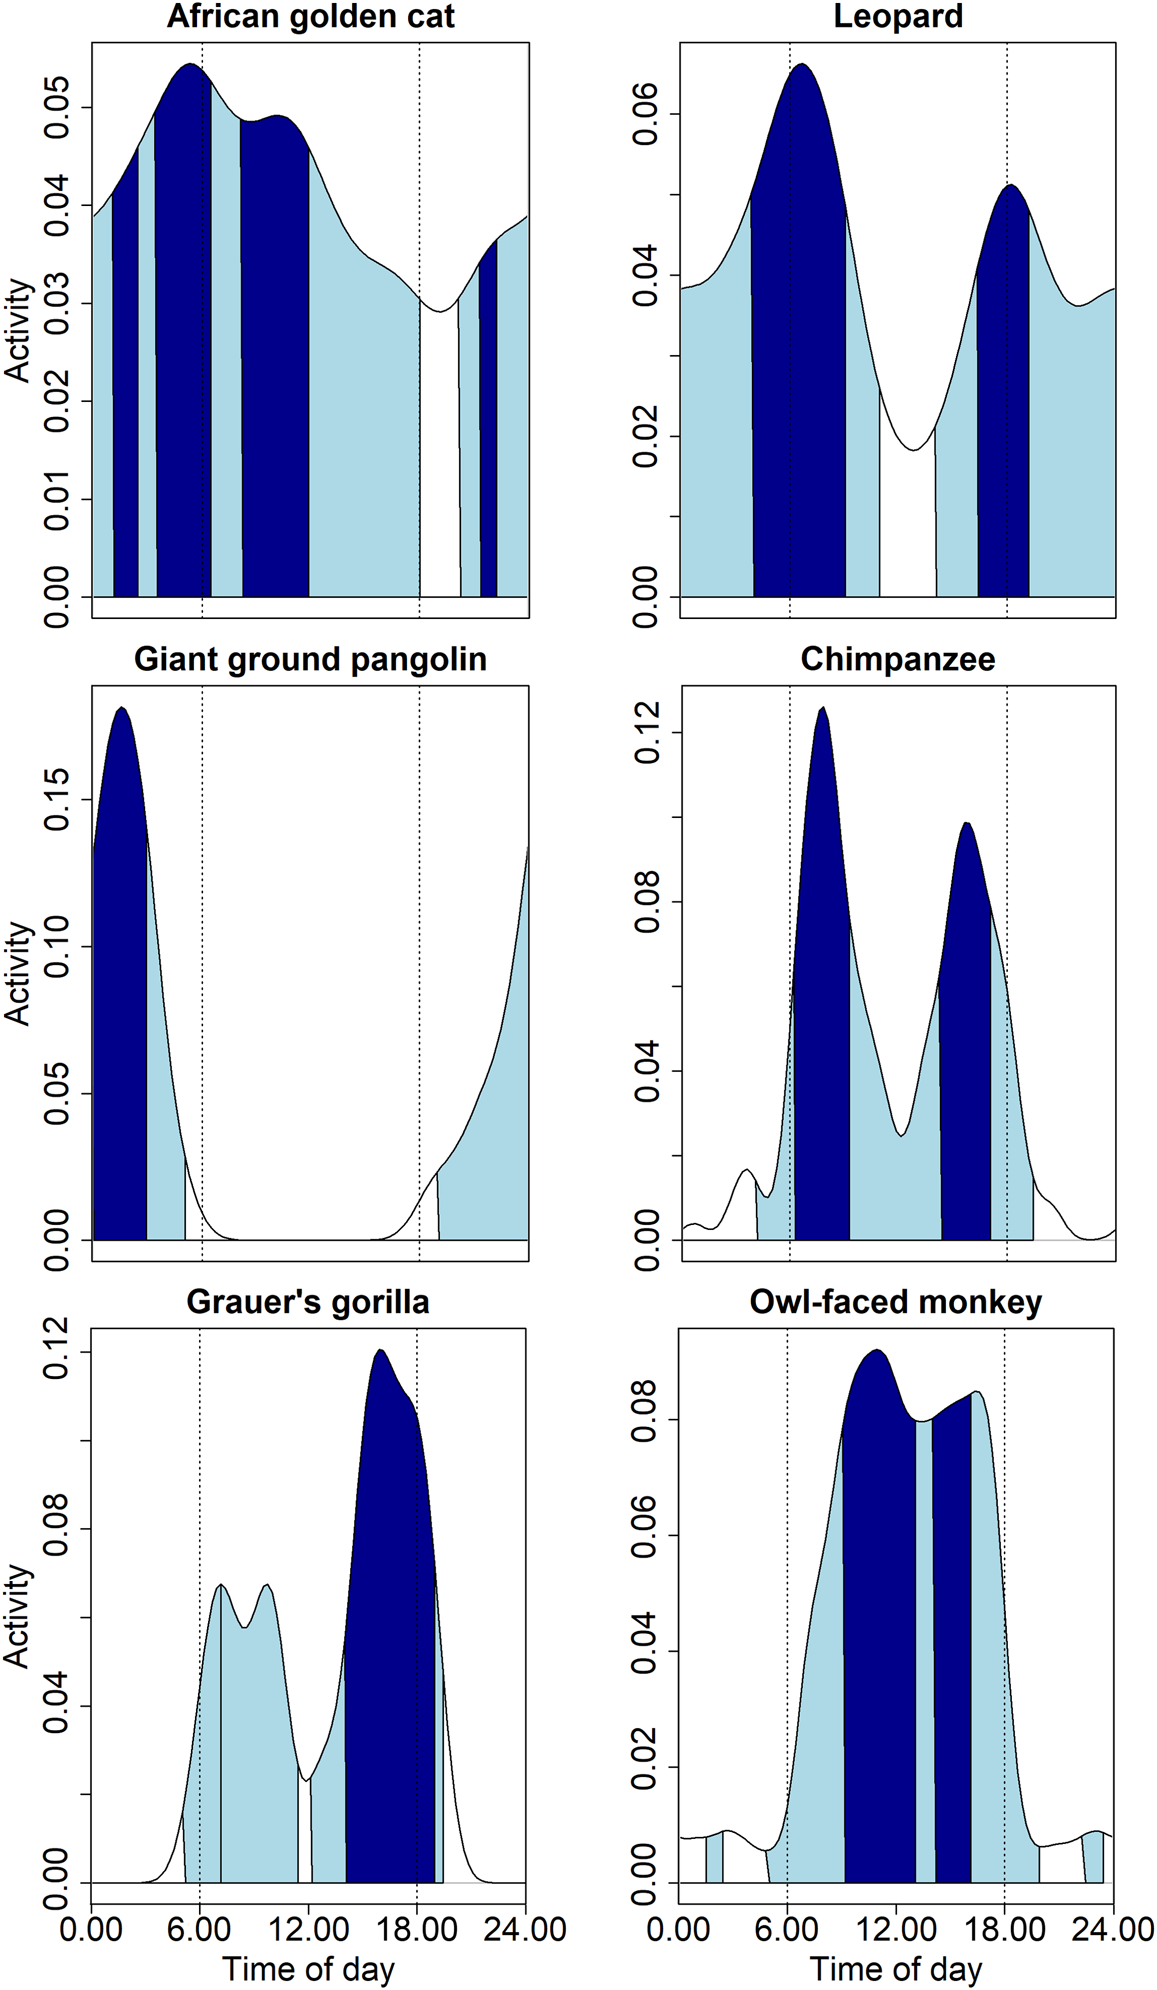
Fig. 4 Diel activity patterns of six threatened species (African golden cat Caracal aurata, leopard Panthera pardus, giant ground pangolin Smutsia gigantea, chimpanzee Pan troglodytes schweinfurthii, Grauer's gorilla Gorilla beringei graueri and owl-faced monkey Cercopithecus hamlyni) in the Nkuba Conservation Area, showing 50% core activity times (dark) and 95% general activity times (light) as calculated with circular kernel density estimation (see text for details). Note the different y-axis scales. The white-bellied pangolin Phataginus tricuspis, one of the seven globally threatened species detected, is not shown as its activity pattern is largely identical to that of the giant ground pangolin.
Cathemeral species had long core activity periods and high activity levels, with African golden cats (range 9.35 h, activity level 0.572 ± SE 0.108), leopards Panthera pardus (8.20 h, 0.564 ± 0.104), and red river hogs Potamochoerus porcus (8.93 h, 0.567 ± 0.095) having the longest activity periods (Supplementary Table 2). The large standard errors for some species reflect the small sample sizes, although additional samples would probably only increase the length of activity periods. Of species with ≥ 100 event hours, the African brush-tailed porcupine Atherurus africanus had the shortest (3.78 h, 0.416 ± 0.026) and the yellow-backed duiker (7.30 h, 0.510 ± 0.061) the longest core activity period. The mean core activity period of all seven species with a sample size of ≥ 100 was 5.53 h (0.427 ± 0.04).
The largest carnivores in Nkuba, the leopard and African golden cat, largely overlapped in diel activity (0.75 for the 95% isopleths; 0.41 for the 50%; Supplementary Table 3, Fig. 5). The overlap of both species with other carnivores was lower (< 0.65 for the 95% isopleths for all species pairs; < 0.36 for all 50% isopleth comparisons). As expected, overlap was higher between species active during similar times of day (e.g. marsh mongoose Atilax paludinosus and long-nosed mongoose Herpestes naso) than it was for species with separate activity periods (e.g. honey badger Mellivora capensis and servaline genet). Yet, even species active during similar times of day differed in the hours of peak activity. For example, chimpanzees and gorillas were both most active during daylight hours, but the peak core activity of the chimpanzees was nearly equally distributed across morning and afternoon whereas gorillas were particularly active during the late afternoon (Supplementary Table 2, Figs 4 & 5). This resulted in a large overlap between periods of general activity (0.82) but a smaller one for core activity (0.42).
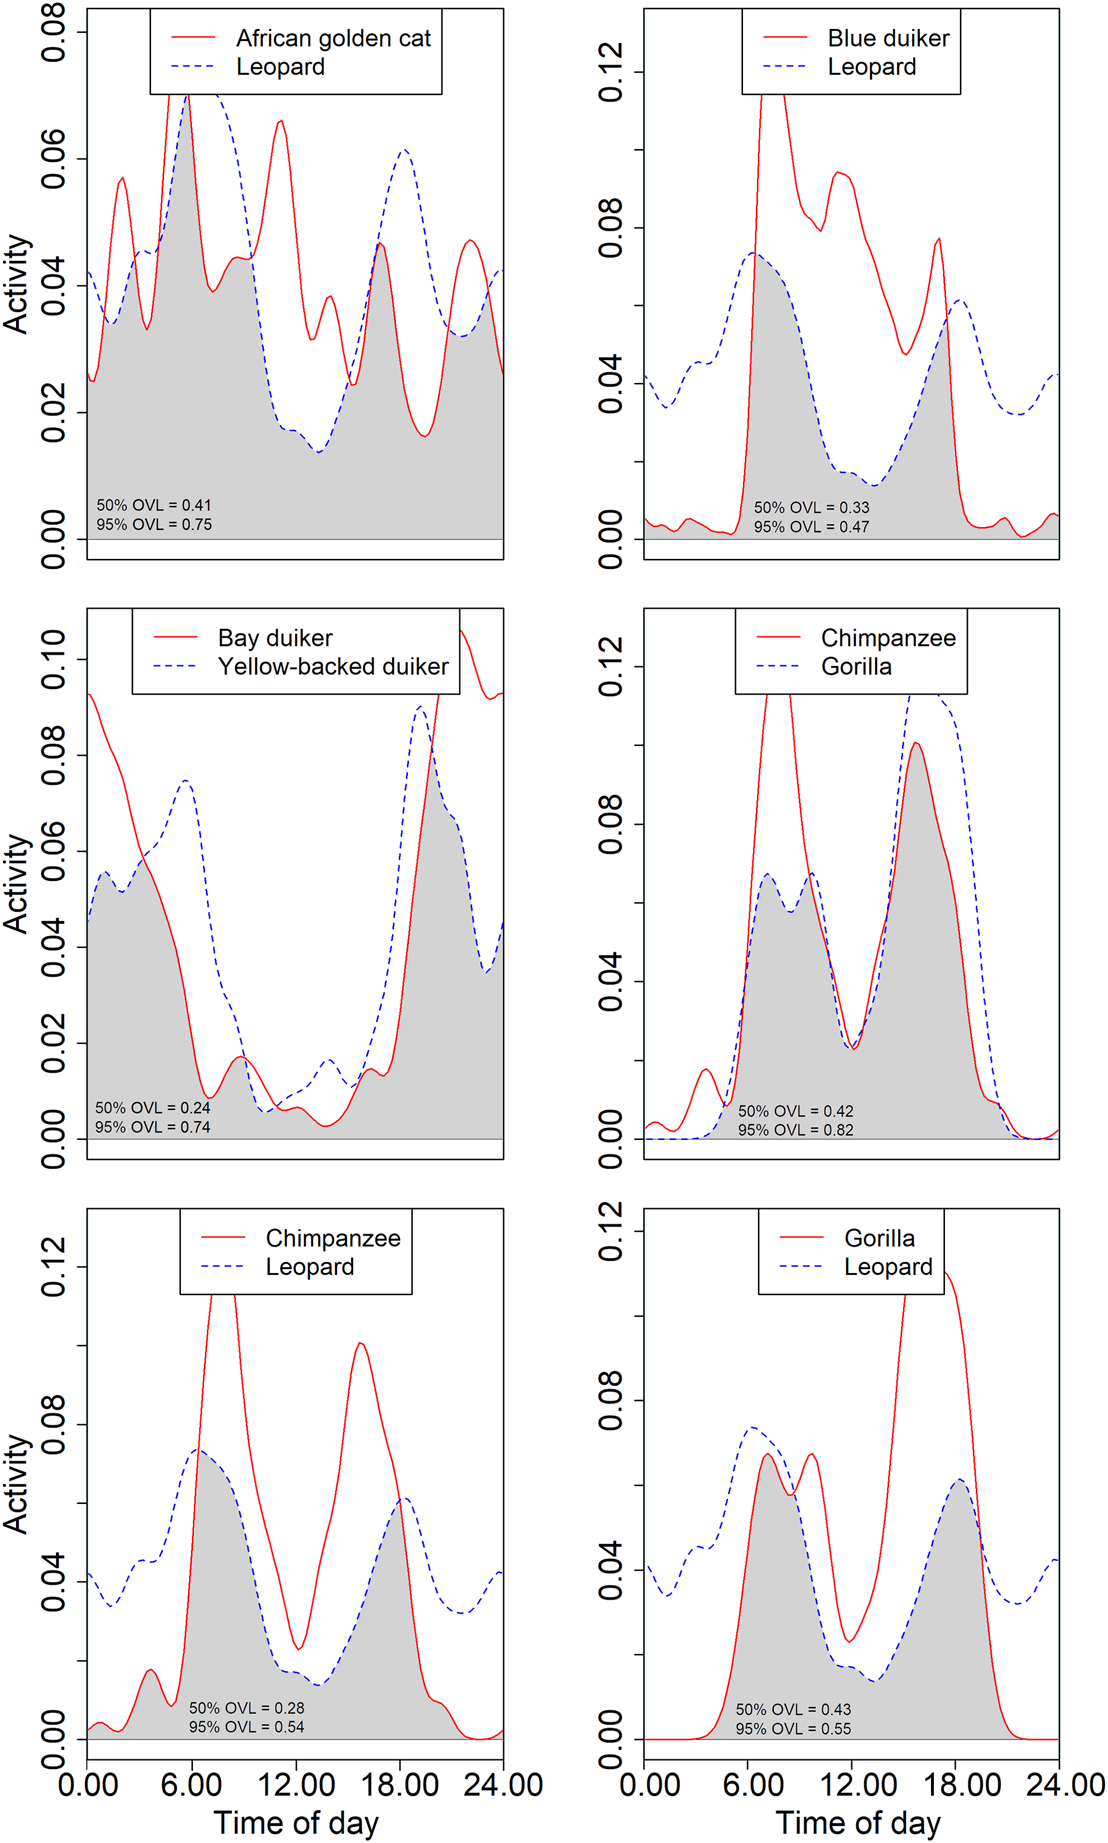
Fig. 5 Examples of overlap (indicated in grey) of kernel density estimates of diel activity. Comparisons are between two large predators (leopard and African golden cat), the leopard and a common prey (blue duiker Philantomba monticola), two large-bodied nocturnal herbivores (bay duiker Cephalophus dorsalis and yellow-backed duiker Cephalophus silvicultor), two great apes (chimpanzee and Grauer's gorilla), and the chimpanzee and gorilla with the leopard. The text indicates the overlap (OVL) of the 95 and 50% activity patterns (see text for details).
We recorded infants and juveniles of an apparent pre-weaning age of nine species in 62 separate camera-trap events (Supplementary Table 4). We were unable to determine seasonality in reproductive behaviour, but juvenile red river hogs were recorded at three distinct times of the year and owl-faced monkeys were accompanied by immature individuals throughout the year. This suggests that these two species may reproduce year-round. For many species, we found multiple individuals in single camera photographs or series of continuous photographs, sometimes in surprisingly large groups (Table 1, Supplementary Table 1). This includes species usually considered solitary, such as the honey badger Mellivora capensis for which we recorded two individuals together in this study but found four individuals together in additional images from 2019.
Discussion
The Nkuba Conservation Area harbours mammals of a broad range of body sizes and trophic guilds, including many globally threatened species. This community includes some species likely to show antagonistic interactions that seem partially separated in ecological niche space by segregated diel activity patterns. Documenting this rich mammalian fauna offers starting points for future ecological research and validates efforts to protect forests, or at least this particular forest, outside the formally protected areas of eastern DRC through community-based conservation (Grantham et al., Reference Grantham, Shapiro, Bonfils, Gond, Goldman and Maisels2020).
There is a relatively low level of human disturbance in Nkuba and it harbours several threatened species that elsewhere have been depleted by hunting and other human activities. However, comparable areas such as Maiko National Park (Amsini et al., Reference Amsini, Grossmann, Hart, Kibambe, Nyembo and Vyahavwa2006, Reference Amsini, Grossmann, Hart, Kibambe, Nyembo and Vyahavwa2007) and Lomami National Park (Batumike et al., Reference Batumike, Imani, Urom and Cuni-Sanchez2021) harbour large-bodied mammals such as elephants that we did not record in Nkuba. Anecdotal information suggests that elephants were present before c. 1997 (U. Ngobobo, pers. comm., 2021) and were extirpated largely by hunting for their ivory (Maisels et al., Reference Maisels, Strindberg, Blake, Wittemyer, Hart and Williamson2013). Hunting is also the most likely explanation for the absence of primates such as mangabey Lophocebus sp., black-and-white colobus Colobus sp. and red colobus Piliocolobus sp., which are present in Kahuzi-Biega National Park (Inogwabini et al., Reference Inogwabini, Hall, Vedder, Curran, Yamagiwa and Basabose2000; Hall et al., Reference Hall, White, Williamson, Inogwabini and Ilambu2003) and Lomami National Park (Batumike et al., Reference Batumike, Imani, Urom and Cuni-Sanchez2021). Although birds were not the focus of this study, we did not record the Vulnerable Congo peafowl Afropavo congensis, endemic to DRC, which may formerly have lived in these forests (Hart & Upoki, Reference Hart and Upoki1997).
The camera-trap and transect methods proved complementary. Species such as the arboreal blue monkey Cercopithecus mitis and Dent's monkey Cercopithecus denti were only recorded during transect surveys, whereas camera traps facilitated identification of antelopes such as Weyns's duiker Cephalophus weynsi and Bates' pygmy antelope Neotragus batesi. This suggests that monitoring and inventory efforts should include multiple field methods for the most complete overview of an area's faunal community (e.g. Lyra-Jorge et al., Reference Lyra-Jorge, Ciocheti, Pivello and Meirelles2008; Hausser et al., Reference Hausser, Tagand, Vimercati, Mermod and Fischer2017; Mazzolli et al., Reference Mazzolli, Haag, Lippert, Eizirik, Hammer and Al Hikmani2017). Other complementary methods include DNA-based studies (Gogarten et al., Reference Gogarten, Hoffmann, Arandjelovic, Sachse, Merkel and Dieguez2020), acoustic monitoring (Deichmann et al., Reference Deichmann, Hernández-Serna, Campos-Cerqueira and Aide2017), arboreal camera trapping (Bowler et al., Reference Bowler, Tobler, Endress, Gilmore and Anderson2017), and the integration of local knowledge (Alempijevic et al., Reference Alempijevic, Hart, Hart and Detwiler2021). All such survey methods rely on accurate species identification, which for camera-trap and transect studies depends on image quality and observer knowledge. Mongooses, genets and antelopes are examples of pairs or groups of species for which identification can be difficult, including in this study. Additional records, ideally combined with genetic evidence (e.g. Van Vliet et al., Reference Van Vliet, Zundel, Miquel, Taberlet and Nasi2008), will be required to confirm records of such pairs or groups of species.
Our analyses of diel activity patterns provide improved knowledge of the natural history of several mammal species. As an example, we highlight two observations, one which contrasts with our current understanding of a species' behaviour and one that confirms previous studies. Firstly, studies of radio-collared individuals have suggested that sympatric marsh and long-nosed mongooses have segregated diel activity patterns (Ray, Reference Ray1997), with the former crepuscular and the latter diurnal, but we found comparable peaks in movement, during early daylight hours, for both species. This suggests these similarly sized species must be separated in niche space by other factors, such as habitat use or dietary preferences (Ray, Reference Ray1997). Secondly, we confirm that African golden cats are largely cathemeral when sympatric with leopards, in contrast to a more nocturnal specialization in the absence of leopards (Mills et al., Reference Mills, Do Linh San, Robinson, Isoke, Slotow and Hunter2019).
Nkuba has not yet experienced the extent of potentially detrimental human activities, such as mining and logging, prevalent in other parts of eastern DRC, including in established protected areas (Spira et al., Reference Spira, Kirkby, Kujirakwinja and Plumptre2019). However, land adjacent to Nkuba is experiencing increases in various commercial (e.g. mining) and demographic (e.g. population expansion and the associated need for agricultural land) pressures (Molinario et al., Reference Molinario, Hansen, Potapov, Tyukavina and Stehman2020), threats that will only be halted through the active protection of remaining forests (Galford et al., Reference Galford, Soares-Filho, Sonter and Laporte2015). In addition, past hunting led to local extirpation of the elephant, and Nkuba merits conservation investment to ensure hunting is mitigated before it leads to the local extirpation of additional species. For globally threatened species it may be crucial to protect relatively undisturbed habitat as refuges that aid species persistence when it proves difficult to halt threats across their range (Reside et al., Reference Reside, Briscoe, Dickman, Greenville, Hradsky and Kark2019). For these reasons, and the potential of these forests for carbon storage and delivery of ecosystem services (Hugues, Reference Hugues2011; Xu et al., Reference Xu, Saatchi, Shapiro, Meyer, Ferraz and Yang2017), we conclude that protection of the forests of Nkuba Conservation Area is worthy of further support and institutional engagement.
Acknowledgements
We thank L'Institut Congolais pour la Conservation de la Nature and local landowners and community members for permitting us to work in the Nkuba region and collaborating with us on its protection, all field assistants, local community members and interns who contributed to this project, and Mike Hoffmann, Emmanuel Do Linh San, Ara Monadjem and Tom Bruce for help with species identifications. This research was made possible through the generous support of many individuals and foundations, particularly Rita Grolitzer, and through grants from the Great Ape Conservation Fund of the U.S. Fish & Wildlife Service, the Arcus Foundation, the Daniel L. Thorne Foundation and the Turner Foundation.
Author contributions
Study design, fieldwork: DC, EB, UN; data analysis, writing: YvdH, DC, UN, TDS.
Conflicts of interest
None.
Ethical standards
This research abided by the Oryx guidelines on ethical standards. No specimens were taken during this study and fieldwork took place with permission of L'Institut Congolais pour la Conservation de la Nature and with the consent of local landowners and community members.


 Open access