

Introduction
Forest ecosystems support biodiversity and provide essential services to people (FAO, 2016). Estimates suggest that forests contain > 50% of all terrestrial plant and animal species (Secretariat of the Convention on Biological Diversity, 2010), but many forest ecosystems are declining and becoming more degraded as a result of increasing human disturbance (Hosonuma et al., Reference Hosonuma, Herold, de Sy, De Fries, Brockhaus and Verchot2012). These threats continue to intensify as the human population grows and more people inhabit biodiverse areas (Fisher & Christopher, Reference Fisher and Christopher2007).
The walnut–fruit forests of Central Asia have declined dramatically in the last 50 years; only 5–10% of their original area remains (Djanibekov et al., Reference Djanibekov, Villamor, Dzhakypbekova, Chamberlain and Xu2016). They occur at altitudes of 800–2,100 m (Hemery & Popov, Reference Hemery and Popov1998) in the foothills of the Tian-Shan mountain range, within the Central Asian biodiversity hotspot (Critical Ecosystem Partnership Fund, 2016). These forests play an important environmental and cultural role in this region, providing ecosystem services, including soil protection and water regulation, and resources for wildlife and local communities (Cantarello et al., Reference Cantarello, Lovegrove, Orozumbekov, Birch, Brouwers and Newton2014). The largest remaining area of walnut–fruit forest is in Kyrgyzstan (Epple, Reference Epple2001), the most forested country in Central Asia (Djanibekov et al., Reference Djanibekov, Villamor, Dzhakypbekova, Chamberlain and Xu2016). However, over the past 100 years the forest area has been greatly reduced, driven by the economic recession following Kyrgyzstan's independence. Rural communities rely increasingly on natural resources and agricultural practices, leading to expansion of agricultural areas, increased grazing pressure, and unsustainable exploitation of forest products (Borchardt & Dorre, Reference Borchardt and Dorre2012).
Today 65% of the country's population live in rural areas (Djanibekov et al., Reference Djanibekov, Villamor, Dzhakypbekova, Chamberlain and Xu2016) and 50% live below the poverty line (Fisher & Christopher, Reference Fisher and Christopher2007). Firewood collection and livestock grazing are the greatest immediate threats to the forest ecosystem, with Kyrgyz households collecting 4–43 m3 of firewood per year and livestock generally allowed to graze without restrictions in the forest (Djanibekov et al., Reference Djanibekov, Villamor, Dzhakypbekova, Chamberlain and Xu2016). Many regions have implemented management strategies to achieve sustainable use of forest resources (Kyrgyz Government et al., 1997; Fisher et al., Reference Fisher, Schmidt, Steenhof and Akenshaev2004). However, in many forest tracts these management and protection rules are not adhered to (Orozumbekov et al., Reference Orozumbekov, Cantarello and Newton2015), leading to extensive environmental damage (Hemery & Popov, Reference Hemery and Popov1998; Herold, Reference Herold2005).
Our study focuses on the Endangered Malus niedzwetzkyana, a close, but rarer, relative of Malus sieversii, which is thought to be the ancestor of most domesticated apples (Cornille et al., Reference Cornille, Giraud, Smulders, Gladieux and Rolda2014). Both species are exploited heavily for their fruit and firewood (Morgan & Richards, Reference Morgan and Richards2013). Anthocyanin pigments give the blossom of Malus niedzwetzkyana a distinctive pink colour, making this species easily distinguishable from other trees in these forests and giving it an iconic status with local people. The fruit is distinctively red both inside and out because it also contains these pigments in its skin and flesh. Anthocyanins are flavonoid compounds whose antioxidant, anti-carcinogenic, and anti-inflammatory properties confer extensive health benefits (Bagchi et al., Reference Bagchi, Sen, Bagchi and Atalay2004; Boyer & Liu, Reference Boyer and Liu2004; Konczak & Zhang, Reference Konczak and Zhang2004). This species could therefore be an important genetic resource that could lead to the development of red-fleshed cultivars with benefits for human health (Sekido et al., Reference Sekido, Hayashi, Yamada, Shiratake, Matsumoto, Maejima and Komatsu2010) whilst also retaining genetic diversity (Velasco et al., Reference Velasco, Zharkikh, Affourtit, Dhingra, Cestaro and Kalyanaraman2010).
Only a few small, isolated populations of M. niedzwetzkyana are extant, making this species exceptionally vulnerable to extinction, with the largest known population recorded in the Jalal-Abad region of Kyrgyzstan (Cantarello et al., Reference Cantarello, Lovegrove, Orozumbekov, Birch, Brouwers and Newton2014; Orozumbekov et al., Reference Orozumbekov, Cantarello and Newton2015). This area is the primary focus of conservation efforts to maintain walnut–fruit forest ecosystems in general and M. niedzwetzkyana in particular. However, many conservation actions currently lack a clear scientific basis. In this study we develop an evidence-based approach to the conservation of this species, supporting the growing movement for data-driven conservation initiatives (Sutherland et al., Reference Sutherland, Pullin, Dolman and Knight2004).
We used species distribution modelling to identify climatically suitable areas for M. niedzwetzkyana across Kyrgyzstan and to determine fieldwork locations. We devised a threat assessment to provide insight into which of these climatically suitable sites should receive targeted funding, and explored the most appropriate interventions for each location. We analysed population structures to determine the regeneration capacity of M. niedzwetzkyana within the sites, and recorded ecological data across all survey sites to develop a basic understanding of the species’ ecology. We present key information on the population and ecology of, and the threats to, this species and its habitat, to improve local conservation decision making. This will enable better support for communities and protection of M. niedzwetzkyana so that this species remains a key component of the iconic walnut–fruit forests of Kyrgyzstan and Central Asia.
Study area
We conducted fieldwork during 14 May–22 June 2017 in four sites within the Jalal-Abad region: Sary-Chelek Biosphere Reserve (Sary-Chelek), Dashman Reserve (Dashman), Kara-Alma Forestry Unit (Kara-Alma), and Gava Forestry Unit (Gava). These sites are also the focus of Fauna & Flora International's (FFI) regional conservation work for the Global Trees Campaign, and FFI has established strong working relationships with local rangers. We chose smaller fieldwork areas within each site, to focus our research efforts on forested areas (Fig. 1).

Fig. 1 Study area in Kyrgyzstan, showing fieldwork sites and locations of Malus niedzwetzkyana individuals.
Methods
Species distribution modelling
We selected the maximum entropy model, Maxent v. 3.4.0 (Phillips et al., Reference Phillips, Anderson and Schapire2006), as suitable for modelling the distribution of M. niedzwetzkyana because it is highly accurate with small sample sizes (Elith et al., Reference Elith, Phillips, Hastie and Dudı2011; Qin et al., Reference Qin, Liu, Guo, Bussmann, Ma and Jian2017), can be run with presence-only data (Phillips et al., Reference Phillips, Anderson and Schapire2006), and is widely used in conservation science (Trisurat et al., Reference Trisurat, Chimchome, Pattanavibool, Jinamoy, Thongaree and Kanchanasakha2013; Liang et al., Reference Liang, Kang and Pettorelli2017). We obtained occurrence records from the Bioresurs project, which thoroughly sampled the walnut–fruit forests of the Jalal-Abad region (Cantarello et al., Reference Cantarello, Lovegrove, Orozumbekov, Birch, Brouwers and Newton2014; Orozumbekov et al., Reference Orozumbekov, Cantarello and Newton2015), providing 28 location points for M. niedzwetzkyana.
Initially, we considered 23 environmental variables as potential indicators of the distribution of M. niedzwetzkyana. These variables are widely recognized as factors that affect plant distributions and have been effective in determining the distribution of species in a similar threatened situation to that of M. niedzwetzkyana (Kumar & Stohlgren, Reference Kumar and Stohlgren2009). We obtained 19 bioclimatic variables and elevation data at 30 second resolution (c. 1 km2) from WorldClim (Hijmans et al., Reference Hijmans, Cameron, Parra and Jarvid2005). We generated slope and aspect raster files from the elevation data, with the QGIS 2.14 terrain analysis tool (QGIS Development Team, 2009). A global land cover file (GlobCover2009) was also included (Arino et al., Reference Arino, Ramos Perez, Kalogirou, Bontemps, Defourny and Van Bogaert2012).
We tested multicollinearity between all variables by calculating a Pearson correlation coefficient matrix. A correlation coefficient for each pair of variables was generated and using these values we selected the variable with the strongest correlation with the majority of predictors from each group of highly correlated variables (r > 0.85) to be included in the model (Kumar & Stohlgren, Reference Kumar and Stohlgren2009; Qin et al., Reference Qin, Liu, Guo, Bussmann, Ma and Jian2017). This reduced the model to 10 parameters (Table 1), making it more likely to detect variables that caused the greatest effect (Porfirio et al., Reference Porfirio, Harris, Lefroy and Hugh2014). Because of the small sample size (< 80 individuals), we ran the model using only the linear, quadratic and hinge features of the Maxent programme (Elith et al., Reference Elith, Phillips, Hastie and Dudı2011). We selected 25% of the Bioresurs tree location points as test data for the model; all other settings were kept at their defaults (Qin et al., Reference Qin, Liu, Guo, Bussmann, Ma and Jian2017). We produced two models: one using the global land cover file, and one excluding it, to highlight climatically suitable areas both within and outside areas currently forested.
Table 1 List of model inputs, their source, and percentage contribution to both models produced using Maxent software.

1Source: GlobCover 2009 (Arino et al., Reference Arino, Ramos Perez, Kalogirou, Bontemps, Defourny and Van Bogaert2012).
2Source: WorldClim (Hijmans et al., Reference Hijmans, Cameron, Parra and Jarvid2005).
3Source: Generated in GIS from Digital Elevation Model.
The model's accuracy was determined by its area under the receiver operating characteristic curve (AUC) value: AUC > 0.9 = very good; AUC 0.7–0.9 = good; AUC < 0.7 = uninformative (Swets, Reference Swets1988; Baldwin, Reference Baldwin2009). We used a jackknife analysis to determine the most important factors affecting habitat suitability. Factors with a contribution to the model of < 5% were deemed redundant predictors (Qin et al., Reference Qin, Liu, Guo, Bussmann, Ma and Jian2017). We imported the results of both models into QGIS and presented them using the classification system employed by Kumar & Stohlgren (Reference Kumar and Stohlgren2009).
Threat assessment
Using the Maxent ecological model and a forest cover raster (Hansen et al., Reference Hansen, Potapov, Moore, Hancher, Turubanova and Tyukavina2013), we selected areas for fieldwork within each of the four areas classified as having high ecological suitability for the species. To ensure all landscape features were accounted for we used stratified random sampling to distribute random sample points across all strata. We categorized the landscape of the fieldwork areas into seven strata (clusters) using a K-mean cluster analysis (Rubin, Reference Rubin1967), with each cluster capturing distinct landscape features. We produced the clusters using a digital elevation model obtained from the Shuttle Radar Topography Mission (SRTM; USGS 2004; Jarvis et al., Reference Jarvis, Reuter, Nelson and Guevara2008), slope data (radians), aspect data (radians), relative slope position data calculated with the SAGA GIS ‘Basic Terrain Analysis’ module from SRTM, and NDVI (normalized difference vegetation index) calculated from Landsat-8 images (NASA Landsat Program). We generated five random GPS points within each cluster at each site, with a minimum distance of 200 m between them, resulting in 35 points at each site. Where the generated points fell in locations that were inaccessible because of geographical features, we took measurements as close as possible to the original position, to ensure landscape sampling remained representative. We sampled additional points where the landscape showed unexpected features that needed to be captured to ensure model accuracy, resulting in 151 sites assessed.
We created a north facing quadrat of 50 × 50 m (0.25 ha) at each site, using the GPS point as the centre. In a few areas that were difficult to access we reduced the quadrat size. This was recorded and accounted for when scoring the area by examining the extent of damage indicators and then scaling up appropriately, ensuring the scoring remained comparable between all sites (Orozumbekov et al., Reference Orozumbekov, Cantarello and Newton2015).
Inside each quadrat we assessed damage caused by livestock grazing and firewood collection, using six indicators of grazing damage and four firewood collection indicators (Supplementary Material 1). The grazing indicators were adapted from Reimoser et al. (Reference Reimoser, Armstrong and Suchant1999); the firewood indicators were developed based upon FFI's Sary-Chelek monitoring programme and personal communication with the FFI office in Bishkek. Each indicator was visually scored: 1, no threat; 2, light threat; 3, moderate threat; 4, high threat; 5, very high threat (Reimoser et al., Reference Reimoser, Armstrong and Suchant1999). The indicators were weighted equally to derive a mean overall score in each quadrat. The firewood indicators ‘burning signs’ and ‘felled wood abundance’ were ignored if slopes were > 30° or if a settlement was within 100 m. We recorded altitude, slope angle, and aspect of each site, using a GPS and a clinometer, and the mean undergrowth height (with a tape measure) and per cent canopy cover (estimated to the nearest 10% by eye, using the same observer for each measurement; Supplementary Material 2).
Ecology and population structure
We used previously recorded M. niedzwetzkyana locations from the Bioresus project and identified additional trees using ranger knowledge, where possible. We only measured trees found within our designated fieldwork areas as this is where conservation interventions are currently planned. Trees were studied within three sites: Gava, Kara-Alma and Sary-Chelek. The fourth site, Dashman, contains no M. niedzwetzkyana individuals. For each tree we measured the diameter at breast height (DBH) and recorded its location. At each tree location we recorded altitude, slope angle, aspect and ecological factors, as described for the threat assessment quadrats.
Data analysis
We compared the distribution of threat scores for firewood collection and livestock at each site, to identify which sites were most damaged. We also compared the distribution of threat scores across all sites, for both firewood collection and livestock grazing, using χ 2 tests on contingency tables created in R 3.4.0 (R Core Team, 2016). When significant variation was detected between sites, a further comparison between each pair of sites was undertaken, again using χ 2 tests. The distribution of scores for each site was assessed to evaluate the extent of threats from firewood collection and livestock grazing (Supplementary Figure 1).
We assessed the variation in mean undergrowth height between and within our sites as a proxy for undergrowth damage. The Shapiro–Wilk test revealed variation in mean undergrowth height between sites to be non-normal and so we transformed the data using a Box–Cox transformation with the R package MASS (Venables & Ripley, Reference Venables and Ripley2002). We ran a one-way ANOVA to determine whether there was significant variation of undergrowth damage between sites and a Post-hoc Tukey HSD (honestly significant difference) test to determine the relationship between each pair of sites.
We plotted the frequency distribution of the DBH of trees at each site, to examine whether the distributions conformed to the inverse J-shape, also known as type 1 structure, of a healthy regenerative population (Newton, Reference Newton2007; Orozumbekov et al., Reference Orozumbekov, Cantarello and Newton2015). A stable population should have a large number of individuals in lower DBH classes; fewer individuals are expected in the larger DBH classes because of an increasing likelihood of mortality over time. We also tested the relationship between the aspect, slope and percentage canopy cover at M. niedzwetzkyana locations and that of the general environment using χ 2 tests, to describe the ecology at tree locations.
Results
Species distribution modelling
The Maxent models provided insight into historical forest cover and guided our fieldwork. The model containing global land cover data (Fig. 2) was ‘very good’, with an AUC of 0.989 ± SD 0.005, showing the model performs much better than a random model. The Maxent internal jackknife test highlighted global land cover as the most important predictor of suitable habitat for M. niedzwetzkyana, explaining 53.5% of the variation associated with species location (Table 1). Precipitation of coldest quarter (19.7%), isothermality (14.3%), and slope (6.8%) were also significant explanatory variables.
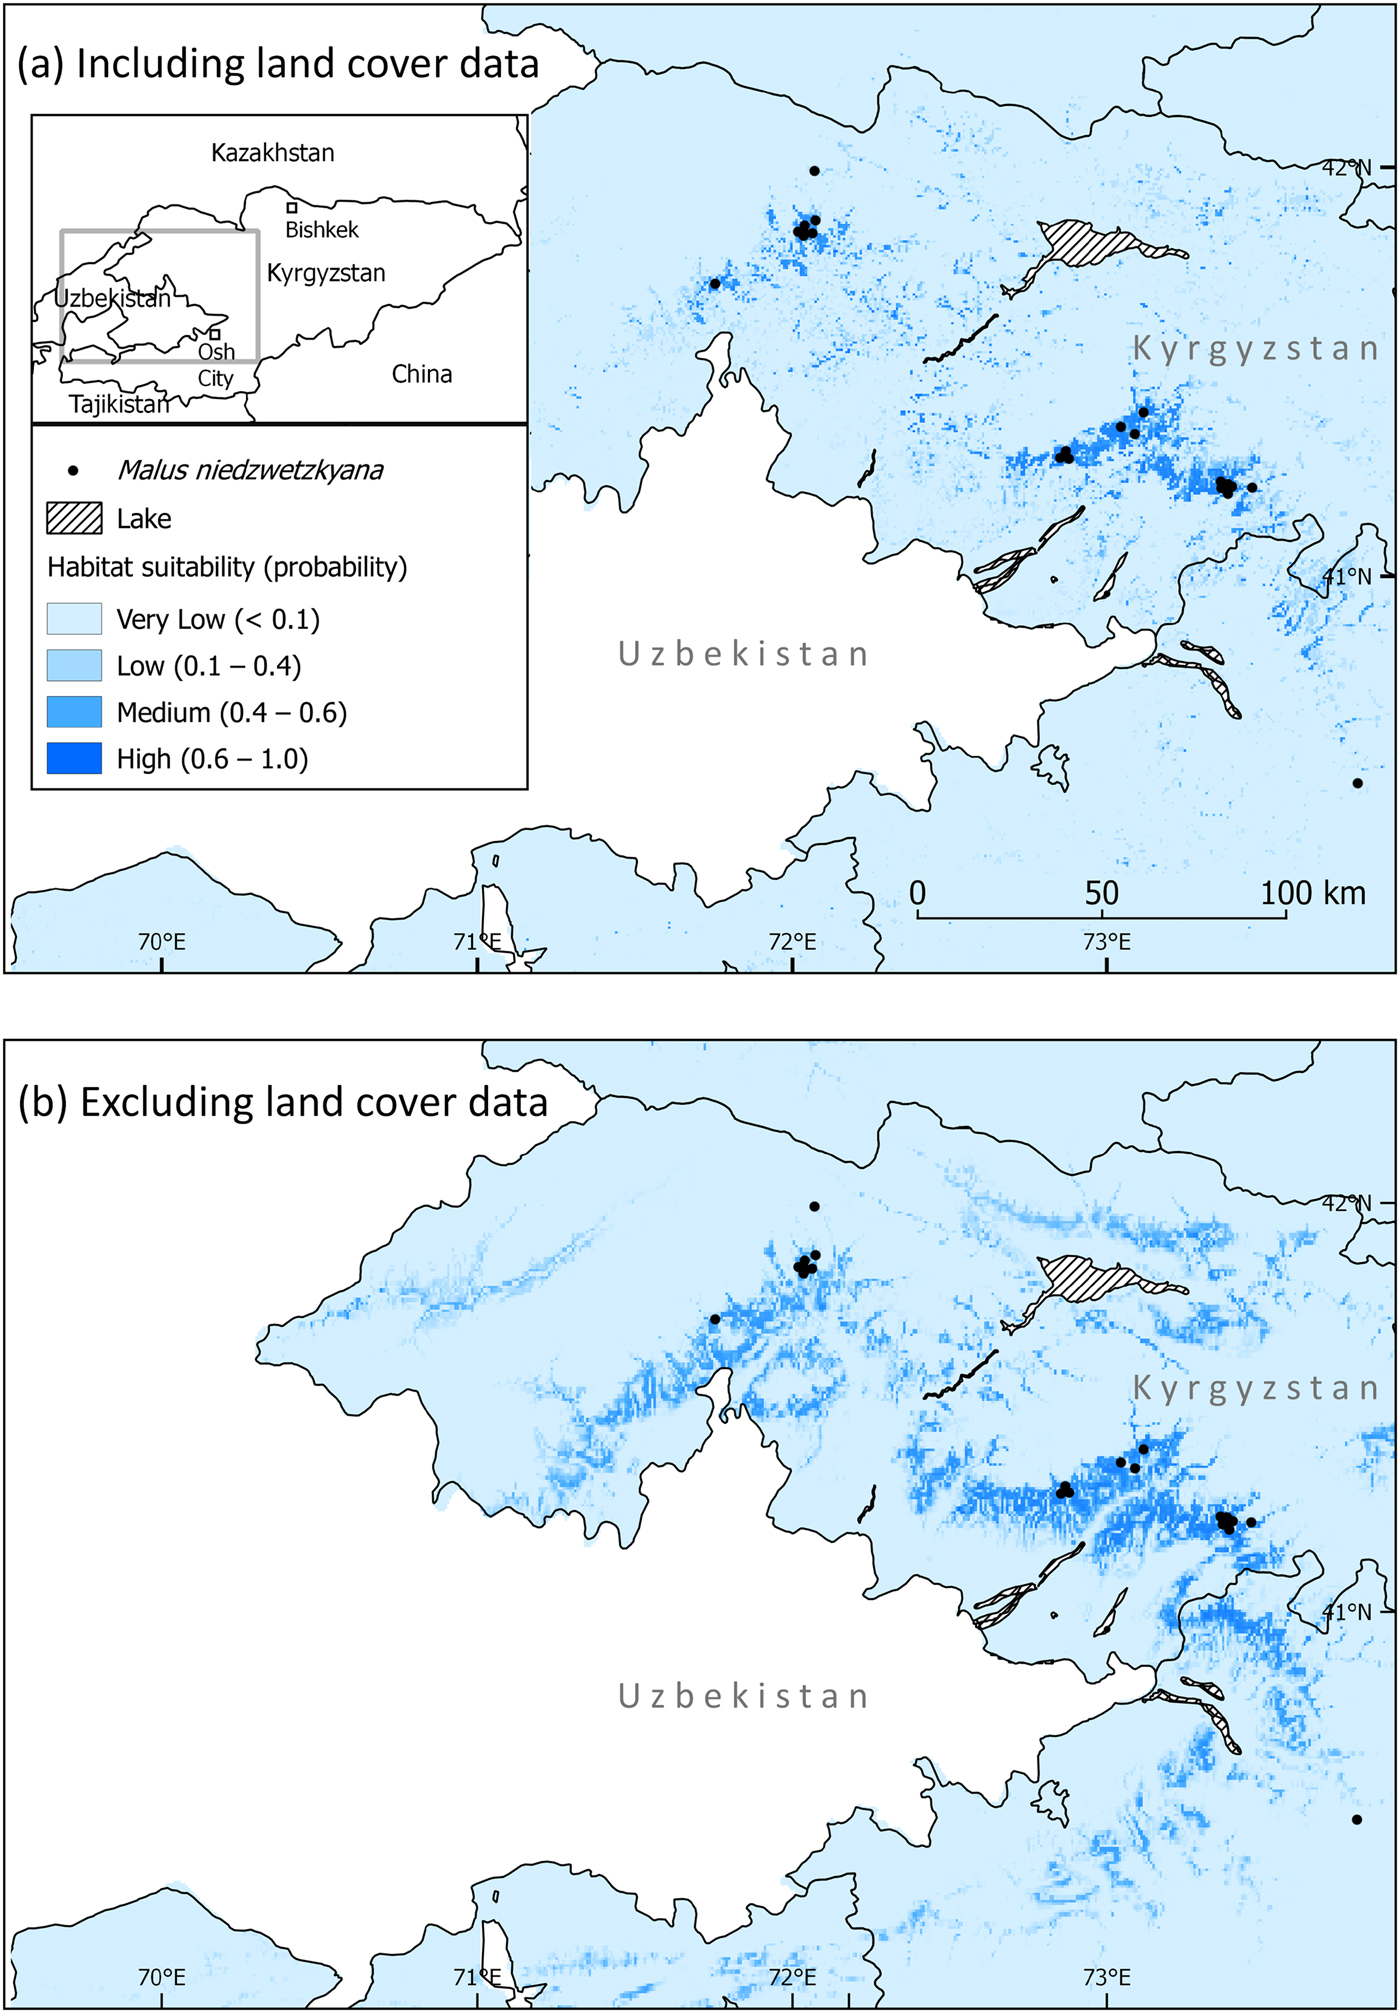
Fig. 2 Predicted suitable habitat for M. niedzwetzkyana in Kyrgyzstan, produced using Maxent software, (a) including land cover data and (b) excluding land cover data.
The Maxent model with global land cover excluded (Fig. 2) was also ‘very good’, with an AUC of 0.942 ± SD 0.034. Visually the range of M. niedzwetzkyana was much broader in the model with land cover excluded. There was no clear single important predictor; isothermality (28.8%), precipitation of the coldest quarter (26.6%), slope (18.2%) and annual mean temperature (16.7%) were all important variables in predicting suitable habitat (Table 1).
Threat assessment
The threat assessment provided information on which sites were least threatened and the distribution of threats across each site. There were significant differences between sites in threat from livestock (χ 2 = 78.002, n = 151, P < 0.001) and firewood collection (χ 2 = 66.645, n = 151, P < 0.001). We scored Sary-Chelek Biosphere Reserve as the least threatened site overall, Kara-Alma as the second least threatened site, and both Dashman and Gava were deemed equally degraded and the two most disturbed sites visited. The ranking of locations based on threat level was the same whether livestock grazing and firewood collection were considered separately or combined in an overall score. Pairwise χ 2 tests revealed that livestock threat was significantly different between all site pairings, except between Dashman and Gava (Table 2), and that variation in firewood collection was significantly different between all site pairings, except between Dashman and Gava, and Dashman and Kara-Alma (Table 2). Firewood collection was a more localized threat than livestock grazing across all sites (χ 2 = 17.077, n = 302, P < 0.01).
Table 2 Statistical comparison between pairs of sites for the threats of firewood collection and livestock grazing, with the χ 2 value, degrees of freedom and probability.

* Significant difference.
There were significant differences in mean undergrowth height between sites (Fig. 3; F 3,147 = 9.902, P < 0.001). A post hoc Tukey HSD test showed there were significant differences between Sary-Chelek and Dashman, Sary-Chelek and Gava, Kara-Alma and Dashman, and Kara-Alma and Gava. Only Kara-Alma and Sary-Chelek, and Dashman and Gava pairings were not significantly different (P > 0.05). This information supports the results of our site ranking recorded in the threat assessment, with Sary-Chelek and Kara-Alma having the highest undergrowth, and Dashman and Gava having equally degraded vegetation.

Fig. 3 Undergrowth height measurements for plots across Dashman, Gava, Kara-Alma, and Sary-Chelek sites. The thick line on the boxplot is the median, the box represents the interquartile range, and the whiskers show the extreme data points within 1.5 × the interquartile range. White dots are data points outside of this range, which are assumed to be outliers.
Malus niedzwetzkyana database
Population structure
The locations of 149 M. niedzwetzkyana individuals were mapped across Kyrgyzstan (Fig. 1) and three subpopulations assessed for regeneration capacity. The DBH distribution of M. niedzwetzkyana at Gava and Kara-Alma showed that many DBH size classes were underrepresented, indicating reduced regeneration capacity. The DBH of the Sary-Chelek population showed a basic inverse J shape and Type I structure (Peters, Reference Peters1994), indicative of a population with some regenerative potential. However, this may be limited because of the low number of individuals in some size classes (Fig. 4).
Fig. 4 Malus niedzwetzkyana population structure for (a) Gava, (b) Sary-Chelek and (c) Kara-Alma sites. Trees with DBH > 10 cm were grouped in size classes of 5 cm increments. Trees with DBH < 10 cm were not included in the analysis because they have not yet survived a single grazing season.
Ecology
The canopy cover of areas with M. niedzwetzkyana was significantly more open than the mean canopy cover in the surrounding landscape (χ 2 = 54.53, n = 273, P < 0.001). Malus niedzwetzkyana grows best where canopy cover is 40–70%. Furthermore, we found a significant difference between the range of aspects found in the landscape and the aspect where M. niedzwetzkyana is growing (χ 2 = 44.227, n = 273, P < 0.001). Most commonly, this tree grows on south-west facing slopes. Some individuals were found on slopes with other aspects, but none on slopes facing north. There was a significant difference between the range of slopes found across the landscape and slope angles where M. niedzwetzkyana is growing (χ 2 = 14.825, n = 273, P < 0.01). Most individuals were found on slopes of 0–30°, evenly distributed across this range.
Discussion
Conservation action for the long-term protection of M. niedzwetzkyana and its habitat is currently limited by a poor evidence base. This study provides evidence that the walnut–fruit forest cover of Kyrgyzstan was once potentially more extensive and that current M. niedzwetzkyana habitat is restricted to a few fragmented forest areas. Most of these are seriously affected by regular firewood collection and livestock grazing; only a few areas in Sary-Chelek and Kara-Alma remain relatively undisturbed. The populations within these fragments are vulnerable to threats and regeneration is limited. We determined that M. niedzwetzkyana is usually located on south-west facing slopes (< 30°) with relatively open canopy cover, which we assume to be its naturally favoured conditions. This information will support the design of a more comprehensive and practical restoration plan for this Endangered tree.
Walnut–fruit forest area is estimated to have declined by 90% in the past 50 years, with agricultural expansion and extensive clear-felling thought to be the driving factors, although little evidence is available to quantify their full impact (Djanibekov et al., Reference Djanibekov, Villamor, Dzhakypbekova, Chamberlain and Xu2016). Today Kyrgyzstan's forest area is relatively stable because these particular threats have declined (Orozumbekov et al., Reference Orozumbekov, Musuraliev, Toktoraliev, Kysanov, Shamshiev and Sultangaziev2009), but localized threats such as grazing still degrade the remaining forest. Our species distribution modelling highlighted that M. niedzwetzkyana occurs in currently forested areas. However, if forest area is ignored and only climatic conditions are considered, the potential species range appears to be considerably greater. Much of this expanded area presently comprises mixed forest or cropland and can, therefore, guide future forest restoration projects. Previously, reforestation has been a key strategy for maintaining forest areas in Kyrgyzstan, with over 16,000 ha reforested during 1998–2003 (Orozumbekov et al., Reference Orozumbekov, Musuraliev, Toktoraliev, Kysanov, Shamshiev and Sultangaziev2009). However, this was done with the aim to increase resource availability and efforts have therefore focused on common, profitable species such as spruce Picea schrenkiana, ignoring rare species such as M. niedzwetzkyana. Our data suggest that reforestation strategies could be broadened to include walnut–fruit forest ecosystems and their constituent species, ensuring the conservation of this iconic landscape whilst also continuing to meet resource needs.
Because M. niedzwetzkyana populations are vulnerable and resources for conservation are limited, it is important to implement cost-effective conservation strategies within the existing forest fragments (Mittermeier et al., Reference Mittermeier, Myers, Thomsen, da Fonseca and Olivieri1998; Bottrill et al., Reference Bottrill, Joseph, Carwardine, Bode, Cook and Game2008). Our findings will help to focus resources to maximize the survival chances of M. niedzwetzkyana. Tall undergrowth and large areas with few or no threats in Sary-Chelek and Kara-Alma indicate that these sites should be the initial focus for conservation work in the region. Both sites provide an environment where known trees can be protected and saplings planted at low cost. In addition, the current management of both sites is highly effective, implying strong community support for conservation in these areas.
In contrast, Dashman and Gava contain extensively damaged tracts of forest, indicating a failing or absent management system. Dashman's status as a Reserve does not reflect the park's current use, and unlike Kara-Alma, the village of Gava's Forestry Unit system is faltering and needs to be revitalized (BW, pers. obs.). There is insufficient capacity within the socio-ecology of these rural villages to reduce resource use and control livestock (Jalilova & Vacik, Reference Jalilova and Vacik2012). External help is needed to provide alternative livelihoods, funding and equipment to promote sustainable practices and conserve these forest ecosystems and the goods and services they provide. Consequently, the potential for large-scale ecological restoration in these extensively damaged areas is limited and community-based methods must be the initial focus. Across all sites, our threat assessment highlights livestock grazing as a greater threat than firewood collection because of the more extensive and less controlled nature of the former. We therefore suggest funding should be targeted initially at measures reducing livestock impact (e.g. temporary fencing), to allow selective grazing and facilitate natural regeneration of trees. This could improve the overall outlook for M. niedzwetzkyana.
We updated the location map for M. niedzwetzkyana (Cantarello et al., Reference Cantarello, Lovegrove, Orozumbekov, Birch, Brouwers and Newton2014; Orozumbekov et al., Reference Orozumbekov, Cantarello and Newton2015) within the sites, adding new individuals and confirming previously recorded locations. The low population density supports findings of previous research, highlighting the continued vulnerability of the species and the importance of existing fragments as population strongholds (Orozumbekov et al., Reference Orozumbekov, Cantarello and Newton2015). Genetic isolation may also become a significant factor in determining the persistence of this species (Young et al., Reference Young, Boyle and Brown1996).
Our study provides more detailed information on populations at specific sites than previous studies (Orozumbekov et al., Reference Orozumbekov, Cantarello and Newton2015). It identifies both Kara-Alma and Gava populations as ageing, with limited regeneration, and shows that only the Sary-Chelek population has some regeneration capacity (but even this is limited by the low number of surviving trees). We conclude that the currently known population is not sustainable without external intervention, providing justification for FFI's planned sapling planting project (Fauna & Flora International, 2018). Moreover, most trees are in areas susceptible to high threat, increasing the vulnerability of these populations.
In addition to the population assessment, the ecological data we collected provides new information about the fundamental niche of this species, suggesting that M. niedzwetzkyana requires open areas of forest to flourish and favours south-west facing slopes of < 30°. This information can guide more effective conservation decision-making, particularly regarding the selection of the most suitable habitat for sapling planting projects.
Our study comprises the first comprehensive assessment of these sites and their threats since Orozumbekov et al. (Reference Orozumbekov, Cantarello and Newton2015) and provides information on historical forest size and the ecology of M. niedzwetzkyana. The population of M. niedzwetzkyana is in a critical state, requiring focused research to target conservation strategies, which need to be site-specific for maximum effect. The walnut–fruit forest ecosystem continues to be utilized heavily, with local threats remaining widespread (Orozumbekov et al., Reference Orozumbekov, Musuraliev, Toktoraliev, Kysanov, Shamshiev and Sultangaziev2009, Reference Orozumbekov, Cantarello and Newton2015). Increasing landscape degradation could result in more landslides and soil erosion, which is already a problem in this region, and reduced resource availability would have negative effects on the rural population. Additional research is needed to assess the accuracy of our models, but consideration should be given to expanding the limited walnut–fruit forest area in line with the increasing recognition of the need for connectivity and reforestation worldwide (Newmark et al., Reference Newmark, Jenkins, Pimm, McNeally and Halley2017).
We have provided evidence to guide conservation decisions, a methodology that other projects could replicate, and established a baseline for long-term monitoring. Our synthesis of broad and local-scale research and the evidence-based conservation approach are critical for effective conservation planning.
Acknowledgements
This work was supported by the Global Trees Campaign. We thank Igor Lysenko, Mick Crawley and Bolot Tagaev for sharing their knowledge on trees and GIS, Bakai Ernazarov for translating during fieldwork, Vicky Wilkins, Victoria Price, Jarkyn Samanchina, and Akylai Kabaeva at Fauna & Flora International for their support and advice throughout the project, and the U.S. Geological Survey for providing the LANDSAT data.
Author contributions
Project design: all authors; fieldwork and data analysis: BW and CC; writing: BW and CC; revisions: all authors.
Conflict of interests
None.
Ethical standards
This research was carried out in accordance with the Oryx Code of Conduct.


