Introduction
Mapping and monitoring species populations is a core component of biogeography, ecology and conservation biology (Fryxell et al., Reference Fryxell, Sinclair and Caughley2014). Thorough species-specific monitoring programmes can be practical for easily surveyed and locally common species, for which extensive efforts have been popularized (e.g. the North American Christmas bird count), or for species for which there are large research or conservation budgets (e.g. the tiger Panthera tigris; Tingley & Beissinger, Reference Tingley and Beissinger2009). However, obtaining data on rare, cryptic, wide-ranging, migratory or nomadic species can be difficult, and consequently there are often large gaps in the knowledge about these species (Good et al., Reference Good, Zjhra and Kremen2006). In fact, 19.3% of all animal species (14.4% of mammals) on the IUCN Red List are categorized as Data Deficient (IUCN, 2015). The paucity of information that defines data-poor species increases their risk of extinction, as population thresholds and opportunities for conservation are likely to be missed (Possingham et al., Reference Possingham, Andelman, Burgman, Medellín, Master and Keith2002). Migratory and nomadic species are an acutely threatened group as a result of widespread habitat loss, fragmentation, fencing and other barriers to movement (Olson et al., Reference Olson, Mueller, Leimgruber, Nicolson, Fuller and Bolortsetseg2009; Struebig et al., Reference Struebig, Wilting, Gaveau, Meijaard and Smith2015). These species are often dependent on ephemeral resources and thus are also particularly affected by changes in phenology or movement routes as a result of climate change (Thuiller et al., Reference Thuiller, Broennimann, Hughes, Alkemade, Midgley and Corsi2006). A transparent, intuitive and objective approach to combine all available types and sources of data could improve range and occupancy mapping for data-poor and wide-ranging species.
There are a variety of sources of presence-only and presence–absence observations (hereafter, occurrence data) that can be used to map a species’ extent of occurrence (EOO), which is a boundary encompassing all known, inferred and projected sites of occurrence of a taxon, and area of occupancy (AOO), which is the habitat area within the EOO occupied by a taxon (Rondinini et al., Reference Rondinini, Wilson, Boitani, Grantham and Possingham2006; Supplementary Fig. S1). Peer-reviewed literature, grey literature reports (e.g. NGO reports) and museum reports have traditionally been the main source of species range mapping (Smith et al., Reference Smith, Santos, Koo, Rowe, Rowe and Patton2013). More recently, citizen science reports in online repositories have increased occurrence data for many charismatic species, and are often accompanied by photographs so that experts can verify species identification. These sets of information may suffer from poor coverage, being presence-only observations, or lacking error rates. Site species inventories are another valuable but underutilized resource to gather presence–absence data. For example, camera-trap studies may target a charismatic mammal such as the tiger, but they often report their full species capture lists (inventories) in supplementary materials, or inventories can be obtained by contacting the authors. However, it can take a long time to identify and archive photographs from these studies, potentially inhibiting their utility for threat assessments (Rondinini et al., Reference Rondinini, Wilson, Boitani, Grantham and Possingham2006). Finally, field researchers and conservation practitioners have current but unpublished knowledge that can be proactively mined for contemporary occurrence information through simple online surveys.
We have developed a transparent and objective approach to integrate disparate data sources efficiently to improve the resolution of historical and current species mapping. We apply this approach to the bearded pig Sus barbatus, a data-poor and threatened nomadic species of significant cultural and ecological importance in South-east Asia. As for many species, the lack of historical and present range and occupancy information has limited the assessment of the bearded pig's conservation status for the IUCN Red List. Although we focus our application on the bearded pig, we describe our approach generally, to facilitate transferability to other species.
Study species and study area
There are two subspecies of bearded pigs in our study region, the Sumatran bearded pig Sus barbatus oi and the Bornean bearded pig Sus barbatus barbatus (Lucchini et al., Reference Lucchini, Meijaard, Diong, Groves and Randi2005); the latter also occurs in Peninsular Malaysia. There have been ad hoc reports of bearded pigs in all forest types and at all elevations, including in swamp and peat forests, lowland and hill rainforests, and montane forests. In Borneo, bearded pigs are the only Suidae present and are considered to be common. They are a keystone bushmeat resource (Bennett et al., Reference Bennett, Nyaoi, Sompud, Robinson and Bennett2000; Janowski, Reference Janowski2014), but they also crop raid and are hunted as pests in oil palm plantations (Luskin et al., Reference Luskin, Christina, Kelley and Potts2014). Bearded pigs are capable of rapid reproduction when resources are available and thus they are thought to be relatively resilient to hunting pressure. Bornean bearded pigs historically made large-scale nomadic movements (> 500 km) to track local mast fruiting but details of their routes and timing of movements remain largely unknown, and it is unclear, given habitat fragmentation, if they continue to make such movements (reviewed in Luskin & Ke, Reference Luskin, Ke, Melletti and Meijaard2017).
Much less is known about bearded pigs in Sumatra and Peninsular Malaysia, but they compete with the sympatric and abundant wild boar Sus scrofa in these regions (Linkie & Sadikin, Reference Linkie and Sadikin2003). In Peninsular Malaysia, bearded pigs have been considered to be rare for at least 50 years, and there are reports of large sounders moving between the south-east and south-west coasts annually, and of bearded pigs being hunted by Chinese plantation owners. Whether bearded pigs make large-scale movements in Sumatra has never been assessed, and hunting of the species is considered to be minimal on the island (Luskin et al., Reference Luskin, Christina, Kelley and Potts2014).
Bearded pigs were evaluated as a single species and categorized as Vulnerable on the IUCN Red List in 2008 (Kawanishi et al., Reference Kawanishi, Gumal and Oliver2008). However, there are no robust analyses showing range contractions or declining population sizes, nor evaluation of the differing subspecies.
Methods
Obtaining occurrence data
To gather all available occurrence data for bearded pigs, we compiled information in four phases:
Phase 1 Existing data
(1) Literature review: We conducted a systematic search in Web of Science, Google Scholar and Google for publications, grey literature and websites containing information on the occurrence of bearded pigs (presence or absence). We used the search terms ‘bearded pig’, ‘Sus barbatus’ and ‘babi jenggot’ (the Bahasa Malay/Indonesia name). We also searched through all issues of Suiform Soundings, the newsletter of the IUCN/SSC specialist groups for wild pigs, peccaries and hippopotamuses, and examined all references therein. (2) Museum records: To compile historical records, we searched the Global Biodiversity Information Facility database (GBIF, 2016), a global repository of biodiversity data. (3) Citizen science: We searched through international citizen science databases (GBIF, 2016; Naturewatch Foundation, 2016; Wildscreen Arkive, 2016) for sightings that included a photograph we could confirm as a bearded pig.
Phase 2 Species inventories
We compiled all available species inventories from camera-trap studies in Indonesia, Malaysia or Singapore through an extensive search of peer-reviewed and NGO publications.
Phase 3 Expert surveys
To collect information from field researchers and conservation practitioners, the coordinators of the IUCN Asian Wild Pig Specialist Group, M. Linkie and E. Meijaard, emailed an online survey (the IUCN Asian Wild Pig Challenge) to colleagues in the group on 15 June 2015. Recipients were asked for the following information: name and coordinates of their study site, the pig species that are/were present, and whether or not the pig species are currently present. They were also asked to forward the survey to colleagues who could add reliable information.
Phase 4 Fieldwork
To clarify the range limit of bearded pigs in Sumatra we conducted an intensive 3-month survey in three of Sumatra's UNESCO World Heritage Site forests (Kerinci Seblat, Gunung Leuser and Bukit Barisan Selatan National Parks) in 2013–2014 (Fig. 1, Table 1). To assess seasonal movements, we left 20 cameras active in Kerinci Seblat during March–September 2014.
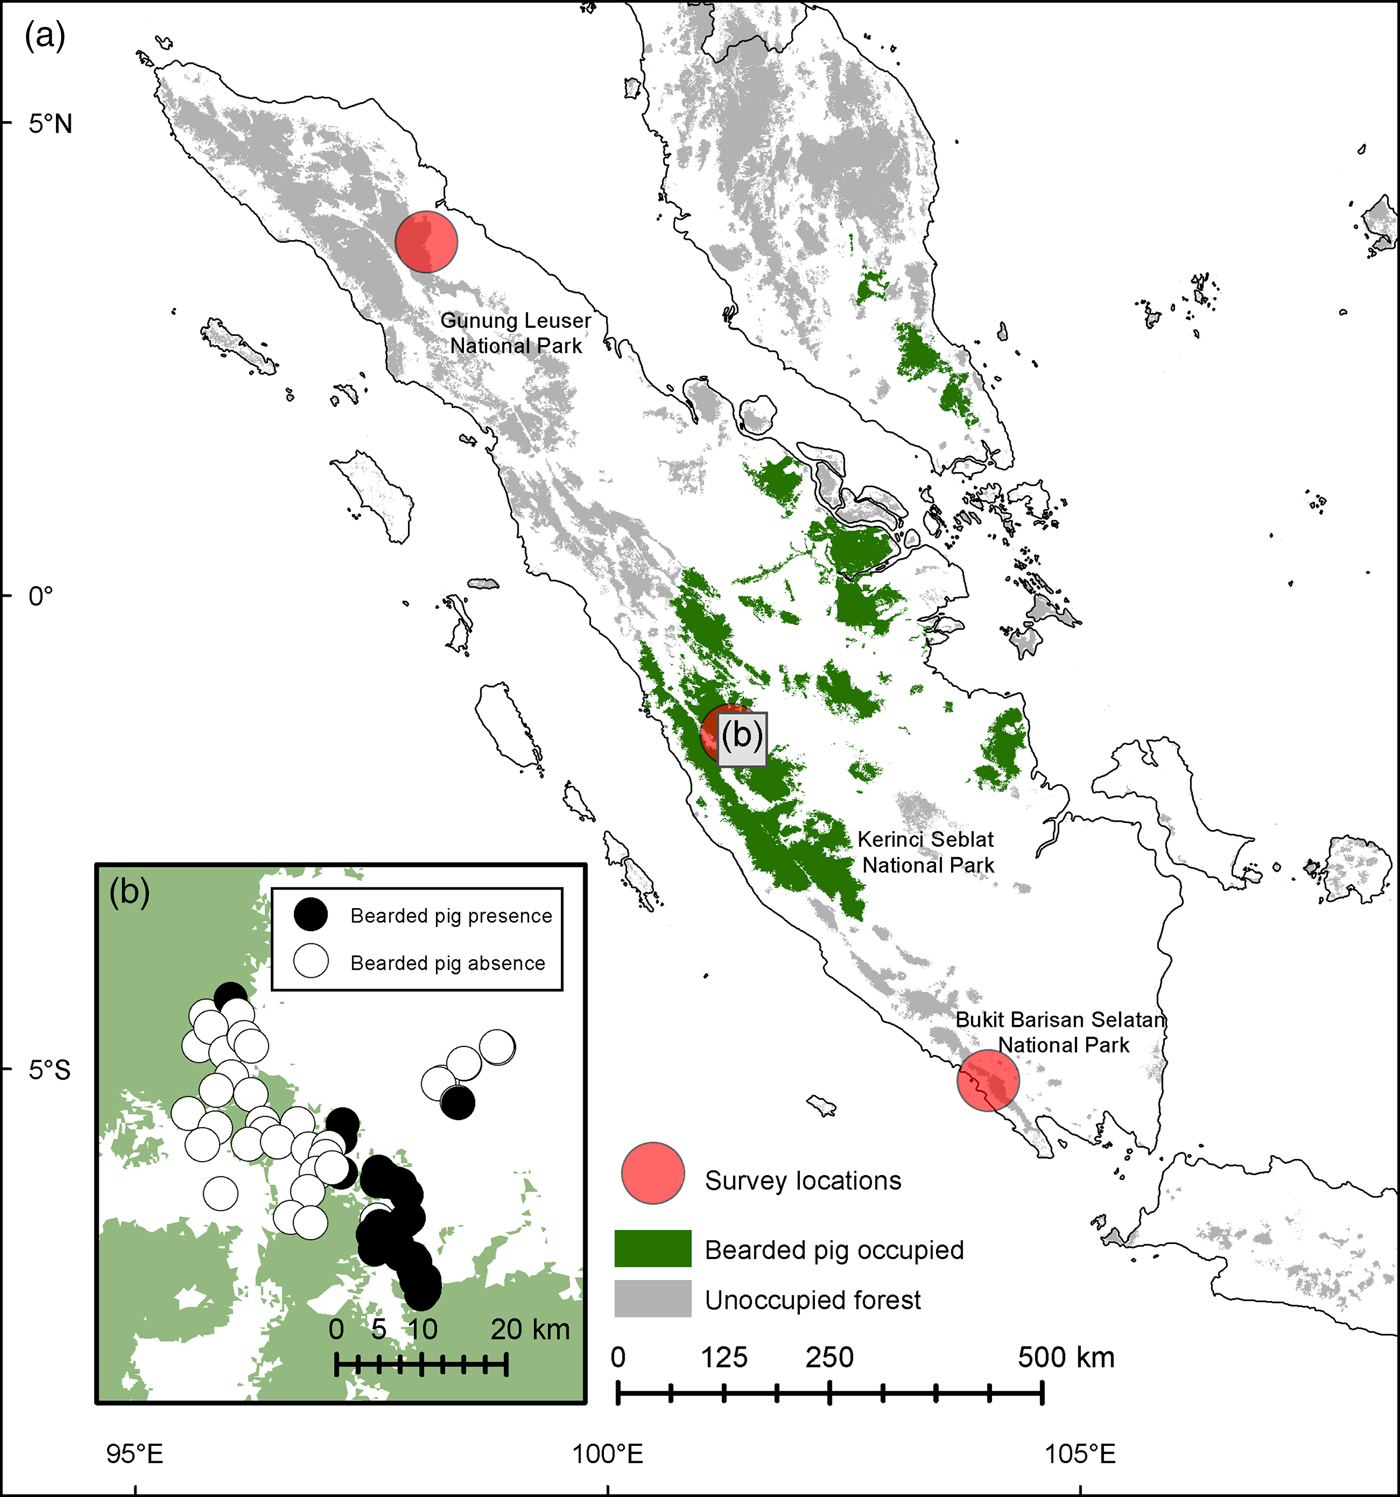
Fig. 1 (a) Locations of camera-trap surveys of the bearded pig Sus barbatus in Sumatra: Gunung Leuser, Kerinci Seblat and Bukit Barisan Selatan National Parks. (b) Presence and absence records of bearded pigs at 75 camera stations within Kerinci Seblat National Park and in nearby forest fragments.
Table 1 Characteristics of the study sites in Gunung Leuser, Kerinci Seblat and Bukit Barisan Selatan National Parks in Sumatra (Fig. 1), with details of the camera-trap surveys conducted in 2013 and 2014. Twenty cameras were left at Kerinci Seblat during March–September 2014.
Collating data
For each record of bearded pigs we collected the global positioning system coordinates for the site and the year of observation. Given the wide-ranging behaviour of bearded pigs, we attributed occurrences to entire areas of continuous forest when specific coordinates were not provided. We acknowledge the potential for double-counting if the same sighting is reported in multiple data types (e.g. a sighting that is reported in the peer-reviewed literature and is also recorded in the GBIF).
Habitat mapping
We considered any type of forest to be suitable habitat because bearded pigs are habitat generalists. We mapped 2010 forest cover using 1 × 1 km resolution land cover data from Miettinen et al. (Reference Miettinen, Shi and Liew2011). We mapped 1980–1990 forest cover from three different sources because a single suitable map was unavailable. For Borneo we used the 1985 2 × 2 km resolution map from Nellemann (Reference Nellemann2007), for Sumatra we used the 1990 4 × 4 km resolution map from Margono et al. (Reference Margono, Turubanova, Zhuravleva, Potapov, Tyukavina and Baccini2012), and for Peninsular Malaysia we used the 1981 1 × 1 km resolution map from Brown et al. (Reference Brown, Iverson, Lugo and Dale1994). Historical forest cover in all three regions included intact and degraded forest but excluded agricultural land and tree plantations. Historical maps were digitized in ArcGIS v. 10.3.1 (ESRI, Redlands, USA) and checked for errors using specific coordinates of known features. We calculated forest cover change for each time period by subtracting 2010 forest polygons from the earlier maps. Resampling the Sumatran and Peninsular Malaysian maps to the same resolution was not necessary because this error represents a negligible component of the vast changes in forest cover that have occurred.
EOO and AOO mapping
We adhered to the IUCN guidelines by using known, inferred, and projected sites of present occurrence along with habitat maps to estimate the EOO and AOO of the bearded pig (IUCN Standards and Petitions Subcommittee, 2016). Using minimum bounding geometries and habitat maps to estimate EOO and AOO is common practice in mapping the ranges of data-deficient species and is a standard method used in IUCN assessments (e.g. Good et al., Reference Good, Zjhra and Kremen2006; Randrianambinina et al., Reference Randrianambinina, Rasoloharijaona, Rakotondravony, Zimmermann and Radespiel2010). In making assessments for the IUCN Red List we focused on AOO because it captures range loss more effectively than EOO. Our species and sub-species recommendations to the IUCN were based on inferred population declines resulting from contracting AOO.
Minimum convex polygons and species distribution modelling
There are two general approaches to using occurrence data to map the ranges and patch occupancy of data-deficient species. The first is to map the known recent occurrences directly, but this approach may leave large gaps for species with few observations. Species distribution modelling can fill in such gaps by linking occurrence data to habitat covariates, then using those relationships to infer occupancy in areas without observations, based on land cover maps. Species distribution modelling is appropriate for habitat specialists that may be rare across the landscape but are usually present within their specific habitat (Mueller et al., Reference Mueller, Olson, Fuller, Schaller, Murray and Leimgruber2008; Runge et al., Reference Runge, Tulloch, Hammill, Possingham and Fuller2015). However, it is susceptible to over-predicting the range and occupancy of species that are range restricted or distributed patchily within their narrow extent of suitable habitat (Elith & Leathwick, Reference Elith and Leathwick2009). In particular, for mobile, migratory or nomadic species, species distribution modelling may not be informative when occurrence data are collected during movements through unsuitable habitats (e.g. migratory songbirds flying over water bodies or cities). We recorded bearded pigs in all types and sizes of forest, across all elevations; as a result, when we first attempted to implement species distribution modelling the results suggested bearded pigs were present in all remaining forests of Malaysia, Singapore, Sumatra and Borneo, which we know to be false, especially in Sumatra. We therefore concluded that species distribution modelling had vastly overestimated occupancy and was not ideal for our purposes.
Instead, we mapped EOO as minimum convex polygons (MCPs) around all presences for each region, and AOO as the forest area within the EOO, subtracting areas where only absences were recorded. We mapped the EOO in 1980–1990 and in 2010 by applying MCPs to presence localities within those time periods. To estimate AOO we overlapped the EOO with suitable habitat (any type of forest), and wherever the MCP intersected a forest polygon we included the entire continuous forest patch in which presence was recorded, to accommodate the fact that bearded pigs move large distances.
For 1980–1990 we created independent MCPs for the populations of bearded pigs in Borneo, Sumatra and Peninsular Malaysia, using all 185 unique presence data points. There were no absence reports before 1990, so for the initial map we considered the AOO to comprise all forested areas within the EOO. For the 2010 map we used only presence localities recorded during 2000–2015. We also mapped EOO and AOO for each data source independently (Supplementary Fig. S2) and then combined them in a stepwise order to assess the contribution of each data type to the final distribution maps for both study periods (Supplementary Fig. S3). To infer a threat level for each region, we compared results from various time periods to evaluate changes in EOO and AOO.
Assessing data quality
Absences are more appropriately termed pseudo-absences: they could indicate true absence, presence not being recorded (imperfect detectability), or a temporary absence during the study period, which is especially likely for bearded pigs as they may use a habitat only once every few years, given their nomadic movements (Luskin & Ke, Reference Luskin, Ke, Melletti and Meijaard2017). Robust procedures to account for detection probabilities and survey effort vs true occupancy are possible only when there are repeated surveys (e.g. site-occupancy distribution modelling; Kery et al., Reference Kéry, Gardner and Monnerat2010). There was an insufficient number of camera-trapping data sets as opposed to species inventories to perform a multi-site occupancy analysis (e.g. such as that presented for tapirs Tapirus indicus in Linkie et al., Reference Linkie, Guillera-Arroita, Smith, Ario, Bertagnolio and Cheong2013), and bearded pigs violate the occupancy model assumptions of population closure by their large movements. We adopted a conservative estimate of range contraction by considering any absence reports to be overridden by presence reports in the same forest in the same time period (± 5 years; Senyatso et al., Reference Senyatso, Collar and Dolman2013).
We inferred higher confidence in occupancy mapping when there were multiple presence reports from various data types, as this increases the probability that an area was truly occupied. We mapped this confidence as the overlap in separate maps created using the unique sets of observations from each data type. For example, where the AOO map created using only citizen science data points overlaps with the AOO map created using only published literature we have more confidence in the occupancy of those forests by bearded pigs, and more confidence that citizen scientist photographs were being geolocated correctly.
Camera-trapping
The presence of bearded pigs in Sumatra's northern or southern forested regions would greatly expand the species’ total range and reduce the level of threat to the sub-species Sus barbatus oi. However, conflicting or unclear locations in historical reports introduced uncertainty for these regions (e.g. Wallace, Reference Wallace1869). As such, any error in mapping this part of the potential EOO would have significant implications. We therefore conducted a camera-trap survey involving > 4,000 trap days in key forested areas of northern and southern Sumatra (Table 1). We used passive infrared camera traps set across areas of c. 500 km2 in Gunung Leuser, Kerinci Seblat and Bukit Barisan Selatan to collect information on a variety of wildlife species. We deployed 90–100 cameras for a 2–3 month intensive survey in each park (Table 1). Cameras were placed within pre-mapped 1.5 × 1.5 km grids, and all cameras were spaced > 1 km apart except in three fragments and standardized between deployment between teams (i.e. all cameras were placed along ridgeline wildlife trails at elevations of 50–1,200 m). Camera surveying was conducted at distances of 0–15 km from forest edges into forest interiors, as well as in 11 forest fragments remaining in the converted landscapes (Table 1).
Test of nomadic movements
A critical factor in interpreting the AOO of bearded pigs is whether they make large-scale movements in search of seasonal and inter-annual fruiting (Wich & Schaik, Reference Wich and Van Schaik2000). To test the hypothesis that bearded pigs are nomadic, we left cameras in north-eastern Kerinci Seblat National Park, a known stronghold in central Sumatra that is believed to have the largest remaining population of Sumatran bearded pigs (Linkie & Sadikin, Reference Linkie and Sadikin2003), for 6 months (March–September 2014). We calculated bearded pig capture frequencies for each camera station as independent events per 100 camera days, defining an independent event as a photograph taken at least 30 minutes after a photograph of the same species at the same camera station. If abundance was consistent for 6 months or showed temporary or non-directional changes, this would support the idea that bearded pigs are sedentary or move locally (< 500 km2). If bearded pigs were common only during a single time period, or never, this would support the hypothesis that bearded pigs are nomadic or migratory across areas > 500 km2. Evidence of both movement states would support the hypothesis that there are populations with distinct movement strategies co-occurring in Kerinci Seblat.
Results
We collected 240 unique records (77% presences and 23% absences) from all data sources combined (Table 2; Fig. 2). The literature review accounted for 59% of the data points (142), followed by the survey of experts (47) and species inventories (34), which were all from camera-trap studies (Fig. 3). Absences were primarily reported in Peninsular Malaysia and Sumatra, and Borneo's single absence report was overridden by presence reports. Occurrence data from before 2000 came primarily from our literature review (41 localities), species inventories were concentrated in the 2000–2010 period, and the 2015 survey of experts provided the most recent data (Fig. 3). Data points from near-shore islands did not occur after 1940. Museum records and citizen science provided a small number of presence-only points that were clustered in tourist areas. The data points from the literature review and species inventories overlapped substantially, for two reasons: (1) if bearded pigs were mentioned in an article and in the species inventory, they would be included in both categories, and (2) scientists tend to conduct a variety of studies in the same locations, such as National Parks, where there also tends to be both research and tourist infrastructure (e.g. roads, field stations, nearby accommodation). The online survey of experts contributed the most recent information and filled in many gaps (47 unique localities).
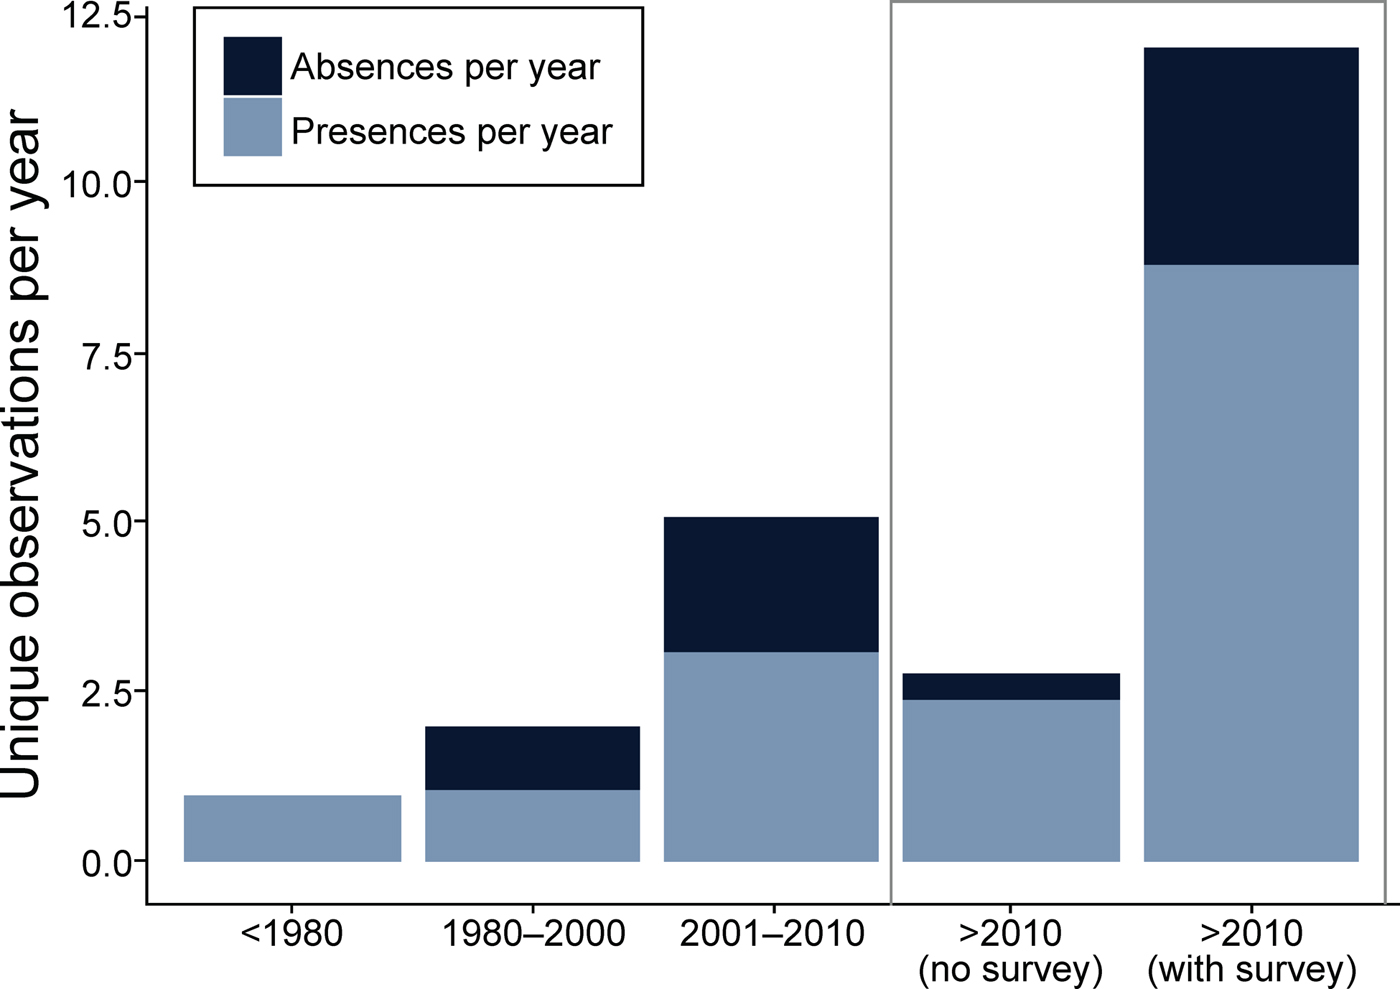
Fig. 2 Presence/absence reports of bearded pigs during four time periods: 1800–1980, 1980–2000, 2001–2010, and 2010-2016.
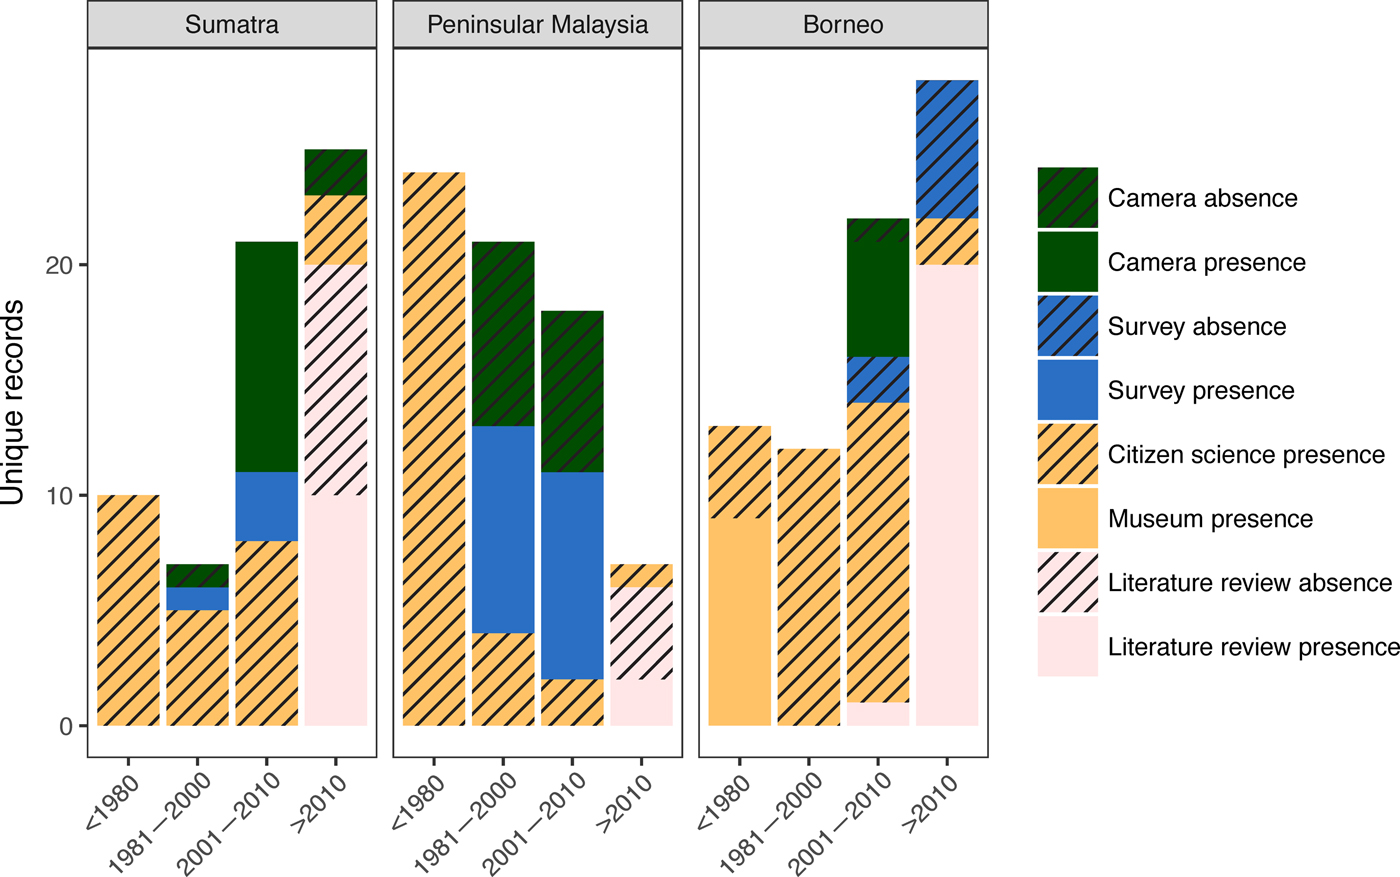
Fig. 3 Unique records of bearded pigs in Sumatra, Peninsular Malaysia and Borneo during four time periods: 1800–1980, 1980–2000, 2001–2010 and 2010-2016. Camera refers to camera-trapping studies, and survey refers to an online survey of members of the IUCN Pig Specialist group.
Table 2 Bearded pig Sus barbatus occurrence data points by source and region.
Verifying data
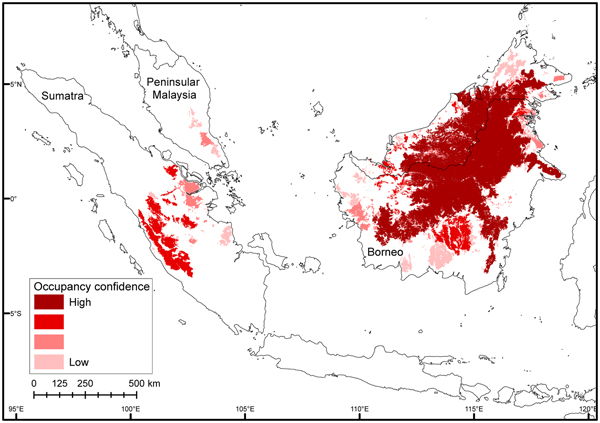
As bearded pigs occur in all forest habitat types, species distribution modelling incorrectly indicated that bearded pigs are present across all forested areas of Sumatra and Peninsular Malaysia. Furthermore, species distribution modelling maps produced a sampling artefact that AOO contraction was equal to deforestation. In contrast, our method of mapping AOO using MCPs and assessing confidence using a heat map (Fig. 4) correctly showed high confidence in the known core areas of central Borneo and Kerinci Seblat National Park in Sumatra, and little confidence in Sumatra's eastern lowlands and Peninsular Malaysia. There were outlier data points (> 200 km from any other point) for the northernmost and southernmost range limits in Sumatra. These were in Gunung Leuser and Bukit Barisan Selatan National Parks, respectively. We investigated these by contacting the museum curator holding the northernmost specimen and confirmed it had incorrect locality data, which we updated. A photograph from Bukit Barisan Selatan was suspected to be of a wild boar. Nonetheless, we conducted fieldwork in Bukit Barisan Selatan to confirm the southern range limit.

Fig. 4 Occupancy confidence heat map for bearded pigs in Sumatra, Peninsular Malaysia, and Borneo in 2015. We created separate AOO range maps using various data sources and then evaluated the extent to which their areas overlapped (see text for details), as indicated by darker shades.
Fieldwork survey results
We did not record bearded pigs in Gunung Leuser or Bukit Barisan Selatan National Parks during 3,531 and 5,759 trap nights, respectively (Table 1). At Kerinci Seblat National Park in central-west Sumatra, bearded pig occupancy was highly variable in space and time within the 813 km2 study area (MCP around camera grid). Bearded pigs were captured by cameras on 435 days in an area of continuous primary forest but were absent from a large logged and fragmented area (Tandai forest in the centre of Fig. 1b) and were captured only once in a region > 10 km away (Fig. 1b). Bearded pigs were also rarely present in small forest fragments within oil palm plantations. Bearded pigs were present in the study area in all study months but capture rates were twice has high in April and May compared to other months (mean 16.2 vs 4.1 photographs per 100 trap nights, respectively, P = 0.0096; Fig. 5).
Fig. 5 Mean monthly capture rates of bearded pigs Sus barbatus oi across the central portion (813 km2) of Kerinci Seblat National Park (Fig. 1) during March–September 2014, indicating population-level migratory or nomadic movements.
Range contraction
The total potential suitable habitat (forest cover) for the bearded pig decreased by 37% and the total forest area occupied by bearded pigs by 44% between 1980–1990 and 2010 (Supplementary Fig. S4; Supplementary Table S2). The Sumatran bearded pig lost 62% of its potential forest habitat during 1990–2010 and its occupied forest area declined by 76%. The Bornean bearded pig in Peninsular Malaysia lost 33% of its potential habitat and its AOO declined 93% during 1981–2010. The Bornean bearded pig in Borneo lost 23% of its potential habitat and its AOO declined 24% during 1985–2010. There have been no confirmed reports of bearded pigs on small near-shore islands for > 50 years, indicating that they were extirpated from most (if not all) prior to 1980, and therefore we excluded these islands from the area calculations.
Occurrence reports from the online survey expanded the total AOO for 2010 by 5% compared to the baseline area identified in the literature review (Supplementary Fig. S2). The museum records and new fieldwork did not contribute to expanding the 2010 range but provided important information about the historical range (e.g. the northern extent in Sumatra). Citizen science data were from only a few tourist areas in Borneo (e.g. Bako National Park) and contributed to only a slight increase in the 2010 AOO.
Discussion
Evaluating changes in the distributions of data deficient species remains a challenge. We have described a straightforward, transparent and objective approach to mapping historical and current distributions by combining a variety of data types and assessing confidence through their overlap. This is directly transferable to the IUCN approach to assessing EOO (i.e. range) and AOO, as we have illustrated using this case study of bearded pigs. Historical maps were based primarily on the published literature and museum records. Species inventories from camera-trap studies added reliable presence–absence data, and an online survey of experts was conducted to obtain the most recent occurrence information. By combining data types we were able to quantitatively assess changes in the bearded pig's EOO and AOO in three regions (Borneo, Sumatra and Peninsular Malaysia) over two time periods (1980–1990 and 2010). Utilizing the survey of experts, species inventories, and citizen science increased the contemporary AOO by 6.3% compared to that mapped using only the literature review (Supplementary Table S1; Supplementary Fig. S2). The overlap between various data sources provided a measure of confidence in our maps that facilitated a robust assessment for the IUCN Red List.
We note an important shift in the relative value of various data types through time. Species inventories from camera-trapping provided the most abundant observations for 2000–2010, whereas expert surveys were the most important data source post 2010. Online citizen science reports became available after 2005 (Goodchild, Reference Goodchild2007); however, they have provided few observations and poor coverage. Targeted fieldwork has been useful for obtaining recent data for previously data-poor areas and verifying contested areas.
In addition to the time-specific value of various data sources, the overlap of observations between sources provided a transparent and quantitative measure of our confidence in both the reporting and the resulting maps. The AOO confidence heat map created by overlaying MCPs using various data sources matched and refined what experts had considered to be the core robust AOO of bearded pigs in each region (E. Meijaard, M. Linkie, pers. comms). The AOO confidence heat map also accurately represents our lack of confidence for many of the smaller forest patches at the edges of range distributions.
Range and occupancy mapping vs modelling
Our results suggest species distribution modelling or combined occupancy modelling approaches are problematic for data-poor nomadic species such as the bearded pig because they require sufficient training data and habitat relationships. For example, the absence of bearded pigs from northern Sumatra (e.g. Gunung Leuser National Park and Ulu Masen), southern Sumatra (e.g. Bukit Barisan Selatan National Park) and central Peninsular Malaysia (e.g. Taman Negara) cannot be explained by known habitat variables. Likewise, even a detailed year-long ecological study would be insufficient to identify the full set of suitable habitats because bearded pigs make large inter-annual movements to disparate habitat types in search of food, corresponding to local phenology and regional masting cycles (Luskin & Ke, Reference Luskin, Ke, Melletti and Meijaard2017; Fig. 6). Even our extended, detailed fieldwork campaign at Kerinci Seblat National Park in Sumatra provided few insights: although captures of bearded pigs varied greatly through time, they were present in the study area during all 6 months and in all habitat types. This indicates that there are some resident pigs, or possibly different movement patterns between subpopulations. This additional limited ecological information did not improve our ability to conduct species distribution modelling but came at significant economic and logistical costs (USD 50,000 and 12 people working for 1 year).
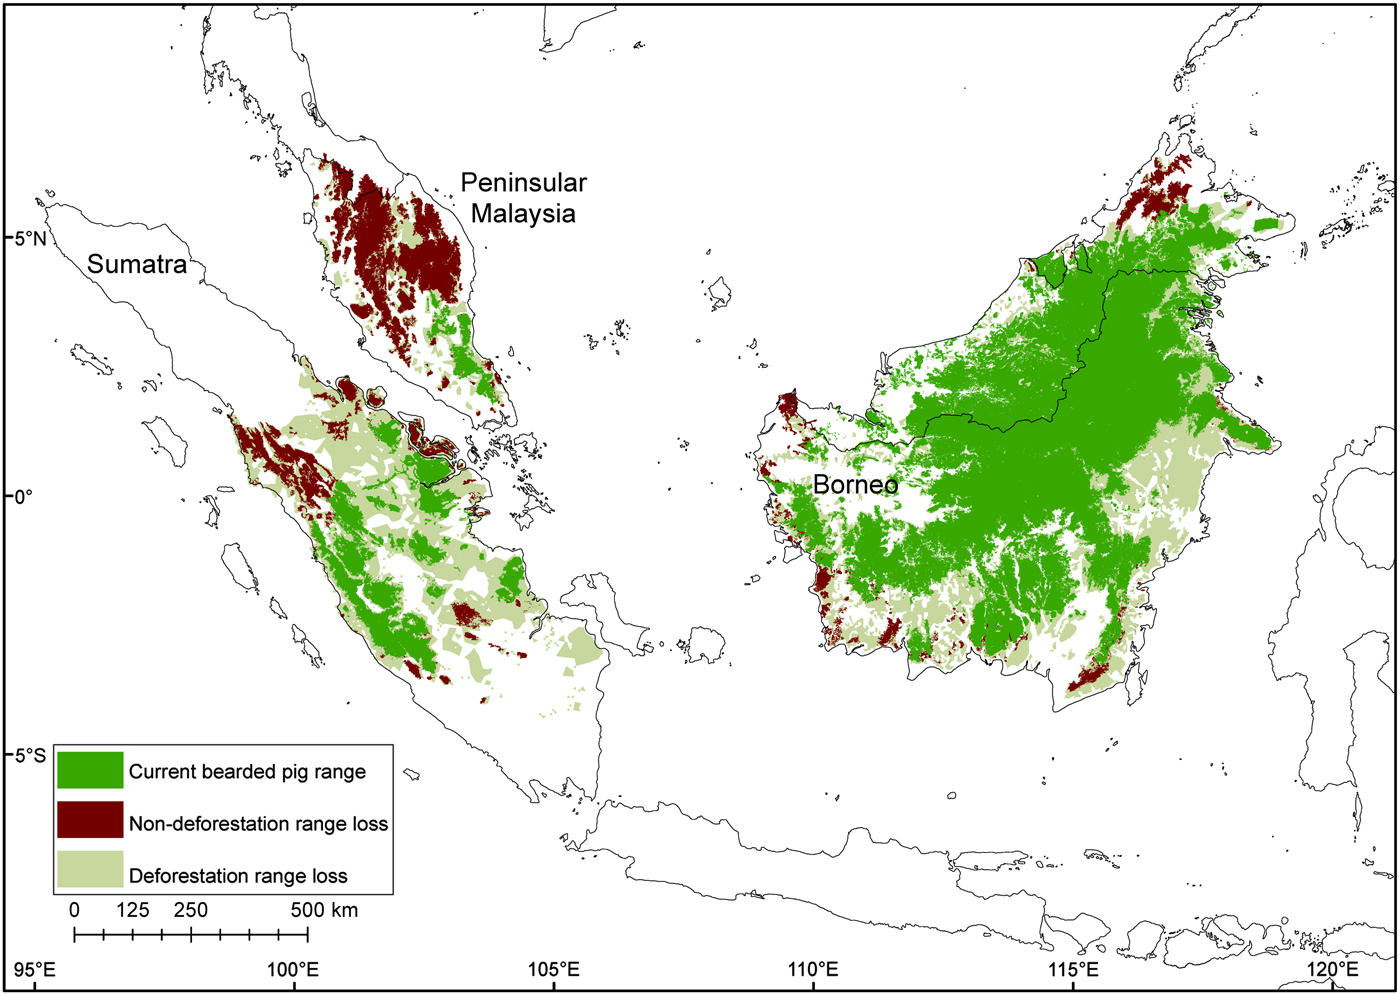
Fig. 6 Contraction of the bearded pig's range in Sumatra, Peninsular Malaysia and Borneo during 1980–2010, mapped using all data sources.
Limitations of the pooled occurrence data approach
To minimize Type II omission errors in the AOO, in which a habitat polygon containing the species is not included, we took a conservative approach by including all forest habitats within the MCP around all occurrences in each region (the EOO) unless they contained only absences. This may be important for small fragments within the EOO MCP that are unlikely to have extant populations. We chose this approach for bearded pigs because their wide habitat tolerance and large movements over long time scales makes it likely that they occasionally use many smaller habitat patches. For the same reason, we included the entire area of continuous habitat containing any presence, but this may have overestimated AOO when a presence occurred in a large habitat polygon that was only partially occupied. Likewise, our approach may overestimate AOO when absences are underreported, such as in museum and citizen science data (usually presence-only records). However, no absences in our case study reduced the AOO because all were offset with presences in the same forest in the same time period.
Nomadic species pose particular difficulties for mapping. Our approach of pooling occurrences over time probably overestimates the AOO of a nomadic species at any particular point in time or year, but it is useful for a longer term conservation perspective (Runge et al., Reference Runge, Tulloch, Hammill, Possingham and Fuller2015). In the case of bearded pigs, particularly for some boom-and-bust nomadic subpopulations in Borneo, they may occupy a small fraction of their decadal AOO at any single point in time, depending on the local inter-annual masting cycles. Thus, threat assessments for nomadic species inferred by AOO should use longer periods for collating occurrence data.
Conservation implications
Although it is preferable to have data on both habitat loss trends and population parameters, conservation assessments for data-deficient species can be made based on habitat and/or range loss (IUCN, 2015). Based on this study, we have advised that the Sumatran bearded pig S. barbatus oi should be recategorized as Endangered (based on criterion A2c) on the IUCN Red List, primarily because of a 76% contraction of its AOO. Kerinci Seblat National Park is probably the only remaining forest large enough to sustain the Sumatran bearded pig for the foreseeable future. However, Kerinci Seblat is threatened by forest loss as a result of oil palm expansion, fragmentation, and isolation of remaining populations (Brodie, Reference Brodie2016; Joshi et al., Reference Joshi, Dinerstein, Wikramanayake, Anderson, Olson and Jones2016). Our results indicate that bearded pigs enter oil palm plantations close to Kerinci Seblat, and oil palm fruit resources may be important for maintaining populations between mast fruiting episodes (Luskin & Potts, Reference Luskin and Potts2011). The use of farmland is also commonly observed in many other species and locations when natural resources decline (Luskin, Reference Luskin2010). However, the increasing abundance of plantation-tolerant competitors, namely the wild boar, could lead to competitive exclusion in forest edges and fragmented landscapes (Luskin et al., Reference Luskin, Christina, Kelley and Potts2014).
The bearded pig subpopulation in Peninsular Malaysia is at high risk of extinction because its AOO contracted 94% between 1981 and 2010. However, because the Peninsular Malaysia and Borneo populations are the same subspecies, S. barbatus barbatus, we suggest that they remain categorized as Vulnerable on the IUCN Red List. The Borneo population is widespread in remaining forests, possibly because there is more contiguous forest and no interspecific competition from wild boar. Nonetheless, the population is threatened by habitat loss of > 20%, fragmentation that hinders long-distance movements, and intense hunting.
The mapping approach we used is broadly applicable for other data-poor species, particularly those that are unsuitable for species distribution modelling. By evaluating EOO and AOO for multiple time periods, our approach can also be used to assess the status of species currently categorized as Data Deficient. In particular, we suggest collating camera-trap inventories and expert surveys for assessing the range and population status of terrestrial mammals.
Acknowledgements
This work was supported with funding from ZGAP (Zoologische Gesellschaft für Arten- und Populationsschutz; project code: 1.Sus barbatus.IDN.2014), the National Geographic Society Committee for Research and Exploration (#9384-13), the Los Angeles Zoo and Botanical Gardens and Greater Los Angeles Zoo Association, and a USA–Indonesia Fulbright award to MSL. We thank Matthew Linkie and Erik Meijaard for ongoing support, and Matthew Potts, Lisa Kelley, David Kurz and Brad Balukjian for comments that improved the article. Wido R. Albert was instrumental to completing the camera-trapping fieldwork. We also thank two anonymous reviewers whose comments greatly improved this article.
Author contributions
ML conceived the project, and AK produced the maps. Both authors collected and analysed the data and wrote the article, and both contributed equally to the work.
Biographical sketches
Alison Ke has broad interests in human impacts on biodiversity and population modelling. Matthew Scott Luskin has interests in tropical forest community ecology. His research examines the cascading impacts of land-use change and hunting on wildlife and forest trees, with a geographical focus on South-east Asia.