


Introduction
Lao People's Democratic Republic may be a core conservation area for the Asiatic black bear Ursus thibetanus and sun bear Helarctos malayanus. Compared with neighbouring countries, Lao has low human density (29 people/km2), large areas of intact tropical forest, and extensive protected areas (Robichaud et al., Reference Robichaud, Marsh, Southammakoth and Khounthikoummane2001; Johnson et al., Reference Johnson, Goodrich, Hansel, Rasphone, Saypanya and Vongkhamheng2016). However, bears in Lao are threatened by poaching and habitat loss. Hunting bears is prohibited nationally and throughout most of South-east Asia, but poor law enforcement capacity coupled with the high value of bear gall bladders, paws and cubs creates a high incentive for poaching (Nooren & Claridge, Reference Nooren and Claridge2001; Scotson & Brocklehurst, Reference Scotson and Brocklehurst2013). Commercial trade of Asian bears is considered one of the biggest threats to wild populations, with trade occurring domestically and internationally with China, Thailand and Viet Nam (Foley et al., Reference Foley, Stengel and Shepherd2011; Garshelis & Steinmetz, Reference Garshelis and Steinmetz2016; Scotson et al., Reference Scotson, Fredriksson, Augeri, Chea, Ngoprasert and Wong2017a). Asian bears are also threatened by high rates of deforestation (Sodhi et al., Reference Sodhi, Posa, Lee, Bickford, Koh and Brook2010; Miettinen et al., Reference Miettinen, Shi and Liew2011). Habitat loss is estimated to have reduced Lao's bear population by c. 12% during 2000–2014 (Scotson et al., Reference Scotson, Fredriksson, Ngoprasert, Wong and Fieberg2017b). Asiatic black bears and sun bears are categorized as Vulnerable on the IUCN Red List, with populations projected to decline globally by > 30% in the next 30+ years (Garshelis & Steinmetz, Reference Garshelis and Steinmetz2016; Scotson et al., Reference Scotson, Fredriksson, Augeri, Chea, Ngoprasert and Wong2017a).
Historically, Asiatic black and sun bears were recorded in all provinces of Lao (Erdbrink, Reference Erdbrink1953; Lekagul & McNeely, Reference Lekagul and McNeely1977), but current IUCN range maps suggest bear range is limited to national protected areas and some provincial protected areas (Garshelis & Steinmetz, Reference Garshelis and Steinmetz2016; Scotson et al., Reference Scotson, Fredriksson, Augeri, Chea, Ngoprasert and Wong2017a,Reference Scotson, Fredriksson, Ngoprasert, Wong and Fiebergb; Fig. 1). However, the IUCN range maps are based on expert opinion, and conservation efforts are hampered by lack of empirical data. Effective conservation of bears requires improved knowledge of bear distribution and relative abundance, and a replicable method of monitoring populations over time.
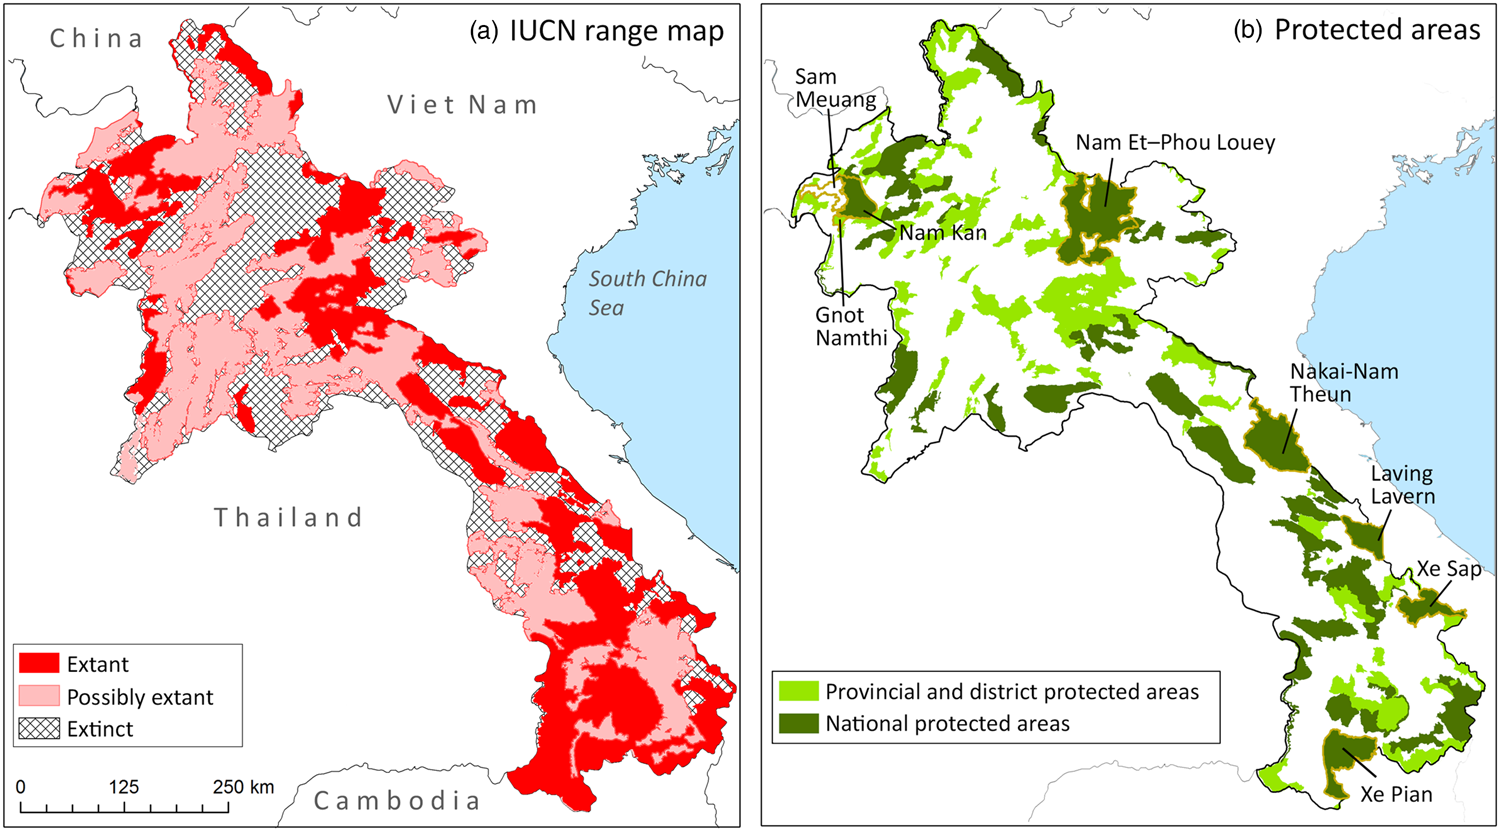
Fig. 1 (a) IUCN range map for the Asiatic black bear Ursus thibetanus and sun bear Helarctos malayanus in Lao PDR. Range is identical for the two species. Possibly extant range is likely to contain bears, based on habitat composition and proximity to definite range; extinct range is thought to be devoid of bears (IUCN, 2018). (b) National Protected Areas and Provincial and District Protected Areas in Lao PDR; the eight sites surveyed for bear sign during 2010–2013 are labelled (see Table 1 for details of each site), including one surveyed area outside protected areas (Sam Meuang Product Forest).
Monitoring programmes must be affordable and applicable over large areas, with sampling strategies that allow extrapolation to non-surveyed areas. Lao is dominated by rugged terrain, and access to bear habitat is largely limited to areas that can be reached on foot from rural villages. Our objective was to construct and implement a practical, low-cost survey method for bears and use species distribution modelling to predict spatial patterns of bear occurrence and habitat suitability in relation to ecological and anthropogenic factors throughout the country. Our findings can be used to inform conservation management of bears by identifying areas of suitable bear habitat and where populations are most abundant.
Study area
During 2010–2013 we surveyed eight study sites throughout Lao (Fig. 1); sites varied in elevation and proximity to villages (Table 1). Most sites were characterized by steep mountainous terrain with a diversity of forest types (including mixed evergreen and deciduous forest, dry evergreen and upper montane forest, and patchily distributed secondary forest), agricultural lands and anthropogenic grasslands, but Xe Pian National Protected Area in the southern lowland plains is a mosaic of semi-evergreen, mixed deciduous and dry dipterocarp forests and wetland habitat.
Table 1 Characteristics of the eight study sites (Fig. 1) surveyed for bear sign in Lao PDR during 2010–2013.

1 Numbers are approximate and include villages located inside and around park boundaries.
Methods
At each study site we searched for bear sign within 10–36 line transects that were 500 m long and 6 or 10 m wide. Transects were selected by generating a pool of random points within protected area boundaries using ArcGIS 9.3 (ESRI, Redlands, USA). Points were approached from the nearest village by walking directly towards each point and completing 500 m transects within different distance gradients from villages (2–5, 5–10, 10–15 and 15–20 km). Transects were a minimum of 700 m apart. In Xe Pian National Protected Area, where habitat was flat and open, we walked long, continuous transects, and later systematically spaced each 500-m segment by 1500-m by removing segments of the transects.
We completed 99 transects totalling 61.34 km in length and covering 322.7 ha. Each transect was surveyed by a four- or five-person team, trained and led by LS (for detailed methods see Scotson, Reference Scotson2017). Sampling effort within forest types was approximately proportional to their areal coverage in Lao. We recorded all bear sign along transects, including claw marks on trees (representing c. 80% of all observed sign), bear nests, evidence of digging, broken rotten wood and broken bee nests (identified as bear sign by using pre-determined criteria and/or the presence of secondary bear sign; see Scotson, Reference Scotson2010 for descriptions and illustrations).We also recorded human sign (e.g. trail cutting, hunting, logging, camps), ungulate sign, bear food (ripe fruit, acorns), and forest composition. Bear signs were grouped into two age categories (Steinmetz & Garshelis, Reference Steinmetz and Garshelis2010): < 1 year old (hereafter recent sign) and recent and old sign combined (hereafter all sign). If claw marks of different age categories were observed on a tree, we recorded only the most recent sign. Sign could rarely be identified to species, and therefore sign was attributed to both species. We assumed that the amount of recent bear sign was directly proportional to the number of bears using the site and therefore was a measure of relative abundance (Seber & Schwarz, Reference Seber and Schwarz1999). All sign was assumed to reflect general habitat suitability because older claw marks remain visible for > 2 years and accumulate at variable rates (Steinmetz & Garshelis, Reference Steinmetz and Garshelis2010).
We modelled bear sign as a log-linear function of ecological and anthropogenic predictors using a single a priori mixed model selected based on sample size and degrees of freedom (Fieberg et al., Reference Fieberg, Rieger, Zicus and Schildcrout2009; Giudice et al., Reference Giudice, Fieberg and Lenarz2012). Allowable degrees of freedom were calculated as m/15, where m is 99 transects (Harrell, Reference Harrell2015), and therefore 99/15 = 6.6 model parameters allowed, which we rounded up to 7 (excluding intercepts). We assumed our data followed a negative binomial distribution because count data are typically overdispersed (Gardner et al., Reference Gardner, Mulvey and Shaw1995), with high frequencies of excess zeros that can often be explained by model covariates (Warton, Reference Warton2005). We used random effects to account for potential non-independence among transects within the same protected area. We considered ecological and anthropogenic variables thought to affect bear presence, collected locally or else extracted from a Geographic Information System (GIS). To reflect the small area covered by transects (0.3–0.5 ha), predictors were measured within circular plots with a radius of 350 m (0.35 ha) to explore how bears responded to their immediate surroundings. In addition to an intercept, our models included a negative binomial dispersion parameter, a random site effect, and five fixed covariates (Table 2). We selected model variables for inclusion in the a priori model based on: (1) their biological importance, (2) data availability, (3) the probability that future updates will become available for predictors that change over time, (4) their variation within study sites, and (5) their independence from other predictors (i.e. Pearson's |r| < 0.7; Giudice et al., Reference Giudice, Fieberg and Lenarz2012). Considering these criteria, we selected % tree cover (an indicator of forest type; Hansen et al., Reference Hansen, Potapov, Moore, Hancher, Turubanova and Tyukavina2013), elevation, terrain ruggedness, and distances to nearest village and road for inclusion in the model (Table 2). We regarded % tree cover and elevation as ecological covariates, whereas we presumed that ruggedness and distance to village and road are measures of potential anthropogenic disturbance. Locally collected predictors (human disturbance, food abundance, ungulate sign) were not available outside study sites, and therefore we explored their effects separately using post-hoc models.
Table 2 Environmental predictors considered for log-linear models of bear sign recorded on line transects in eight study sites in Lao that were sampled during 2000–2013. Ungulate, Food and Human disturbance were collected on transects; all other predictors were obtained from remote sensing data.

1 % tree cover derived from tree loss data for 2000–2012 (Hansen et al., Reference Hansen, Potapov, Moore, Hancher, Turubanova and Tyukavina2013). Elevation derived from ASTER 30 m digital elevation model (DEM). Terrain ruggedness derived from DEM as a measure of steepness and terrain undulations.
2 Number of regression parameters (coefficients, excluding intercept) needed to model each predictor as a linear effect, without interactions (adapted from Giudice et al., Reference Giudice, Fieberg and Lenarz2012).
3 Gnot Namthi Provincial Protected Area and Sam Meuang Product Forest are combined as they are contiguous, with similar ecological and human-based conditions.
4 Forest cover extracted from Geographic Information System land cover layer created by the Forest Inventory and Planning Division of the Department of Forestry, Lao. Categories were reduced from eight to three, based on ecological similarity, and expected bear use: (1) primary forest (lower dry evergreen and lower mixed deciduous), (2) degraded and secondary forest (bamboo, un-stocked forest), and (3) dry deciduous forest.
We modelled the relationship between the expected count (E[Yi]) of bear sign on each transect as:
 $$\eqalign{&\log \left( {\displaystyle{{E\lsqb {Y_i} \rsqb } \over {area}}} \right) = \beta _0 + \beta _1Tree\_cover + \beta _2Elevation \cr &\quad\ \ \ + \beta _3Ruggedness+ \beta _4Dist\_road + \beta _5Dist\_village + \varepsilon _a} $$
 We ran two identical models using recent sign and all sign as the response variables. We included log transect area (0.01 ha) as an offset, and centred covariates using z-scores. We evaluated models with the intraclass correlation coefficient (ICC), which is the ratio of the between-cluster variance ( $\varepsilon^2 $) to the total variance and is the proportion of total variance in the response that is accounted for by clustering of observations. The intraclass correlation coefficient can also be interpreted as the level of correlation among observations within the same cluster, and so indicates whether inclusion of a random effect is informative (McCullough & Nelder, Reference McCullough and Nelder1989). Using our model response variables, which were in a GIS database, we created a predictive distribution map. Using the ArcGIS raster calculator, E[Yi] was predicted for each 0.7 × 0.7 km pixel across Lao using our regression model equations, variable values from the GIS database, and the response variable estimates from our results. We interpreted the map generated from the recent sign model as reflective of relative bear abundance (Steinmetz & Garshelis, Reference Steinmetz and Garshelis2010, Fredriksson, Reference Fredriksson2012) and the map generated from the all sign model as reflective of bear habitat suitability (because all sign included in the latter accumulate over a longer time period). We calculated the relative abundance of bears and the area of bear habitat inside and outside the Lao protected area network, with habitat and relative abundance categorized by the predicted number of bear sign; < 1 = marginal, 1–4 = good, and 5 = optimal.
Models were evaluated using Spearman's rank correlation between real and predicted values. We also tested models predictive performance using leave-one-out cross-validation procedures (Abdi & Williams, Reference Abdi, Williams and Salkind2010). To test model performance at predicting sign counts at new sites, we repeated the cross-validation process with individual study sites as the sample unit. Cross-validation performance was assessed using receiver operating characteristic curves and area under the curve (AUC) values. We analysed data in R 3.3.1 (R Core Team, 2016) with package glmmADMB, generated profile confidence intervals with R function confint, and produced GIS covariates and predictive maps in ArcGIS.
Results
We observed 165 recent bear signs on 43 transects and a total of 455 bear signs on 77 transects (Fig. 2). Bear sign increased with elevation, ruggedness, tree cover, and distance from roads, although some of these relationships were significant only in the all sign model (Table 3, Fig. 3). Sign was negatively associated with human disturbance (P < 0.001) and positively (but non-significantly) associated with ungulate sign and food abundance (Table 4).


Fig. 3 Modelled relationships between expected count of bear sign on transects and distance to village and per cent tree cover. Bear sign were recorded within line transects in eight study sites in Lao (Fig. 1, Table 1) during 2010–2013. The left panels display relationships from a model of recent sign (< 1 year old), and the right panels from a model of bear sign of all ages. Predicted values were generated using the predict function in R, with values for all other covariates fixed at their mean. The black line is the predicted response and the grey envelopes are the 95% confidence intervals.
Table 3 Model slopes (β 1) and 95% confidence intervals from two log-linear generalized mixed models, relating count of bear sign collected along straight line transects in Lao during 2010–2013 as a log-linear function of remotely sensed predictors1. The Recent sign model included sign < 1 year old as the response, and the All sign model included sign of any age.

1 Predictors were centred using mean/SD. Models were offset by transect area (m2/100).
2 Profile confidence intervals generated by R function confint.
Table 4 Model slopes (β 1) and 95% confidence intervals from two log-linear generalized mixed models, relating count of bear sign collected along straight line transects in Lao during 2010–2013 as a log-linear function of locally collected predictors1. The Recent sign model included sign < 1 year old as the response, and the All sign model included sign of any age.

1 Predictors were centred using mean/SD. Models were offset by transect area (m2/100).
2 Profile confidence intervals generated by R function confint.
For a-priori models 18% of stochastic variance in recent sign was explained by study site (ICC = 0.18) vs 1.7% of variance in all sign (ICC = 0.017). For post-hoc models, we observed the opposite pattern (all sign ICC = 0.27; recent sign ICC < 0.01). Low negative binomial dispersion parameters (< 2.5) indicated that negative binomial distributions were appropriate for all models.
Spearman's rank correlations between observed and predicted values were significant for both a priori models for recent sign (r = 0.337, P < 0.001) and for all sign (r = 0.535, P < 0.001). Receiver operating characteristic curves derived from leave-one-out cross validation had AUC values of 0.63 (95% CI 0.46–0.77) for recent sign and 0.73 (95% CI 0.53–0.89) for all sign.
Relative bear abundance based on recent sign was predicted to be highest in mountainous areas, particularly in the north and in the eastern mountainous areas that border Viet Nam. The all sign model predicted a wider area of bear habitat suitability than the recent sign model. Bear abundance was lowest in the southern tropical lowland plains, with only small patches of suitable habitat (Fig. 4). Fifty seven per cent of areas categorized as good bear habitat (predicted sign = 1–4; 67,314 km2) and 48% of optimal bear habitat (predicted sign > 5; 17,207 km2) fell outside the protected area network, equalling a total of 84,521 km2 (55%) of suitable habitat (i.e. > 1 predicted bear sign) situated outside the protected area network. Of all the protected areas in Lao, Nam Et–Phou Louey National Protected Area had the largest areas of suitable bear habitat (predicted sign > 1; 4,000 km2) followed by Nakai-Nam Teun and Nam Ha National Protected Areas (3,510 km2 and 2,145 km2 respectively; Table 5).

Fig. 4 Predicted distribution of Asiatic black bear and sun bear in Lao, based on sign collected on line transects in eight study sites (Fig. 1, Table 1) during 2010–2013. Predictions were generated from models in which log bear sign was a linear function of elevation, distance to road, terrain ruggedness, % tree cover and distance to village (Table 3). (a) Predictions made using sign of all ages (as sign accumulates over long periods this is considered to reflect habitat suitability), (b) predictions made using recent sign (< 1 year old; considered to reflect current distribution and relative abundance of bear populations).
Table 5 Area of predicted bear habitat within individual National Protected areas in Lao, ranked from smallest to largest, using distribution models created from all bear sign encountered (all sign models).

1 Predicted sign count per map pixel > 1.
2 Predicted sign count per map pixel > 5.
*Surveyed for bear sign during 2010–2013.
Discussion
Modelling bear sign with biological and anthropogenic predictors gave us insight into bear distribution, relative abundance and habitat suitability in Lao. The maps identified key areas for conserving bears, including mountainous regions of the north, and along the eastern border with Viet Nam. Suitable bear habitat was also identified within large areas of forest outside protected areas, including some locations where bears are currently regarded as extirpated by IUCN. Bear presence was predicted to some degree in all 28 designated and proposed protected areas in Lao, with an area of suitable bear habitat (predicted sign > 1) of 265–3157 km2 per protected area. According to our predictions, the area of suitable bear habitat exceeded 1,000 km2 for more than 50% of protected areas in Lao and, based on area alone, Nam Et–Phou Louey National Protected Area (north-eastern), Nakai-Nam Theun National Protected Area (eastern) and the Nam Ha National Protected Area (northern) may be the most important protected areas for bear conservation (Table 5). By periodically updating remotely sensed predictors, our models can be used as a GIS-based monitoring tool to predict changes in bear distribution caused by changes in forest cover and human land-use over time.
Using sign to index relative abundance is a common, yet contentious monitoring method (Barnes, Reference Barnes2001; Stephens et al., Reference Stephens, Pettorelli, Barlow, Whittingham and Cadotte2015). Ngoprasert et al. (Reference Ngoprasert, Gale, Vichitsoonthonkul and Vaeokhaw2015) found sign density to reflect differences in abundance between Asiatic black bears and sun bears, and Diefenbach et al. (Reference Diefenbach, Conroy, Warren, James, Baker and Hon1994) demonstrated a positive relationship between sign index of bobcats Felis rufus and abundance. Key assumptions for sign being proportional to abundance include a constant rate of sign deposition amongst individual bears and no heterogeneity in sign detection by survey teams (Seber & Schwarz, Reference Seber and Schwarz1999). Although violation of assumptions is inevitable to some degree in a large-scale uncontrolled study, we believe our predictions reflect the relative abundance of bears, and that our method is a significant improvement on expert opinion data currently available for Lao. Considering the financial and logistic constraints inherent in Lao, sign transects also provide an inexpensive and practical monitoring method for bear populations.
Poaching for commercial trade is considered the primary threat to bears in South-east Asia (Garshelis & Steinmetz, Reference Garshelis and Steinmetz2016; Scotson et al., Reference Scotson, Fredriksson, Augeri, Chea, Ngoprasert and Wong2017a,Reference Scotson, Fredriksson, Ngoprasert, Wong and Fiebergb). Wildlife poaching is widespread in Lao (Scotson & Brocklehurst, Reference Scotson and Brocklehurst2013) and in some areas the decline of bear populations may be a result of overhunting rather than habitat loss. To account for this our models included predictors commonly associated with human accessibility and therefore potential poaching levels (Brodie et al., Reference Brodie, Giordano, Zipkin, Bernard, Mohd-Azlan and Ambu2015). As expected, bears selected habitat less accessible by humans, in areas of high elevation, with high % tree cover, at greater distance from roads, and in areas with lower signs of human activity.
Model-based predictions differed from the expert opinion-based range maps (IUCN, 2018; Fig. 1). We found evidence of bear occurrence in all study sites in Lao with extensive areas of suitable habitat, concentrated in mountainous regions of the north and east. Importantly, models predicted bear range in areas presently marked as extirpated by the IUCN, most notably in the northern highlands. Our results suggested that bear habitat suitability is very low in the southern lowland plains, contradicting areas marked as extant and possibly extant by IUCN (Garshelis & Steinmetz, Reference Garshelis and Steinmetz2016; Scotson et al., Reference Scotson, Fredriksson, Augeri, Chea, Ngoprasert and Wong2017a,Reference Scotson, Fredriksson, Ngoprasert, Wong and Fiebergb; Fig. 4). Overall, our study represents a significant advance in knowledge of bear distribution patterns in Lao, with our results suggesting that the status of the national bear population is relatively better than in neighbouring range countries and that Lao is a core area for bear conservation in South-east Asia.
Our maps provide useful tools to help guide bear conservation in Lao. Firstly, activities to conserve core bear populations will be most effective if proactive measures such as population monitoring, snare removal, law enforcement patrols and community awareness activities are targeted in areas with the highest predicted bear abundance. Secondly, there is a need to evaluate bear presence and status in areas predicted as suitable habitat that fall outside currently documented bear range, and to protect these areas if bear presence is confirmed. Thirdly, patches of suitable habitat may be valuable for maintaining connectivity between core habitats, and could potentially be used to restore extirpated bear populations, by managing core connected areas for population growth (Scharf & Fernández, Reference Scharf and Fernández2018) or by repopulating areas where bears have been locally extirpated (Wolf & Ripple, Reference Wolf and Ripple2018). Reintroduction of orphaned bear cubs to areas of suitable habitat may be a solution for the ever increasing population of captive bears in bear rescue centres throughout South-east Asia (Garshelis & Steinmetz, Reference Garshelis and Steinmetz2016; Scotson et al., Reference Scotson, Fredriksson, Augeri, Chea, Ngoprasert and Wong2017a). Fourthly, sign transects offer an effective and affordable solution to bear monitoring when resources are limited, and are compatible with ranger monitoring systems (e.g. SMART, 2013). Rangers can be trained in sign survey techniques, and enlisting ranger teams to conduct sign surveys would reduce operating costs by use of existing resources. Furthermore, expanded activities by ranger teams in protected areas would improve the visibility of law enforcement, serving to deter human incursion and illegal activities. Although mobilizing rangers in new ways would be helpful, it is not a panacea for protecting bears. Fundamental to conserving bears in Lao is the implementation of effective law enforcement to reduce poaching and trade, which are decimating wildlife populations throughout much of South-east Asia (Johnson et al., Reference Johnson, Goodrich, Hansel, Rasphone, Saypanya and Vongkhamheng2016). In most areas of Lao this requires additional long-term funding for the development of protected area infrastructure, to mobilize rangers, build capacity and provide necessary equipment.
Acknowledgements
LS thanks all in the Government of Lao who facilitated this project and the field technicians who assisted in data collection. We thank the Wildlife Conservation Society and the faculty at the National University of Lao for technical support and field permits, Matt Hunt and Free the Bears, and Perth Zoo, The Hauser Bear Foundation, The International Bear Association's Research and Conservation Grant and Experience and Exchange Grant, Alertis Fund for Bear and Nature Conservation, The Margaret Dawbarn Foundation and Estate Robin Under Rothwell Account Wildlife Preservation Trust, managed by Perpetual, Colchester Zoo's Action for the Wild Fund, Kölner Zoo, and the University of Minnesota's Doctoral Dissertation Fellowship and Conservation Biology Summer Grant for funding.
Author contributions
Study design: all authors; fundraising, field work writing: LS; GIS analysis: SR; contributed to analysis, writing and revision: SR, TA.
Conflicts of interest
None.
Ethical standards
This research complied with the Oryx Code of Conduct.


 Open access