


Introduction
The IUCN Red List procedures for identifying the threat status of species include criterion A, which is designed to assess a trajectory of population decline regardless of population size or geographical extent. It has been argued that this criterion is justified by the numerous examples of common species becoming extinct (Butchart et al., Reference Butchart, Walpole, Collen, van Strien, Jörn and Almond2010; Lindenmayer et al., Reference Lindenmayer, Wood, McBurney, MacGregor, Youngentob and Banks2011), but is not readily applied because of a perceived difficulty in generating unbiased estimates of decline (Mace et al., Reference Mace, Collar, Gaston, Hilton-Taylor, Akçakaya and Leader-Williams2008; Le Breton et al., Reference Le Breton, Zimmer, Gallagher, Cox, Allen and Auld2019). Habitat loss is a common measure of decline and with adequate data on timing and extent can be used to estimate population decline under criterion A. This process is generally not applicable to criterion A1, which assesses reversible decline, but may be relevant under the other criteria that assess irreversible decline in the past (A2), future (A3) or both the past and future (A4). These criteria identify threatened species based on ‘population reduction observed, estimated, inferred, or suspected in the past [and/or future] where the causes of reduction may not have ceased or may not be understood or may not be reversible’ (Annex 4, IUCN, 2012). Subcriteria A2, A3 and A4 require population declines of 30–50% over a three-generation period (for species with a generation length > 3 years) to be categorized as Vulnerable, 50–80% to be categorized as Endangered and > 80% to be categorized as Critically Endangered. The criteria can result in relatively common, long-lived species qualifying as threatened, and this apparently perverse outcome has not been lost on the architects of the IUCN Red List procedure; ‘on the basis of decline rates only and with no threshold population sizes, criterion A has the potential to force the inclusion of some extremely abundant populations into lists of threatened species. Criterion A has therefore been controversial, especially for widespread species with historical declines that are believed to have stabilized’ (Mace et al., Reference Mace, Collar, Gaston, Hilton-Taylor, Akçakaya and Leader-Williams2008, p. 1,437; IUCN Standards and Petitions Committee, 2019, Section 5.4). Subcriteria A3 and A4 are particularly controversial because they require estimates of future decline, with obvious difficulties of determination.
A recent continental assessment of eucalypts resulted in 134 of the 822 Australian eucalypt species (species of Angophora, Corymbia and Eucalyptus) being categorized as threatened under subcriterion A2 (Fensham et al., Reference Fensham, Laffineur, Collingwood, Beech, Bell and Hopper2020). The eucalypts eligible under this criterion have undergone population declines as a result of deforestation for cropping, pasture and urbanization. Consistent with the IUCN Guidelines (IUCN Standards and Petitions Committee, 2019), these land-use conversions are ‘understood’, have ‘ceased’ in some areas, but are not ‘reversible’, especially over large areas, such as cities and core food producing regions. Population declines as a result of these land-use changes were assumed to have commenced with the broadscale expansion of agriculture and pastoralism in Australia from 1810, coinciding with three generations (c. 210 years) of these long-lived trees. Because eucalypts are the dominant tree in many Australian ecosystems, deforestation was considered a proxy for a ‘decline in habitat quality’ under subcriterion A2b after the application of conservative assumptions about the extent of habitat within the geographical range of a species (Fensham et al., Reference Fensham, Laffineur, Collingwood, Beech, Bell and Hopper2020). Examples of the conservative assumptions were that species occurring in productive habitat (on fertile soils) were not assumed to have been preferentially cleared and no attempt was made to assess decline for species with a preference for unproductive habitat (e.g. rocky landscapes). For many countries, including Australia, land-use mapping is not adequate to represent deforestation as ‘an index of abundance appropriate to the taxon’. This is because land-use change often results in partial deforestation or the removal of a forest canopy and does not necessarily result in population decline as young trees may persist despite clearing. However, a method assessing intensive deforestation by interpretation of random points over satellite imagery using a < 5% tree cover cut-off for deforestation (Fig. 1) essentially represents decline as both ‘decline in habitat quality’ and ‘an index of abundance appropriate to the taxon’. Deforestation was not equated to a decline in extent of occurrence (EOO) or area of occupancy (AOO) because population fragments generally persist as paddock trees, along roadsides and in numerous small nature reserves and other tenures. Species with restricted or diminished AOO and EOO become eligible under criterion B which is the criterion most commonly applied to determine threat status (Brummitt et al., Reference Brummitt, Bachman, Griffiths-Lee, Lutz, Moat and Farjon2015; Le Breton et al., Reference Le Breton, Zimmer, Gallagher, Cox, Allen and Auld2019). For most of the eucalypt species assessed as Threatened under subcriterion A2, their large AOO and EOO determined that they only rarely also qualified under criterion B (Fensham et al., Reference Fensham, Laffineur, Collingwood, Beech, Bell and Hopper2020).
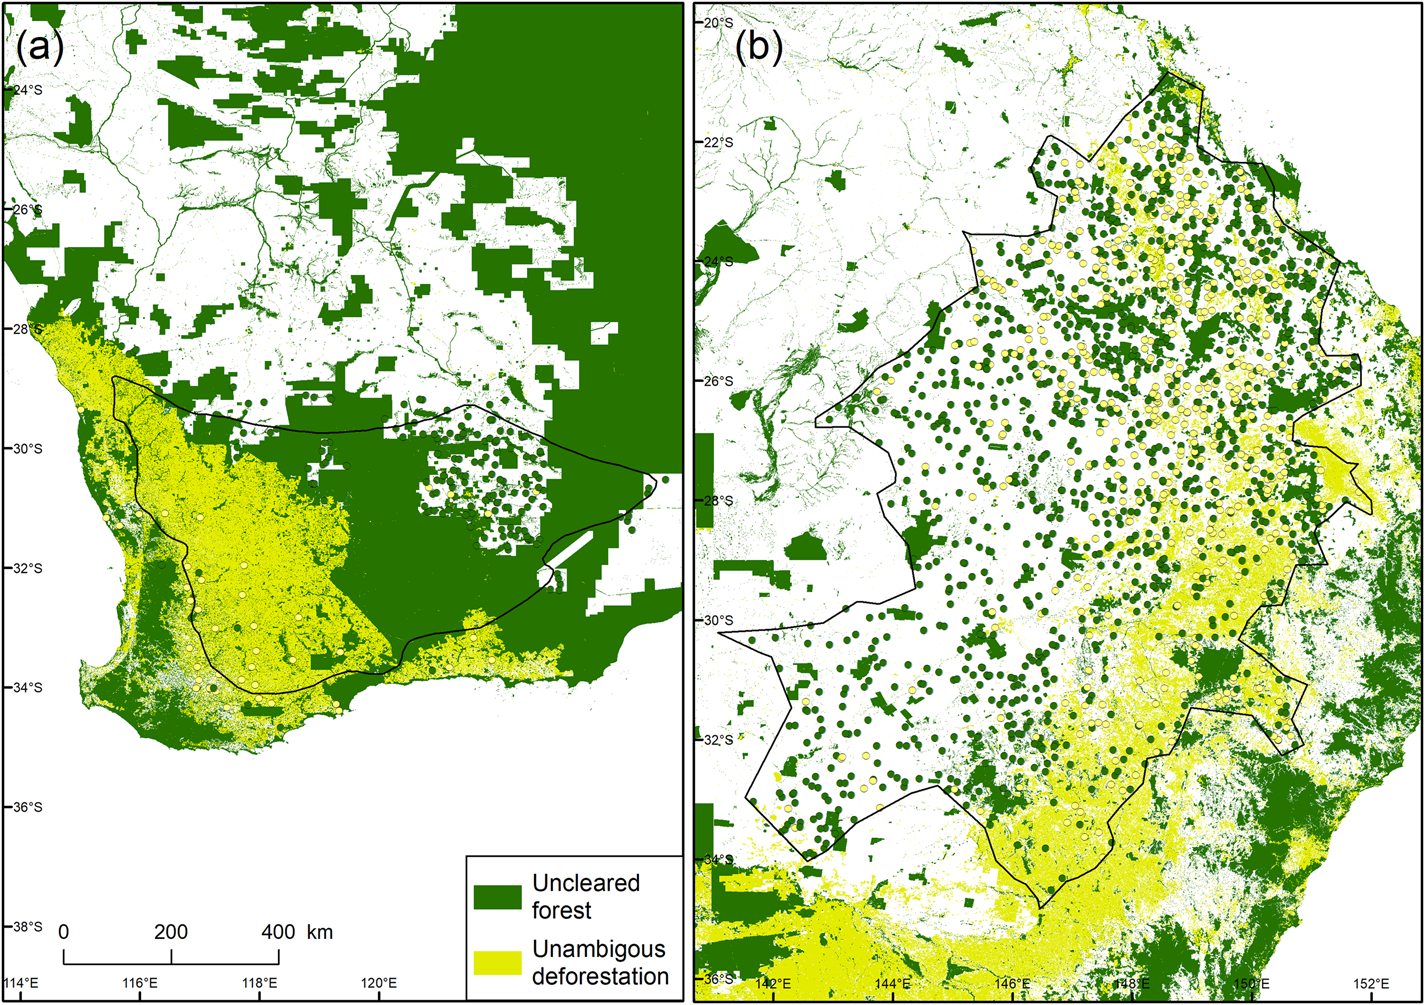
Fig. 1 The distribution (black outline) of (a) salmon gum Eucalyptus salmonophloia in western Australia, and (b) poplar box Eucalyptus populnea in eastern Australia, with uncleared forest and unambiguous deforestation. In areas where deforestation has not been mapped it was assessed using random points and is identified by < 5% tree cover in an area subject to clearing (Fensham et al., Reference Fensham, Laffineur, Collingwood, Beech, Bell and Hopper2020). Cleared areas with > 5% tree cover are conservatively assumed to be forested.
All Australian state jurisdictions address native vegetation clearance in legislation, and clearing for agriculture has slowed substantially as a result (Evans, Reference Evans2016). However, clearing has not ceased altogether, and the significance of loopholes and enforcement of the laws is subject to political will (Maron et al., Reference Maron, Laurance, Pressey, Catterall, Watson and Rhodes2015). The threat status of eucalypt species and many other Australian species is conditional on the cessation of habitat clearance and the efficacy of the laws that regulate this management practice.
Of the 134 eucalypt taxa assessed as threatened under subcriterion A2, the majority are widespread and common species that occur in arable parts of the landscape. Most of these species are not currently categorized as threatened under Australian federal and state legislations. Alongside the new recommendations for listing, 33 of the existing threatened species no longer meet the criteria to qualify as threatened, because of an absence of tangible threats (amongst other criteria; Fensham et al., Reference Fensham, Laffineur, Collingwood, Beech, Bell and Hopper2020). Thus the previous list of 89 eucalypt species categorized as threatened under Australian legislation is substantially different from the 192 species (including 58 qualifying under subcriteria other than A2) categorized as threatened by the recent analysis (Fensham et al., Reference Fensham, Laffineur, Collingwood, Beech, Bell and Hopper2020). This apparently radical proposal to list common species exhibiting declines as threatened and lower the threat status of rare species that are not declining met with considerable consternation in the workshop held for the eucalypt listing project in Brisbane on 30 November 2018 and generated debate about the application of criterion A. In Australia, listing has considerable gravity because threatened species are protected by both state and federal laws and there is a clear distinction in terms of protection between species qualifying as Near Threatened and Vulnerable under Red List criteria. In general, the listing of a species under Australian law ensures that actions that have a significant impact on a population of a listed threatened species triggers assessment and may prohibit or require modification of the action (Commonwealth of Australia, 2013). Here I explore issues associated with subcriterion A2 by examining contrasting future hypothetical decline scenarios of two eucalypt species, both of which are widespread and qualify as Vulnerable based on the magnitude of historical population decline. I provide a simple function to determine the time in the future when the threat status of a threatened species will no longer apply as a result of changing magnitude of decline.
Future scenarios under criterion A
Salmon gum Eucalyptus salmonophloia and poplar box Eucalyptus populnea are dominant woodland trees that are extremely widespread and thus the signature species for vast landscapes in western and eastern Australia, respectively (Fig. 1). Both species have undergone estimated population declines of 36% in three generations (Fensham et al., Reference Fensham, Laffineur, Collingwood, Beech, Bell and Hopper2020). Assuming a constant rate of habitat decline since 1810, and stable populations for the decades before European settlement, both species qualified for listing as threatened with a Vulnerable status in 1971 (Fig. 2). The logic of listing both species as threatened is apparent as the continuation of previous rates of decline would render both species extinct within eight generations, in 2370 (Fig. 2). However, assuming 10% of the population is secured in conservation reserves, extinction may be prevented in the absence of other threatening processes. For locally abundant and widespread species such as salmon gum and poplar box, 10% of the original population represent populations at least in the order of millions of individuals. Criteria B, C and D, which include provisions for rarity, are unlikely to be relevant until much greater population decline has occurred for these species (Fig 2).
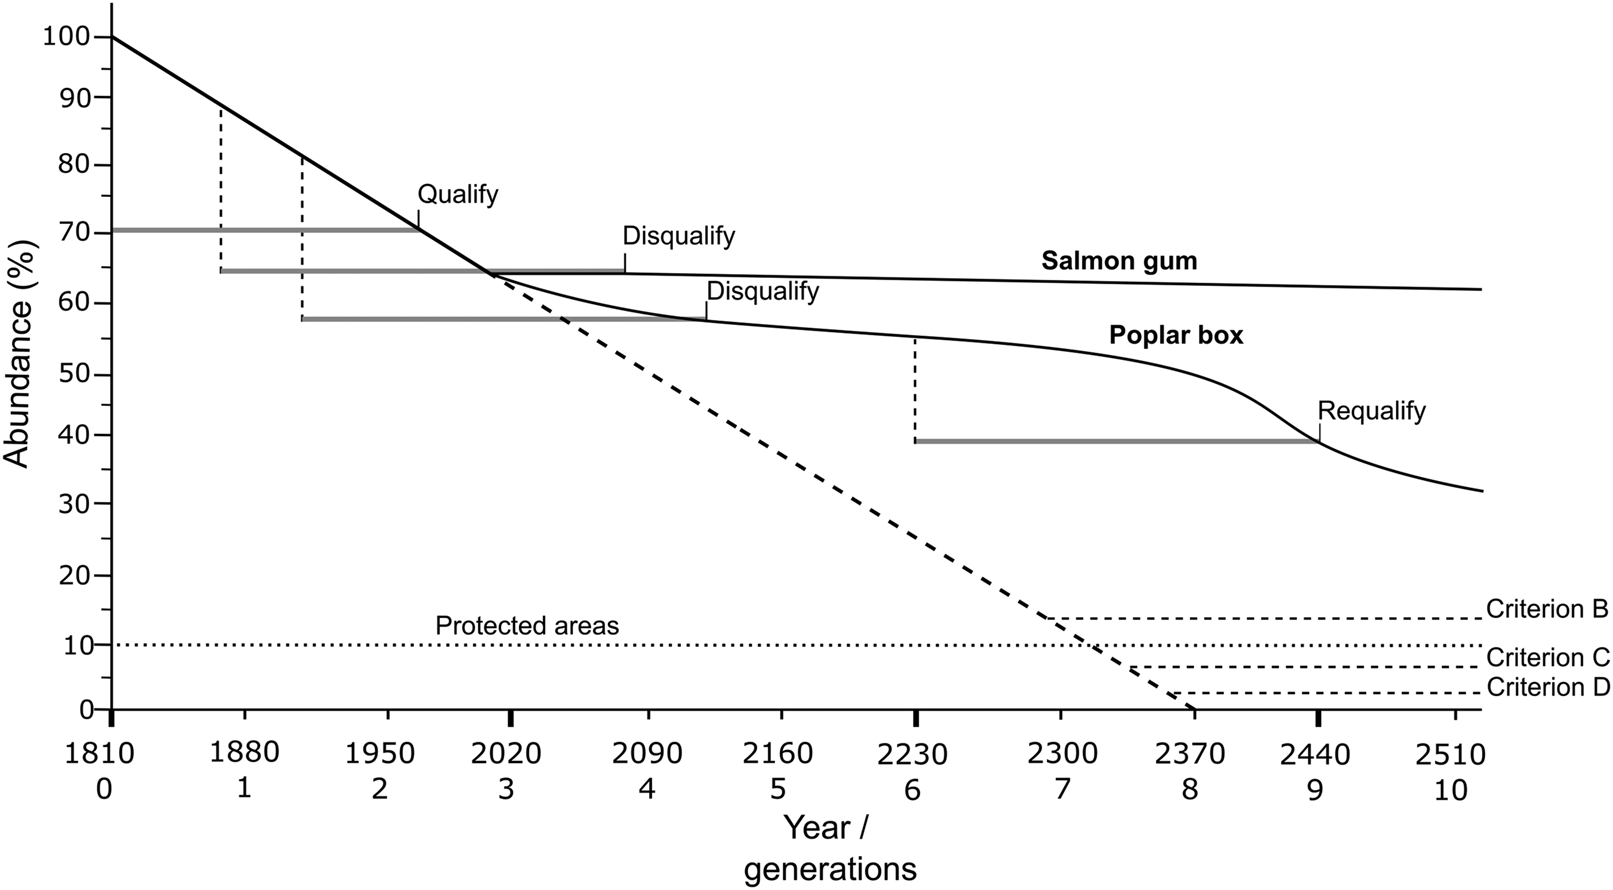
Fig. 2 Schematic representation of species decline for salmon gum and poplar box and the thresholds for threatened as Vulnerable and not threatened according to the Red List subcriterion A2. Species are categorized as Vulnerable when decline is > 30% over the previous three generations (210 years, as indicated by grey lines; Fensham et al., Reference Fensham, Laffineur, Collingwood, Beech, Bell and Hopper2020). The decline rate for both species until 2020 is represented by the estimated value of 36.4% (Fensham et al., Reference Fensham, Laffineur, Collingwood, Beech, Bell and Hopper2020). Assuming a constant rate of decline from 1810, both species qualified for listing as threatened in 1971. Hypothetical future scenarios are presented in which salmon gum has no decline after 2020 until it is disqualified for categorization as threatened in 2073, followed by a low rate of decline. Poplar box continues to decline after 2020 albeit at a lower rate than previously and is thus disqualified as a threatened species in 2130. Supposing poplar box undergoes a rapid future decline it would requalify as a threatened species in 2440. The dashed line indicates the trajectory to extinction based on the historical trend. Both species occur in protected areas and these are indicated as 10% of the habitat for the populations. To demonstrate the clear distinction between decline (assessed under subcriterion A2) and rarity or range restriction utilized by other criteria, the situations where criteria B, C and D would likely become relevant are indicated.
Salmon gum occurs over a large geographical range (287,718 km2) in south-western Western Australia (Fig. 1). In the eastern part of the species' range, salmon gum woodlands are largely intact as a result of legislative protection and a relatively arid climate that limits cropping activity. These woodlands are typically lightly grazed because of scarce surface and groundwater, with landscape-scale natural disturbances driving population dynamics and regeneration (Yates et al., Reference Yates, Hobbs and Bell1994b; Gosper et al., Reference Gosper, Yates, Cook, Harvey, Liedloff and McCaw2018). Vegetation clearance is regulated in Western Australia by the Environmental Protection (Clearing of Native Vegetation) Regulations 2004 under the Environmental Protection Act 1986 and it seems probable that the more extensive, eastern part of the species' range will be preserved into the future. In the relatively mesic, western part of the species' range, salmon gum woodlands occur on loam soils on which wheat crops are now grown. Isolated trees in paddocks and many small woodland fragments continue to decline and there is little regeneration (Yates et al., Reference Yates, Hobbs and Bell1994a). Importantly however, subcriterion A2 applies over the past three generations and carries no assumptions about future decline. If the population decline of salmon gum stabilizes it would be disqualified as a threatened species (i.e. no longer Vulnerable) by 2073 (Fig. 2).
Like salmon gum, poplar box also occurs on arable soils, but with a more extensive geographical range (859,189 km2; Fig. 1). Unlike salmon gum, deforestation has occurred throughout the range of the species (Fig. 2), progressing northwards and intensifying in these regions from 1970 (Fensham & Fairfax, Reference Fensham and Fairfax2003). Legislation currently regulates habitat loss associated with agriculture in both Queensland and New South Wales, but clearing continues at high rates (Queensland Department of Environment and Science, 2018; Audit Office of New South Wales, 2019). For poplar box, a plausible, hypothetical scenario could assume rapid population decline is abated but slower declines continue (Fig. 2). This seems likely because even if clearing controls were completely effective in the future, areas with residual regrowth are likely to be further developed for more intensive use and livestock grazing will inhibit regeneration in areas not subject to clearance (Weinberg et al., Reference Weinberg, Gibbons, Briggs and Bonser2011). Under this scenario, poplar box will be downlisted from a threatened status in 2130 because its rate of decline will eventually become <30% over three generations (Fig. 2). Imagine a future human population explosion in Australia alongside subsequent demands for increased intensive land use, together with an Australian society that has little regard for preserving natural habitat. Remnant poplar box woodlands could again become especially attractive for development of croplands and pasture. Under this scenario (Fig. 2), poplar box would undergo rapid population declines exceeding 30% in three generations and requalify as threatened in 2440. In the case of widespread common species these fluctuations in land-use and population decline may continue for a millennium before they requalify for categorization as threatened under criteria B, C or D (Fig. 2).
The application of subcriterion A2 to widespread and common species such as salmon gum and poplar box can seem misguided when much rarer species without decline do not qualify for listing as threatened (Fensham et al., Reference Fensham, Laffineur, Collingwood, Beech, Bell and Hopper2020). However, the accuracy of A2 as a measure of extinction risk is apparent when the potential future scenarios are presented (Fig. 2). If decline is arrested, then a species eligible as threatened under A2 will be appropriately disqualified. If decline is only marginally > 30% in three generations and further decline has been abruptly arrested, disqualification occurs shortly after qualifying (e.g. salmon gum, Fig. 2). If listing as threatened provides a mechanism for reducing decline, a downlist in status to not threatened is appropriate. If decline is diminished, time to ineligibility as a threatened species can be calculated using the formula:
 $$G_{2{\boldsymbol \;}} = {\boldsymbol \;}\displaystyle{{0.7( {3R_1} ) -0.3A_0 + G_{RY}( R_1-R_2) } \over {0.7R_1-R_2}}$$
where G 2 is the year of disqualifying from a threatened status (in generations from time = 0), R 1 is the initial decline rate (amount per generation expressed as a positive number) prior to the reference year GRY, R 2 is the diminished decline rate (amount per generation expressed as a positive number) after the reference year, GRY is the reference year that the decline rate changed from R 1 to R 2 (in generations from time = 0), and A 0 is the initial abundance (at time = 0 generations). The rate R 2 must be ≤ 0.1(A 0–R 1 × GRY) or disqualification as a threatened species does not occur. This formula assumes linear past and future rates of decline. IUCN Red List Guidelines (IUCN Standards and Petitions Committee, 2019, Section 2.2.1) require that a species can only be moved from a higher to a lower category of threat if and when none of the criteria of the higher category has been met for 5 years or more.
When applied to the taxa assessed as threatened under subcriterion A2 by Fensham et al. (Reference Fensham, Laffineur, Collingwood, Beech, Bell and Hopper2020), 56 of the 134 species would be disqualified as threatened species under the same criterion within one generation (70 years), although four of them qualify under other criteria (Table 1). However, if deforestation continues, disqualification of threatened species would be less frequent and new species would qualify for listing as threatened under subcriterion A2.
Table 1 Species of Eucalyuptus qualifying as threatened under subcriterion A2 within one generation (70 years) if deforestation ceases in 2020 (Fensham et al., Reference Fensham, Laffineur, Collingwood, Beech, Bell and Hopper2020), with the original geographical range used to estimate population decline (Fensham et al., Reference Fensham, Laffineur, Collingwood, Beech, Bell and Hopper2020), the estimate of population decline between 1810 and 2020, habitat type and the year of disqualification for listing as threatened species. For species from productive habitat, the estimate of population decline is derived from the geographical range of the species and an estimate of deforestation. For species in moderately productive habitat the estimate of population decline is estimated as 60% of area represented by intersection of the geographical range of the species and deforestation (Fensham et al., Reference Fensham, Laffineur, Collingwood, Beech, Bell and Hopper2020).

1 P, productive; M, moderately productive.
* Species that currently qualify for categorization as threatened on the Red List using criteria other than A2.
Discussion
There is a common misunderstanding that criterion A requires population monitoring datasets to assess decline (Le Breton et al., Reference Le Breton, Zimmer, Gallagher, Cox, Allen and Auld2019). Deforestation is a common cause of population decline and can be interpreted by quantifying change from forest to intensive land use relative to the generation length of a species even when land-use mapping is unavailable (Fensham et al., Reference Fensham, Laffineur, Collingwood, Beech, Bell and Hopper2020). However, because population decline under criterion A relates to time (i.e. three generation lengths), species that currently qualify can be disqualified in the future if decline stabilizes. In Europe, for example, where most deforestation occurred in the distant past, subcriterion A2 does not apply for long-lived trees. In Australia and other places where deforestation is more recent or ongoing, subcriterion A2 has probably been overlooked (Le Breton et al., Reference Le Breton, Zimmer, Gallagher, Cox, Allen and Auld2019), particularly for long-lived organisms such as trees. The scenarios of decline presented here for widespread eucalypts occurring on productive soils provide examples of how the status of long-lived species can vary between qualification and disqualification for the IUCN Red List threshold of 30% decline under subcriterion A2. Many of the eucalypt species proposed for listing as threatened under subcriterion A2 will be disqualified within the length of a single generation (Table 1) if the cause of decline, in this case deforestation, is arrested. By corollary, if deforestation is ongoing many common and widespread species can and should be categorized under subcriterion A2 and will continue to qualify until the cause of decline is arrested.
Acknowledgements
This study was supported by funding from the Australian Government's National Environmental Science Program through the Threatened Species Recovery Hub and a grant from Botanic Gardens Conservation International. The idea of this analysis was inspired by a discussion with Colin Yates, but also developed by other discussions with Ken Atkins, Tony Auld, Emily Beech, Stephen Bell, Teghan Collingwood, Vanessa Craigie, Angela Duffy, Jason Ferris, Craig Hilton-Taylor, David Keith, Boris Laffineur, Nathan McQuoid, Dean Nicolle, Gavin Phillips, Malin Rivers and Neville Walsh. Mark Fensham developed the function. I thank Stephen Bell, Teghan Collingwood, Boris Laffineur and Malin Rivers for checking the text and both Teghan and Boris for producing the figures.
Conflicts of interest
None.
Ethical standards
This research abided by the Oryx guidelines on ethical standards.


 Open access