


Introduction
Wildlife population assessments make a central scientific contribution to the conservation and management of wildlife, but the prohibitive costs associated with surveys (e.g. equipment and the deployment of teams over large and remote areas) have often limited the capacity to generate critical information on the status and trends of terrestrial mammals (Forrester et al., Reference Forrester, Baker, Costello, Kays, Parsons and McShea2017). Advancements in the technology of camera traps have not only helped to lower these costs but also established such technology as a core tool for ecologists and conservationists (Rowcliffe, Reference Rowcliffe2017; Rovero & Kays, Reference Rovero, Kays, Wich and Piel2021), as attested by the large number of published research studies that have used camera traps over the last 2 decades (Wearn & Glover-Kapfer, Reference Wearn and Glover-Kapfer2019).
Although the use of camera traps has expanded globally, there is a disproportionate lack of published camera trap-based research from Central Africa, with the exception of Gabon, and particularly outside strictly protected areas (Agha et al., Reference Agha, Batter, Bolas, Collins, Gomes da Rocha and Monteza-Moreno2018). In the Democratic Republic of the Congo, the largest Central African country, there has been an increase in camera-trap assessments since 2020 (Bessone et al., Reference Bessone, Kühl, Hohmann, Herbinger, N'Goran and Asanzi2020; Alempijevic et al., Reference Alempijevic, Boliabo, Coates, Hart, Hart and Detwiler2021; Mencia et al., Reference Mencia, Fournier and Detwiler2021; van der Hoek et al., Reference van der Hoek, Binyinyi, Ngobobo, Stoinski and Caillaud2023), but there has been only one published study looking at the terrestrial mammal community as a whole, within Nkuba Conservation Area (van der Hoek et al., Reference van der Hoek, Binyinyi, Ngobobo, Stoinski and Caillaud2023).
Wildlife assessments in this region are needed from a management perspective because mammals play a significant role in the subsistence of people and unsustainable hunting is driving declines (Maxwell et al., Reference Maxwell, Fuller, Brooks and Watson2016; Coad et al., Reference Coad, Fa, Abernethy, van Vliet, Santamaria and Wilkie2019). Offtake rates for Central Africa could be 1.6–11.8 million t of meat per year (Fa et al., Reference Fa, van Vliet, Nasi, Aguirre and Sukumar2016) and the main vertebrate group targeted by hunting are terrestrial mammals (Ripple et al., Reference Ripple, Abernethy, Betts, Chapron, Dirzo and Galetti2016). In this context, it is unclear how terrestrial mammal populations can be managed sustainably to support both people and wildlife. However, without a baseline from which to assess the status of terrestrial mammal populations, it is unlikely that any management interventions will be appropriate.
In this study, we used camera traps to assess the terrestrial mammal community in the Yangambi landscape in the Democratic Republic of the Congo. The study area encompasses the Yangambi Biosphere Reserve, the neighbouring logging concession, and customary land of the Turumbu tribe. Because of a lack of human and financial resources, the Yangambi Biosphere Reserve has never been managed since its creation in 1976, its borders have always been contested (Koy et al., Reference Koy, Wardell, Mikwa, Kabuanga, Monga Ngonga, Oszwald and Doumenge2019) and its terrestrial mammals have not been assessed. Food security is poor in the region (Nowak et al., Reference Nowak, Rosenstock, Hammond, Degrande and Smith2019) and wildmeat contributes significantly to household food security and nutrition (van Vliet et al., Reference van Vliet, Muhindo, Nyumu and Nasi2019). The forests around Yangambi provide 103–145 t of wildmeat per year to the local informal and official markets (van Vliet et al., Reference van Vliet, Muhindo, Nyumu and Nasi2019). The only available information on wildlife in the Yangambi landscape is based on the knowledge of hunters (van Vliet et al., Reference van Vliet, Muhindo, Nyumu, Mushagalusa and Nasi2018), and this information suggests that most species are now seen less frequently than 30 years ago and that a few species have disappeared locally (e.g. the African savannah elephant Loxodonta africana).
We therefore conducted a comprehensive assessment of the terrestrial mammals of the Yangambi landscape using camera traps. We assessed relative abundance, community composition, population dynamic parameters (occupancy, persistence and colonization) and activity patterns for the most abundant species. We suggest management options for the sustainable hunting of native species throughout the landscape, which could benefit the relationship between local people and nature.
Study area
The Yangambi landscape lies in the north-east of the Democratic Republic of the Congo, in Tshopo Province (Fig. 1). This landscape is characterized by a superposition of land tenures of the Yangambi Biosphere Reserve created in 1976, the customary land of the Turumbu ethnic group and a neighbouring logging concession. Given its protection status, our focus is the Yangambi Biosphere Reserve but we have also included the portion of the neighbouring logging concession that borders the Reserve to the north and overlaps with Ngazi Forest Reserve, a geographical entity with contested legal status. We refer to this area of overlap between the legally established logging concession, Ngazi Forest Reserve and the customary land of Weko (a Turumbu village) as ‘Ngazi’. The climate of the area is marked by two dry seasons (December–March and June–July) that alternate with two rainy seasons (April–May and August–November). The landscape is covered by old secondary forests, semideciduous dense forests, young secondary forests and dense evergreen forests. The human population in the Yangambi landscape is c. 141,600 inhabitants (data from Yangambi Registry Office, 2016) and includes the city of Yangambi, which grew from a research campus during colonial times, and villages in the Turumbu and Bamanga sectors.

Fig. 1 The study area in the Democratic Republic of the Congo, comprising Ngazi Forest Reserve and the Yangambi Biosphere Reserve, with the general location of the 71 camera-trap stations. Sources: WWF–MRAC (Yangambi Biosphere Reserve limits) and CIFOR.
Methods
Data collection
Mapping the area
We carried out a participatory mapping exercise of the Yangambi landscape with small groups of hunters from 10 villages. On a large flipchart on which we had previously indicated the main road, the villages surrounding the Reserve, and the Congo and Aruwimi Rivers, we asked hunters to spatialize other landscape features such as hunting trails, hunting/fishing camps, river crossing points, marshy areas, logging roads and artisanal mining camps. Then, with guidance and permission from village leaders and to calibrate the map scale, we walked each trail with a GPS on track mode, marking the positions of the various features. The resulting map provided information for planning the deployment of cameras and key landscape information for occupancy modelling.
Survey design and camera-trap deployment
The objectives of the camera-trap survey were to assess relative abundance, species composition, demographic variables and activity patterns for selected species. We used systematic randomized sampling over a 4.2 × 4.2 km grid (to ensure independence between observations) covering the Yangambi Biosphere Reserve and Ngazi. Based on the mean size of home ranges for most medium-sized mammal species in our study area (duikers, rodents, the red river hog Potamochoerus porcus, small monkeys, small carnivores, the okapi Okapia johnstoni), we assumed site independency.
There were 71 survey sites in two blocks, covering almost the entire area: 32 in Ngazi and 39 in Yangambi (Fig. 1). Camera trapping occurred in both blocks for nearly 2 months each year during 2018–2021. The survey season varied between years and blocks but in general covered both rainy and dry seasons during August–January.
We positioned cameras in the same location every year, choosing locations to maximize detection probabilities. At each camera station, we cleared the field of vision by removing large leaves and any other major obstacles in front of the camera. We secured the cameras to trees (30–40 cm above the ground) and locked them to prevent theft. We did not use bait. After placing each camera, the team recorded the camera identification number, date, time, location coordinates, orientation of the camera, name of the researcher and any other information that we deemed important.
Data analysis
Identification of species
We identified terrestrial mammals based on the visible features captured on photographs and confirmed species identity following Kingdon & Hoffmann (Reference Kingdon and Hoffmann2013). Photographs of unidentified species were excluded from the analysis. We treated Genetta species as one group (Gaubert et al., Reference Gaubert, Papeş and Peterson2006). We observed the black-fronted duiker Cephalophus nigrifrons, Peters' duiker Cephalophus callipygus and white-bellied duiker Cephalophus leucogaster in the camera-trap photographs at least once and their occurrence in the study areas was confirmed by local hunters who name them afoli, mungala and alolu in Turumbu, respectively. However, we could not identify them to species level in all photographs in which we detected them, and therefore we grouped them together as diurnal red duikers. Only one murid rodent species was sufficiently large and distinctive to be reliably identified in the camera-trap images: Emin's pouched rat Cricetomys emini. We discarded all other murid and shrew species from the analysis.
We derived standard descriptors of the mammal community based on independent detection records, defined as consecutive images of the same species taken > 30 min apart (O'Brien et al., Reference O'Brien, Kinnaird and Wibisono2003). We excluded arboreal species from the species relative abundance index and dynamic community model estimations.
Standard descriptors of the medium-sized and large terrestrial mammal community
We computed the species relative abundance index at each station for each year based on the species detection frequencies; i.e. the total number of independent detections of a particular species divided by the total number of trap-days on which the particular camera-trap station was recording (O'Brien et al., Reference O'Brien, Kinnaird and Wibisono2003). We multiplied this by 100 to facilitate comparisons with previous studies. Following the protocol of Zipkin et al. (Reference Zipkin, Royle, Dawson and Bates2010), we fitted a single dynamic community model with data augmentation (Royle et al., Reference Royle, Dorazio and Link2007; Royle & Dorazio, Reference Royle and Dorazio2012) to estimate baseline (i.e. 2018) occupancy and the dynamic parameters that govern changes in occupancy across the subsequent 3 years of surveys and in relation to a suite of environmental and human disturbance covariates. Through the data augmentation, the model also allowed us to estimate species richness. As low detection probabilities could prevent model convergence and lead to spurious parameter estimations (MacKenzie & Kendall Reference Mackenzie and Kendall2002, Dillon & Kelly Reference Dillon and Kelly2007), we increased the species detection probability by considering a single sampling occasion as 15 consecutive trap-days and collapsed the species detection frequencies accordingly, to ensure a minimum of three sampling occasions per season. We assessed species richness by augmenting the observed number of species by 250%. We conducted the analysis in JAGS using the jagsUI package (Kellner, Reference Kellner2018) implemented in R 4.2.1 (R Core Team, 2017).
We formulated the dynamic community model following Kéry & Royle (Reference Kéry and Royle2020), as a construction of the following conditional probability statements:
-
Superpopulation process: wk ~ Bernoulli(Ω)
-
Initial state (t = 1): zi ,1,k|wk ~ Bernoulli(wkψ 1,i,k)
-
State dynamic (t > 1): zi ,t+1,k|wk,zi ,t,k ~ Bernoulli(wk (zi ,t,kΦi ,t,k + (1 − zi ,t,k)γi ,t,k))
-
Observation process: yi ,j,t,k|zi ,t,k ~ Bernoulli(zi ,t,kpi ,j,t,k)
where w is a random variable that indicates that species are part of the meta-community (M is augmented species richness = observed + potential species), Ω is a community occupancy parameter (where MΩ corresponds to the meta-community size, regional community size or gamma diversity; Iknayan et al., Reference Iknayan, Tingley, Furnas and Beissinger2014), z is the true species occurrence state; y is observation data, as represented by the species detection history, ψ 1 is the initial occupancy probability (t = 1), Φ is the persistence probability (t > 1), γ is the colonization probability (t > 1), p is the detection probability and subscripts correspond to species (k), sampling occasion (j), sampling site (i) and sampling season (i.e. year, t).
Hierarchical occupancy-based models such as dynamic community models assume that the latent state processes (i.e. initial occupancy, persistence and colonization probabilities) do not vary within the sampling seasons (the closure assumption; MacKenzie et al., Reference MacKenzie, Nichols, Lachman, Droege, Royle and Langtimm2002). Following MacKenzie et al. (Reference MacKenzie, Nichols, Royle, Pollock, Bailey and Hines2006), we interpreted initial occupancy probability as the probability of a randomly selected station being used by a species at any time during the 2018 survey. Persistence refers to the proportion of stations being used at any time during a sampling season if they had been used at any time during the previous season. Colonization refers to the proportion of stations being used at any time during a season if these had not been used at any time during the previous sampling season.
We fitted seven site variables that we assumed quantify both environmental and potential human disturbance processes in our dynamic community model, to examine their effects on the initial occupancy, persistence, colonization and detection probabilities, both at the community and at the species levels, as follows: (1) per cent of forest cover within a 2-km radius, (2) per cent of recent deforestation within a 4-km radius, and distance to nearest (3) hunting trail, (4) river, (5) village, (6) road and (7) hunting/fishing camp site. We calculated per cent of forest cover using global forest change layers (Hansen et al., Reference Hansen, Potapov, Moore, Hancher, Turubanova and Tyukavina2013), based on the proportion of pixels classified as forest at a 90% threshold within a 2-km radius of camera-trap stations. Similarly, we calculated the per cent of recent deforestation within a 4-km radius as the proportion of pixels classified as forest at a 90% threshold in previous years (2000–2018) but not in 2019 (i.e. forest loss). We defined this threshold subjectively as 90%, given that the study area is characterized by dense semideciduous and evergreen forests. We also fitted three variables to detection probability: (1) effort, (2) mean monthly precipitation and (3) whether the camera station was facing a hunting trail or not. We estimated mean monthly precipitation as the mean of the monthly rainfall recorded at the Kisangani meteorological station during 1927–1996 (WMO, 2020). We considered monthly precipitation to account for the potential effect of seasonality on species detection probability as we did not survey on the same dates each year. To avoid confounding effects, we tested for correlation amongst the seven habitat covariates and retained only one of the correlated variables for the dynamic community model construction. We assumed variables to be correlated when r > 0.7. In addition, we z-standardized all covariates (μ = 0, SD = 1), facilitating posterior comparison of the effects amongst covariates and model convergence (Stanton et al., Reference Stanton, Thompson and Kesler2015).
Descriptive statistics (mean, SD, minimum and maximum values) for each of the variables considered are summarized in Supplementary Table 1. We considered as important those station and detection covariates for which 95% of the posterior distribution (i.e. 95% credible interval) of the β coefficient excluded zero.
Species activity patterns
We explored activity patterns only for those species with a standardized relative abundance index > 1 (Table 1). We assumed (1) that the likelihood of obtaining a species record was the same throughout the 24-h time period, (2) that the species activity behaviour did not change throughout the monitoring period and (3) that species behaviour did not affect the probability of detection across all camera traps. Daytime and night-time lengths in the study area are almost constant throughout the year, with sunrise at c. 6.00 and sunset at c. 18.00. Thus, we considered nocturnal activity as that which occurred during 19.00–5.00, diurnal activity as that during 7.00–17.00, and crepuscular activity as that during 5.00–6.00 and 17.00–18.00. We rounded the time of detection up or down to the nearest full hour for analysis. We used periodic regression models to infer daily activity patterns of species by implementing circular techniques (Zar, Reference Zar1996) on the hourly counts of the species and as a function of continuous trigonometric variables describing single and double complete cycles (sinθ, sin2θ, cosθ, cos2θ; where θ = 2πt/24 and t = 24 hours). For each species, we tested all possible models built upon all possible combinations of variables and selected the best model based on the Akaike information criterion corrected for small sample size (AICc). We conducted the statistical analysis using the R packages MuMIn (Bartoń, Reference Bartoń2019) and AICcmodavg (Mazerolle, Reference Mazerolle2017) and we visualized activity patterns using Plotrix (Lemon, Reference Lemon2006).
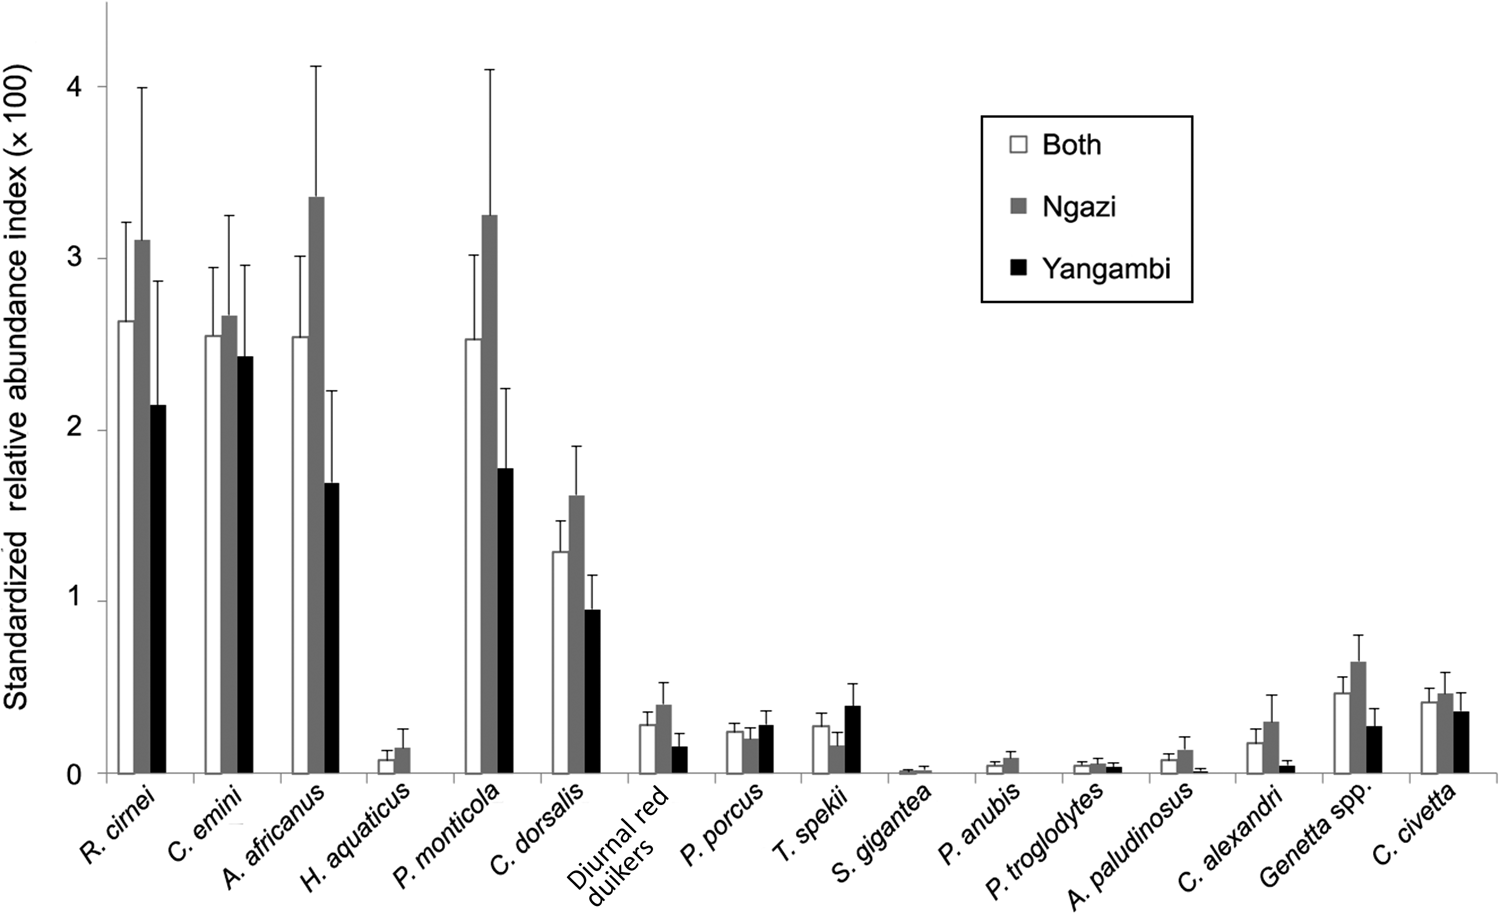
Table 1 Number of independent camera-trap detections of all mammals in Ngazi Forest Reserve and in the Yangambi Biosphere Reserve, Democratic Republic of the Congo (Fig. 1), during 2018–2021. Species marked with * indicate arboreal mammals that were excluded from the standardized relative abundance index (RAI) and the dynamic community modelling (Fig. 2).

1 LC, Least Concern; NT, Near Threatened; VU, Vulnerable; EN, Endangered.
2 Possibly including Cephalophus nigrifrons, Cephalophus leucogaster and Cephalophus callipygus. These were grouped and treated as one entity in the dynamic community model analysis.
3 An overall RAI was estimated for all species of Genetta, which were treated as a single entity in the dynamic community model analysis.
Results
Because of technical failures and damage by people, the total number of camera-trap stations varied between years (Supplementary Table 2). In total, we obtained 1,927 detections during the 4-year monitoring period (10,902 camera-trap nights), corresponding to 26 mammal taxa (species or groups of species), with 19 taxa in Yangambi and 24 in Ngazi (Table 1), of which 16 are predominantly terrestrial and 10 are arboreal. We only detected four terrestrial species in Ngazi (Table 1): the water chevrotain Hyemoschus aquaticus, African palm civet Nandinia binotata, giant ground pangolin Smutsia gigantea and olive baboon Papio anubis. We recorded four species categorized as threatened on the IUCN Red List: the arboreal black-bellied pangolin Phataginus tetradactyla (Vulnerable), white-bellied pangolin Phataginus tricuspis (Endangered), the predominantly terrestrial giant ground pangolin (Endangered) and chimpanzee Pan troglodytes (Endangered). Arboreal species are infrequently detected by camera traps deployed on the ground and so we removed these from the subsequent analysis.
Overall, there were 0.17 independent events per camera-trap day. The most commonly detected species were the checkered elephant shrew Rhynchocyon cirnei, rodents (C. emini and African brush-tailed porcupine Atherurus africanus) and the small blue duiker Philantomba monticola. The bay duiker Cephalophus dorsalis exhibited intermediate abundance (1.29), whereas large ungulates (i.e. red diurnal duikers, red river hog and sitatunga Tragelaphus spekii) and medium-sized carnivores (Alexander's kusimanse Crossarchus alexandri, genets Genetta spp. and African civet Civettictis civetta) exhibited low abundances (relative abundance index < 1). Primates and giant ground pangolins were rare (Fig. 2). Species exhibited higher abundances in Ngazi than in Yangambi. These abundance patterns were similar across years.
Distance to nearest hunting trails and to hunting/fishing camp sites were highly correlated (r > 0.7; Supplementary Table 3), so we discarded the latter from the dynamic community model analysis. In general, all terrestrial mammals exhibited low naïve occupancy, as we detected most species in < 10% of sites each year (Table 2). The augmented number of species (M) used for the dynamic community model was 40, including 16 observed and 24 potential or unobserved species. The estimated mean community occupancy probability (Ω) was 0.40 (95% credible interval = 0.26–0.55; Table 3), suggesting that the maximum regional community size or gamma diversity is 22 species (MΩ 97.5%). This indicates that a maximum of six species could potentially colonize the study area. In the Yangambi landscape, the estimated terrestrial mammal community size was the same as the total number of observed species (N total in Table 3), confirming the representativeness of our survey. However, overall, only 33% of the true number of species present at each camera-trap station were detected. The estimated number of species recorded at each camera-trap station did not vary across years but in general was higher in Ngazi than in Yangambi.
Table 2 Annual naïve occupancy of terrestrial mammals in Ngazi Forest Reserve and the Yangambi Biosphere Reserve (Fig. 3). Species with at least one annual naïve occupancy > 0.10 are marked with *.

Table 3 Estimated community parameters based on the dynamic community model with data augmentation (see text for details).

1 All parameter estimates (except ω and the estimated community size N total) are in the logit scale. α, estimated intercept; β, effect coefficient for initial occupancy probability (ψ1), persistence probability (Φ), colonization probability (γ) and detection probability (p).
2 Gelman–Rubin convergence diagnostic statistic.
3 Effective sample size.
4 If the 95% credible interval of the posterior distribution overlaps zero.
Mean initial community occupancy probability (ψ 1) was correlated negatively to per cent of neighbouring deforestation at a 16-km2 scale, whereas mean community persistence probability (Φ) was correlated positively with distance to the nearest road (Fig. 3, Table 3). Overall, a low mean colonization probability (γ) was estimated at the community level, and this was particularly low for 2019 (Table 3). At both the community and the species levels, mean detection probabilities (p) were low and, in all cases, correlated positively with sampling effort (Table 3 & Supplementary Table 4). Of the species with detection probabilities higher than the estimated value at the community level (p > 0.11), C. emini, C. dorsalis and A. africanus had high initial occupancy probabilities (ψ 1 > 0.5) and, along with P. monticola, high persistence probabilities (Φ > 0.5; Table 4). The initial occupancy of R. cirnei was correlated negatively with both forest cover at a 4-km2 scale and proportion of deforested areas at a 16-km2 scale (Supplementary Table 4). A similar pattern was predicted for the initial occupancy of P. monticola in relation to degraded areas. The persistence of C. dorsalis, P. monticola and Genetta spp. was correlated positively with distance to the nearest road, whereas colonization of R. cirnei was correlated positively with distances to the nearest hunting trail and town (Supplementary Table 4).

Fig. 3 Relationship of the initial occupancy (left) and persistence (right) probabilities at the community level of terrestrial mammals detected by camera traps in Ngazi Forest Reserve and Yangambi Biosphere Reserve combined, with per cent deforestation at a 16-km2 scale and distance to nearest road, respectively. Thin grey lines are 800 random samples obtained from the Markov chain Monte Carlo posterior samples, thicker black and red lines are the mean and the lower and upper 95% credible intervals of the posterior distribution, respectively.
Table 4 Summarized dynamic state parameters at the community and species levels based on the global dynamic community model with data augmentation used. Species with higher detection probability (p) than that estimated at the community level are marked with *.

1 Initial occupancy probability.
2 Persistence probability.
3 Colonization probability.
Activity patterns are shown in Fig. 4. Cephalophus dorsalis was exclusively nocturnal (20.00–4.00), whereas P. monticola was exclusively diurnal (7.00–11.00, with a peak at 8.00). Amongst the rodents, C. emini and A. africanus were exclusively nocturnal, whereas R. cirnei was exclusively diurnal.

Fig. 4 Periodic regression analysis of the activity patterns of the five most commonly detected species in Ngazi Forest Reserve and Yangambi Biosphere Reserve during the 4-year monitoring period. The plot is divided into hours, with the response radial axis corresponding to the proportion of detections in each hour. Observations are shown as continuous black lines and the predicted distributions based on the best adjusted model are shown as dashed lines.
Discussion
Our study provides the first assessment of the terrestrial mammals of the Yangambi landscape since the designation of the Biosphere Reserve in the late 1970s, advancing our understanding of how this landscape contributes to biodiversity conservation. Of the 23 terrestrial mammal taxa (species or groups of species) observed by hunters in the Yangambi landscape over the previous 5 years (listed in van Vliet et al., Reference van Vliet, Muhindo, Nyumu, Mushagalusa and Nasi2018), we confirmed the presence of 16, including two terrestrial threatened species: P. troglodytes and S. gigantea. In addition, although arboreal species were not the focus of our study, we confirmed the presence of two additional threatened species: the black-bellied and white-bellied pangolins. The presence of the African forest buffalo Syncerus caffer nanus, yellow-backed duiker Cephalophus silvicultor, aardvark Orycteropus afer, okapi, bushbuck Tragelaphus scriptus, greater cane rat Thryonomys swinderianus and leopard Panthera pardus was not confirmed by our camera traps, despite observations by local hunters over the previous 5 years (van Vliet et al., Reference van Vliet, Muhindo, Nyumu, Mushagalusa and Nasi2018). Thryonomys swinderianus thrives in deforested areas, cultivated land and savannah. Its absence from our camera-trap photographs could be explained by the fact that no cameras were sited at the periphery of the Reserve or on farmland. The absence of the other species suggests they have been extirpated from the study area or have no established populations there.
Our assessment also confirms the depletion suggested for the Yangambi landscape based on the knowledge of hunters (van Vliet et al., Reference van Vliet, Muhindo, Nyumu, Mushagalusa and Nasi2018). The landscape has a lower mean estimated community occupancy and species richness than other conservation areas in the Congo Basin (Bruce et al., Reference Bruce, Amin, Wacher, Fankem, Ndjassi and Ngo Bata2018; Hedwig et al., Reference Hedwig, Kienast, Bonnet, Curran, Courage and Boesch2018; Orban et al., Reference Orban, Kabafouako, Morley, Vasicek Gaugris, Melville and Gaugris2018; Bessone et al., Reference Bessone, Kühl, Hohmann, Herbinger, N'Goran and Asanzi2020; Nakashima et al., Reference Nakashima, Hongo and Akomo-Okoue2020; van der Hoek et al., Reference van der Hoek, Binyinyi, Ngobobo, Stoinski and Caillaud2023). The species profile was characterized by the high representation of four species (C. emini, A. africanus, P. monticola and C. dorsalis) that are known to be common and highly resilient to hunting. Large ungulates and medium-sized carnivores exhibited particularly low abundances. The absence of C. silvicultor and of larger carnivores also confirms the depletion profile. Although according to the hunters the extirpation of large and threatened species (e.g. elephants) began at the time of political conflicts in the late 1990s and was linked to the presence of armed groups, more recent declines in mammal abundance are linked to hunting for food (van Vliet et al., Reference van Vliet, Muhindo, Nyumu, Mushagalusa and Nasi2018) in a context in which the local economy has collapsed and local communities could only survive through widespread occupation of the Reserve (Kipute et al., Reference Kipute, Mampeta, Kahindo, Lelo, Sufo Kankeu and Sonwa2021). Nevertheless, besides hunting, our study highlights other pressures on wild mammals: the road network and deforestation are negatively affecting the already depleted wildlife in the Yangambi landscape.
In the context of the multiple-use landscape around the Yangambi Biosphere Reserve and to reconcile the conservation of biodiversity with its sustainable use, it is unclear whether and under what circumstances the Reserve can continue to serve as a sustainable source of food whilst preserving biodiversity. Despite the low colonization probability observed at the community level, persistence probabilities for species with high detection rates were p > 0.5 for C. emini, P. monticola, C. dorsalis and A. africanus, indicating stability for a few resilient species that are highly preferred by hunters and wildmeat consumers. Although abundance at the community level is amongst the lowest recorded with camera traps in the Congo Basin, the relative abundance index for these four species lies within the range recorded in Nkuba Conservation Area, in a neighbouring province of the Democratic Republic of the Congo (van der Hoek et al., Reference van der Hoek, Binyinyi, Ngobobo, Stoinski and Caillaud2023). None of the most abundant species exhibited significant avoidance of hunting trails, suggesting these highly resilient species do not avoid areas frequented by hunters. We hypothesize that for these species, the following biological and ecological factors help to maintain their populations: high reproductive rates (e.g. rodents; Happold, Reference Happold1987), micro-scale source–sink dynamics (e.g. P. monticola; Mockrin et al., Reference Mockrin, Rockwell, Redford and Keuler2011) and modifications of diel activity patterns. Philantomba monticola, which usually has bimodal daily activity (Dubost, Reference Dubost1980; Bowland & Perrin, Reference Bowland and Perrin1995; Houngbégnon et al., Reference Houngbégnon, Cornelis, Vermeulen, Sonké, Ntie and Fayolle2020), exhibited only one activity peak in our study area. This could be interpreted as the species avoiding the hours during which hunters are active, but our data do not allow us to confirm this hypothesis.
From a conservation perspective, the management of wildlife in the Yangambi landscape should seek to limit further biodiversity loss. This could be achieved by enforcing no-harvest rules for the four threatened species and protecting them by national law. Preventing these species from being hunted would not affect local food security (van Vliet et al., Reference van Vliet, Nyumu, Nziavake, Muhindo, Paemelaere and Nasi2022) because chimpanzees and pangolins are not among the most preferred species, they only represent an insignificant portion of the catch, and do not have a greater commercial value for their meat than other commonly found species. Key to the success of such enforcement measures is the development of inclusive systems that empower local governance structures to make decisions and enforce local rules over wildlife, avoiding errors of top-down regulation that have occurred in the Yangambi Biosphere Reserve in the past (Koy et al., Reference Koy, Wardell, Mikwa, Kabuanga, Monga Ngonga, Oszwald and Doumenge2019). The process also needs to foster positive behavioural change, such as through the increased involvement of hunters in wildlife research, environmental education of youth, increased livelihood opportunities that do not affect wildlife and a strategy to address human–wildlife conflict (van Vliet et al., Reference van Vliet, Nyumu, Nziavake, Muhindo, Paemelaere and Nasi2022).
Our results highlight the need to consider wildlife conservation at the landscape level, maintaining connectivity between the logging concession (particularly in Ngazi) and the Yangambi Biosphere Reserve. Ngazi harbours species that were absent from the Reserve, and some that showed higher occupancy levels than in the Reserve. In addition, we highlight the need to carefully plan road development for timber-related activities and to reduce forest degradation from logging and the development of permanent cash crop agriculture.
Overall, our findings suggest that the Yangambi landscape needs to be managed with two principal purposes: ensure the persistence of the most hunted species, to guarantee local food security, and reverse the decline of the most threatened species. These can only be achieved by involving local constituencies in identifying and enforcing sustainable hunting rules, controlling access to hunting grounds, reducing habitat destruction originating from unplanned road expansion and agriculture, and enforcing hunting bans on the most susceptible species following the national law. Such landscape-level conservation efforts will only be possible if a collaborative management model steered by local communities is developed with the participation of all constituencies.
Acknowledgements
We thank the village leaders and hunters who participated in this study, SODEFOR for their constructive comments, and the FORETS project for support. This research received funding from USAID and the European Union. It is part of the Bushmeat Research Initiative from Center for International Forestry Research under the framework of the CGIAR Research Programme on Forests, Trees, and Agroforestry.
Authors contributions
Study design and fieldwork: NvV, JM, JN; data management and analysis: SQ; writing: NvV, SQ; manuscript revision; FR, PC, RN.
Conflicts of interest
None.
Ethical statement
This research abided by the Oryx guidelines on ethical standards, and those of the Center for International Forestry Research. This research was authorized under the International Institute of Tropical Agriculture's Host Agreement in the Democratic Republic of the Congo.


 Open access