


“Completeness and informativeness are not strictly coupled.”
Donoghue et al. Reference Donoghue, Doyle, Gauthier, Kluge and Rowe1989: p. 454.
“Time is on my side, yes it is./Time is on my side, yes it is.”
Jerry Ragovoy,
American songwriter, 1963
Introduction
Both paleontologists and comparative biologists would like to look into the past to understand the history of life on Earth and the underlying evolutionary processes that led to the biological world of today. Both disciplines collect evidence about the nature of ancient life in deep time. For paleontologists, the evidence comes primarily from the fossil record; for comparative biologists, the evidence comes primarily from living organisms. The inferences drawn from one record sometimes conflict with the other (e.g., dos Reis et al. Reference dos Reis, Thawornwattana, Angelis, Telford, Donoghue and Yang2015; Foley et al. Reference Foley, Springer and Teeling2016), but today many paleontologists and comparative biologists are working to reconcile these apparent discrepancies. One way of doing this is to incorporate fossil taxa into molecular phylogenetic hypotheses and ensuing comparative analyses. While emerging “tip-dating” methods promise to change the face of systematic biology and paleontology (Pyron Reference Pyron2011; Ronquist et al. Reference Ronquist, Klopfstein, Vilhelmsen, Schulmeister, Murray and Rasnitsyn2012; Donoghue and Yang Reference Donoghue and Yang2016; Hunt and Slater Reference Hunt and Slater2016; Gavryushkina et al. Reference Gavryushkina, Heath, Ksepka, Stadler, Welch and Drummond2017; Wright Reference Wright2017), we need to address how the relationship between sampling and time differs between the fossil record and the “molecular record,” by which we mean the record of evolutionary processes found through the phylogenetic analysis of molecular data. Comparative biologists and paleontologists use different types of data that vary fundamentally in their association with time, and this discrepancy has far-reaching and underappreciated implications for macroevolutionary analysis. Beyond impacting how we derive accurate ages for individual specimens or calibrate divergence dates, this discrepancy complicates efforts to reconcile, compare, or combine these two records and influences how comparative biologists and paleontologists view the past. In this paper, we summarize some recent work that demonstrates how these two records can complement each other in spite of their respective limitations. We then outline challenges that remain, focusing particularly on those that arise in the context of sampling and time, and propose some research directions for overcoming them.
Two Limited but Complementary Records of Life
Paleontologists directly observe the remains and traces of life contained within rocks formed long ago. However, paleontologists must work with an incomplete picture: most individual organisms are not preserved or sampled, and those that have been are represented by only some anatomical parts and are usually chemically altered. In contrast, comparative biologists can employ any number of ecological, molecular, morphological, developmental, and behavioral approaches to study change in modern species and populations. However, even though it is theoretically possible to collect all of these different types of data for all living organisms, it is not practical to do so. Furthermore, as comparative biologists move their perspective backward in time, their inferences become more dependent on extrapolating observations from living organisms, across reconstructed relationships from molecular data, and thus their view of the past moves out of focus and loses precision as they look further back in time. Both records have limitations that will never be completely surpassed.
However, what is missing from one record is often available from the other. The fossil record supplies a direct record of past diversity that frequently includes character combinations, ecological associations, and distributions that are not inferable from analyses of recent taxa alone. For example, recent molecular phylogenies of mammals (e.g., dos Reis et al. Reference dos Reis, Inoue, Hasegawa, Asher, Donoghue and Yang2012) predict that the two families of modern sloths diverged between 50 and 20 Ma. Morphological phylogenetic analysis including fossils makes the same prediction (Raj Pant et al. Reference Raj Pant, Goswami and Finarelli2014: Fig. 2). In addition, the ancestral body size that would be reconstructed from modern species is similar to that of the oldest and most basal fossil of this group (Pseudoglyptodon; see Raj Pant et al. Reference Raj Pant, Goswami and Finarelli2014: Fig. 2). Thus in terms of the age and body size of the ancestral root, the molecular and fossil records are incredibly consistent. However, between 30 Ma and the present, the fossil sloth species (of which there are 51) included a large range in body size, some three orders of magnitude greater in body size than any extant species (of which there are 6) (Raj Pant et al. Reference Raj Pant, Goswami and Finarelli2014). This discrepancy is due to sampling of extinct species in the fossil record that are not available from the molecular record. Similarly, dated molecular phylogenies suggested that lignin-decomposing fungi did not evolve until the Permian (Floudas et al. Reference Floudas, Binder, Riley, Barry, Blanchette, Henrissat, Martínez, Otillar, Spatafora, Yadav, Aerts, Benoit, Boyd, Carlson, Copeland, Coutinho, de Vries, Ferreira, Findley, Foster, Gaskell, Glotzer, Górecki, Heitman, Hesse, Hori, Igarashi, Jurgens, Kallen, Kersten, Kohler, Kües, Kumar, Kuo, LaButti, Larrondo, Lindquist, Ling, Lombard, Lucas, Lundell, Martin, McLaughlin, Morgenstern, Morin, Murat, Nagy, Nolan, Ohm, Patyshakuliyeva, Rokas, Ruiz-Dueñas, Sabat, Salamov, Samejima, Schmutz, Slot, John, Stenlid, Sun, Sun, Syed, Tsang, Wiebenga, Young, Pisabarro, Eastwood, Martin, Cullen, Grigoriev and Hibbett2012; Kohler et al. Reference Kohler, Kuo, Nagy, Morin, Barry, Buscot, Canback, Choi, Cichocki, Clum, Colpaert, Copeland, Costa, Dore, Floudas, Gay, Girlanda, Henrissat, Herrmann, Hess, Hogberg, Johansson, Khouja, LaButti, Lahrmann, Levasseur, Lindquist, Lipzen, Marmeisse, Martino, Murat, Ngan, Nehls, Plett, Pringle, Ohm, Perotto, Peter, Riley, Rineau, Ruytinx, Salamov, Shah, Sun, Tarkka, Tritt, Veneault-Fourrey, Zuccaro, Tunlid, Grigoriev, Hibbett and Martin2015). This implies that that the abundant coal deposition of the Carboniferous could have been caused by the absence of these lignin decomposers. Nelsen et al. (Reference Nelsen, DiMichele, Peters and Boyce2016) refuted this by documenting the presence of lignin decomposition in the fossil record as early as the Devonian and by noting that the primary source of Carboniferous coal is the lignin-poor periderm in fossil lycopsids.
Our understanding of highly diverse modern clades is also dramatically improved by fossil data, particularly for those with long evolutionary histories. For example, arthropods are tremendously diverse today (Minelli et al. Reference Minelli, Boxshall and Fusco2013), but much of known fossil arthropod diversity—both taxonomic and morphological—exists in completely extinct clades (Edgecombe and Legg Reference Edgecombe and Legg2013; Smith and Marcot Reference Smith and Marcot2015). In fact, morphological diversity was as great in the Cambrian (~510 Ma) as it is among modern arthropods (Briggs et al. Reference Briggs, Fortey and Wills1992). The morphological diversity of the Cambrian was dominated by groups that are long extinct, but the fossil record also provides insight on living arthropod clades. For example, crustacean morphological diversity increased substantially from the Cambrian to the early Carboniferous (~350 Ma) but has remained relatively constant since that time (Wills Reference Wills1998). Molecular phylogenetics has made considerable progress in deciphering relationships within and among major arthropod clades, but it is becoming increasingly evident that obtaining a more accurate arthropod tree—and a deeper understanding of trait homology and evolution, divergence times, and clade origin and radiation—will require incorporating fossil taxa (Edgecombe Reference Edgecombe2010; Legg et al. Reference Legg, Sutton and Edgecombe2013; Garwood et al. Reference Garwood, Sharma, Dunlop and Giribet2014; Yang et al. Reference Yang, Ortega-Hernández, Butterfield, Liu, Boyan, Hou, Lan and Zhang.2016). This is surely true for other groups as well, particularly those with deep divergences among extant clades or considerable past diversity (e.g., Donoghue et al. Reference Donoghue, Doyle, Gauthier, Kluge and Rowe1989; Littlewood and Smith Reference Littlewood and Smith1995; Springer et al. Reference Springer, Teeling, Madsen, Stanhope and de Jong2001; Crane et al. Reference Crane, Herendeen and Friis2004; Hermsen and Hendricks Reference ermsen and Hendricks2008; Gauthier et al. Reference Gauthier, Kearney, Maisano, Rieppel and Behlke2012; Slater et al. Reference Slater, Harmon and Alfaro2012; Gavryushkina et al. Reference Gavryushkina, Welch, Stadler and Drummond2014; Sutton et al. Reference Sutton, Perales-Raya and Gilbert2015). A similarly diverse set of extinct cnidarians must also have existed that remain invisible in the fossil record due to lack of skeletons and invisible in the molecular phylogenetic record due to lack of living representatives (Tweedt and Erwin Reference Tweedt and Erwin2015).
Complementary to the fossil record, through comparative analysis, the molecular record can offer insight on what taxa might be missing from the fossil record, especially for certain time periods and environments. This is obviously the case for groups that have low preservation potential, but it is also true for groups that are well represented in the fossil record. For example, molecular phylogenies suggest that photosymbiosis in corals has been repeatedly gained and lost over their evolutionary history (Barbeitos et al. Reference Barbeitos, Romano and Lasker2010; Kitahara et al. Reference Kitahara, Cairns, Stolarksi, Blair and Miller2010). This pattern of gain and loss means that the commonly deep-sea azooxanthellate corals must have had a deep and diverse evolutionary history and that zooxanthellate and azooxanthellate corals have been nearly equally diverse over the last 200 Myr (Simpson Reference Simpson2013). The fossil record has not historically supported this (Stanley and Cairns Reference Stanley and Cairns1988; Gill et al. Reference Gill, Santantonio and Lathuiliere2004), possibly because of lower preservation of deep-water sediments compared with shallow-water sediments in the rock record. However, more recent work has closed the gap in diversity estimates of these two coral groups as the deep-sea record that does exist becomes more evenly sampled (Kiessling and Kocsis Reference Kiessling and Kocsis2015).
The limitations of the molecular and fossil records are independent, because the potential of a lineage surviving to today has little to do with that lineage’s potential to leave identifiable remains in the fossil record. This is not always apparent: often there is similarity in the identity of the taxa that can be sampled from each record, implying similar systematic biases. This is, however, largely coincidental. For example, it may seem likely that charismatic species in easy-to-reach places that are abundant in the present day will have very good molecular and fossil records, as is the case for canids (e.g., Slater Reference Slater2015). However, taxa that are abundant now were not always or necessarily abundant in the past, nor are their fossils always or necessarily preserved in the same places that their living descendants occupy (e.g., Mayr Reference Mayr2004). The same can be said for other putative examples that might influence sampling and, thus, perceived diversity, such as geographic breadth or a tendency for one clade to be taxonomically oversplit. Instances in which the molecular and fossil records are demonstrably not independent are due to socioeconomic or political factors. For example, that both living and fossil canid species are charismatic may drive funding opportunities, and thus increase sampling effort of both records. Similarly, living and fossil species of many groups are undersampled in politically unstable areas of the world.
This independence can be used to one’s advantage. In the case of reef-dwelling scleractinians, there are taxonomic uncertainty and preservational/sampling issues in the fossil record and poor taxon sampling and uncertainty in topology and node–age reconstructions based on the molecular record. Given these factors and difficulty in estimating extinction from molecular phylogenies (e.g., Rabosky Reference Rabosky2010; for more recent discussion, see Beaulieu and O’Meara Reference Beaulieu and O’Meara2015; Rabosky Reference Rabosky2016; Mitchell et al. Reference Mitchell, Etienne and Rabosky2018), Simpson et al. (Reference Simpson, Kiessling, Mewis, Baron-Szabo and Müller2011) expected there to be differences between molecular- and fossil-derived rates of extinction. They focused instead on the temporal pattern of net diversification rates (i.e., the speciation rate minus extinction rate) in both the species-level fossil occurrence data and larger molecular data sets, effectively comparing the molecular clock–derived node ages against the fossil record. This approach revealed that the molecular and fossil records of reef corals show strikingly similar patterns of diversification, and that despite the limitations of either record, neither is flawed to the point of distortion.
Current Challenges: Time versus Sampling
Time and Sampling in the Fossil Record
Both paleontologists and comparative biologists tend to think about each individual fossil specimen as having an age, usually in millions of years ago—and they do, but it is rarely possible to determine the age with absolute precision. This is not only due to “measurement error,” such as that represented by confidence intervals around radiometric dates; rather, the imprecision of geologic dating is a consequence of sedimentary processes and the limitations of radiometric dating (see Patzkowsky and Holland Reference Patzkowsky and Holland2012). Radiometric dates can be obtained directly from fossil material, but only if specimens are of a certain type and not very old (fewer than 50,000 years for carbon dating of bones, teeth, or plant material, and 500,000 years for uranium–thorium dating of calcium carbonate shells). Rock units, such as volcanic tuffs, which can provide much older radiometric ages for calibrating geologic time intervals, are relatively rare, nonuniformly deposited in space and time, and typically non–fossil bearing. The sedimentary rocks that preserve fossils are lithified piles of sand and mud that accumulated over time. Thus, to estimate an age for most fossils, we have to first determine the relative order of deposition of those sediment deposits. Even though the relative age of fossils collected from successive beds at a single outcrop is obvious due to their order from oldest at the bottom to youngest at the top, the relative age of fossils sampled from different localities can be difficult to determine and depends primarily on some similarity in the fossil species preserved. Because rates of sedimentation vary and sediment deposition is locally sporadic, sedimentary strata of the same thickness may represent different amounts of time, and the boundaries between strata may represent different amounts of unpreserved time, even at the same outcrop (Holland Reference Holland2016). The global geologic record is compiled by matching beds or boundaries between beds over large spatial areas, using the fossils contained within them (biostratigraphy), stable isotope data (chemostratigraphy), and regional sedimentary features related to sea-level changes (sequence stratigraphy). An absolute age model is applied primarily by assigning radiometric dates to boundaries that represent the relative position in the sedimentary sequence of dated volcanic beds, where they can be located. A few stage boundaries have direct dates, which means that most boundary ages are estimated by interpolation (Gradstein et al. Reference Gradstein, Ogg, Schmitz and Ogg2012). The preservation of magnetic reversals in association with seafloor spreading has also been used for the last 50 years to calibrate the geologic timescale but can only be applied from the Late Jurassic to the present. Orbital tuning is selectively replacing such “magnetochron” methods, but has its greatest application to deep-sea marine sediments from the Oligocene to the present (Gradstein et al. Reference Gradstein, Ogg, Schmitz and Ogg2012). Despite these challenges, it is possible to build high-resolution global timelines of fossil occurrences scaled to absolute time, including into the Paleozoic (e.g., Sadler Reference Sadler2004; Sadler et al. Reference Sadler, Cooper and Melchin2009), but the resolution of the geological timescale—and the number of fossil occurrences that can be placed within it—varies from study to study, and high-resolution timelines exist mainly for data sets limited to specific taxonomic groups.
For most fossil specimens, what can be determined is the particular interval of geologic time from which that specimen was collected, but not its exact age. The length of this interval can vary considerably. Highly precise geologic records can have very short intervals encompassing single years, in the case of some lake deposits, to thousands of years for deep-sea sediment cores. Conversely, some records can have intervals encompassing staggeringly long amounts of time, such as tens of millions of years for some terrestrial deposits. Most fossil occurrences, however, can be assigned locally to biostratigraphic zones, which can represent tens of thousands to millions of years. Placing such fossil occurrences in a global timescale frequently requires coarsening the resolution to the level of geologic stages. Across the Phanerozoic, the global marine timescale has an average resolution of 5.5 Myr; for just the Cenozoic, this improves to an average of 3.7 Myr.
Fossil taxa are often represented by multiple specimens sampled from multiple collections spanning multiple stratigraphic intervals, giving that taxon a stratigraphic “range” that represents its temporal duration. The oldest and youngest specimens that have been sampled for a fossil taxon represent the “first occurrence” and the “last occurrence,” respectively, of that taxon (other terminology for the same concept includes “first/last appearance” and “first/last appearance datum”) and are used to infer the actual time of speciation and extinction. The same age uncertainty that exists for any fossil specimen (discussed earlier) also applies to these specimens. Specifically, the age of the first and last occurrences can be bracketed within particular intervals of time, but precise ages can only rarely be assigned (Fig. 1). How well the sampled first and last occurrences represent the time of speciation or extinction of the taxon is also an issue of accuracy and has been the subject of considerable paleobiological research (see “Stratigraphic Ranges and Stasis” section).
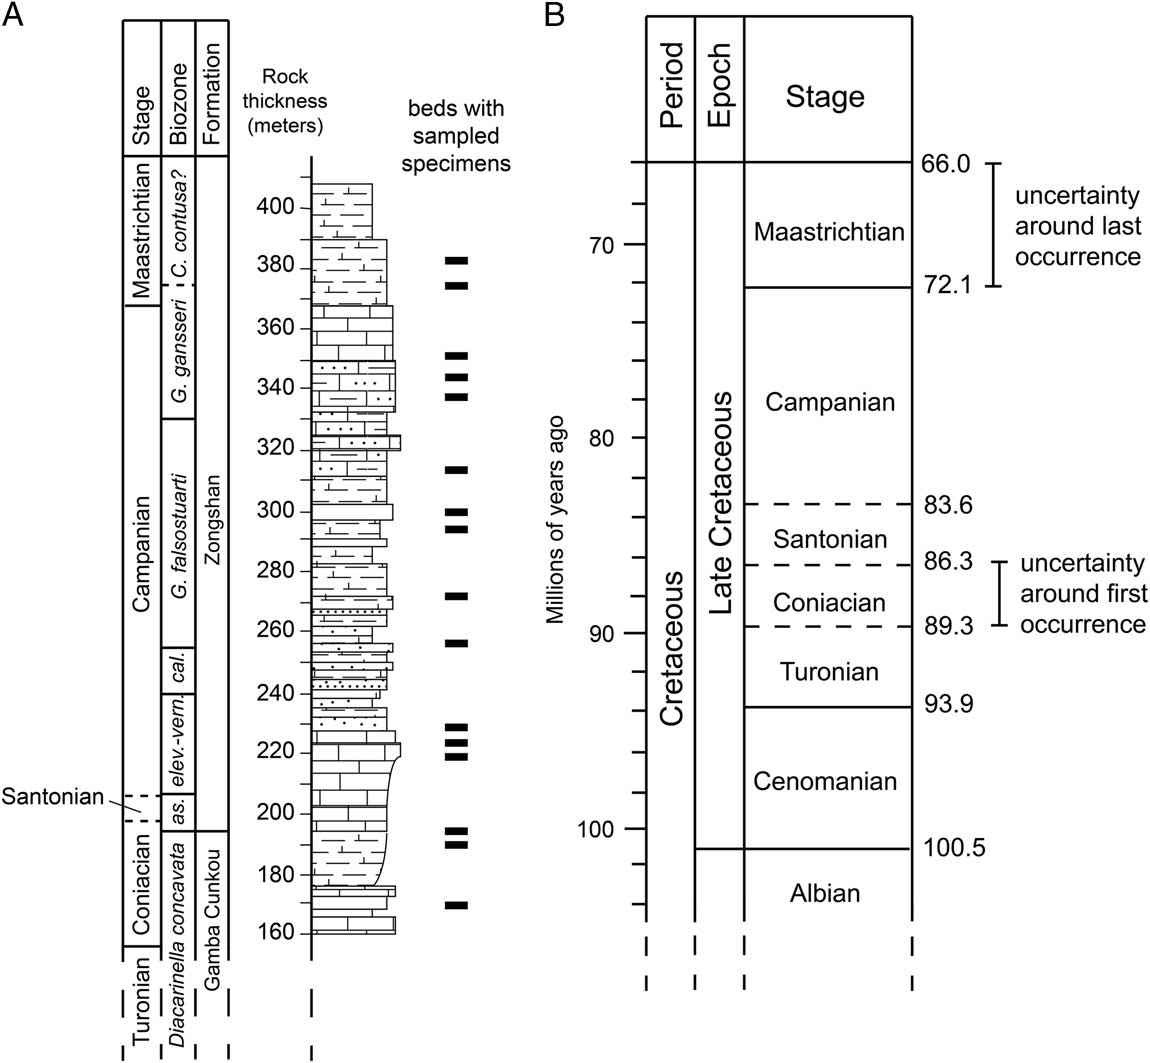
Figure 1 Schematic showing local sampling of fossil specimens of a hypothetical species (A) compared with the uncertainty around first and last occurrences in a global timescale (B). The species was sampled locally from multiple strata, represented by the black bars in A. Strata with the oldest specimens are known to be Coniacian in age based on biostratigraphically useful fossils also sampled from the same strata (indicated by the biozone boundaries). Strata with the youngest specimens are known to be early Maastrichtian in age. If occurrences of this species at other localities also fall within this range, then the global stratigraphic range of this species is considered to be Coniacian to Maastrichtian. At the typical resolution of the global timescale for marine sediments, the lengths of these two stages represent the uncertainty around the global first and last occurrences (about 3 million years and 6.1 million years, respectively). Note that although the Santonian is about as long in temporal duration as the Coniacian (B), each stage is represented locally by different thicknesses of rock (A). The stratigraphic section in A is modeled after the Guru Section in south Tibet (Wendler et al. Reference Wendler, Willems, Gräfe, Ding and Luo2011). Timescale in B based on Gradstein et al. Reference Gradstein, Ogg, Schmitz and Ogg2012.
Time and Sampling in the Molecular Record
In comparison to the fossil record, the relationship between sampling and time is straightforward for living taxa: almost all individuals sampled have a timestamp of sometime in the past 150 years, with very rare exceptions (Leonardi et al. Reference Leonardi, Librado, Der Sarkissian, Schubert, Alfarhan, Alquraishi, Al-Rasheid, Gamba, Willerslev and Orlando2017). At the scale of the evolutionary histories of clades, these individuals are effectively the same age, and we denote this by saying that they were sampled from the Recent.
Assigning Times of Observation
Sampling–time relationships influence how dates are assigned to different biological units. In dated molecular phylogenies, branch tips are inherently linked to observational data sampled from contemporaneous populations. Many comparative approaches assume that the ages of tip taxa are single-point estimates, even if noncontemporaneous data are allowed. This concept of branch tips as instantaneous populations is incongruous with the paleontological concept of species, because morphologically indistinct specimens sampled across millions of years of geologic time are often treated as a single contiguous taxonomic unit (e.g., a “morphospecies”) with a stratigraphic range. Paleontological data thus complicate any analysis in which a taxon needs to be assigned a single precise age, requiring some treatment to deal with persistent morphotaxa and leading to the so-called times of observation problem (Fig. 2; Bapst Reference Bapst2013). Previous studies have assigned fixed ages by sampling from a uniform distribution bounded by the taxon’s stratigraphic range (e.g., Heath et al. Reference Heath, Huelsenbeck and Stadler2014), but the stratigraphic range is distinct from stratigraphic uncertainty in the age of a specimen or the first occurrence of the taxon (see “Time and Sampling in the Fossil Record” section), and the two should not be confounded.
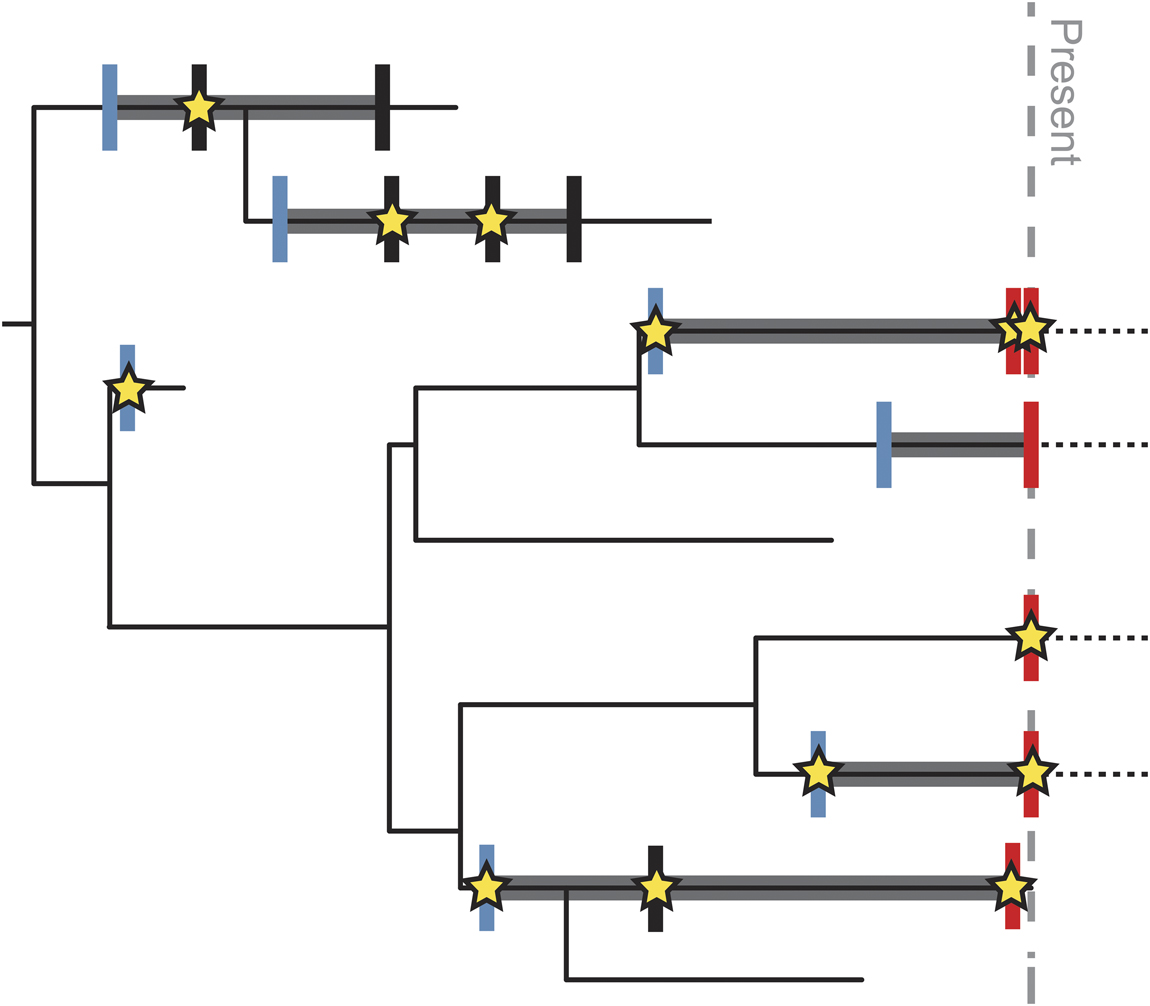
Figure 2 Schematic showing potential variation in “points of observation” for different types of data. Thin black line shows complete evolutionary history of a clade. Thick gray lines represent known stratigraphic range based on the fossil record. Dashed black lines represent range extension of living taxa into the future (it is currently unknown when the last occurrence will be). Blue vertical lines mark points of observation for discrete character data describing a species. Because all individuals of the species share these characters, they must be expressed by the time of the first occurrence of the species. Red vertical lines mark points of observation for molecular data; these are tied to the age of the sampled specimen, almost always at the present, except for rare samples from ancient DNA. Black vertical lines mark additional points in the stratigraphic range where species have been sampled. Stars mark points of observation for continuous morphological data, which are tied to the age of the measured specimen sampled from that part of the stratigraphic range. There may be more than one such specimen within the stratigraphic range of the species, and the age of the measured specimen(s) may not be coincident with the first or last occurrence of the species. Although vertical lines and stars are represented as “points” in time, each has an uncertainty associated with it based on the resolution of the fossil record and age model (see Fig. 1).
The time of observation that should be used in a given analysis will depend on the parameters of interest. For example, if one is interested in the morphological evolution of a continuous trait, the appropriate time of observation may be the estimated age of the particular specimen from which the morphological data were measured. But if one is interested in discrete character change along branches, then the appropriate time of observation may be the first occurrence of the taxon, because all of the discrete characteristics that describe that taxon must be present by that point (e.g., Hopkins and Smith Reference Hopkins and Smith2015). For living taxa with a fossil record, this complicates efforts to combine morphological and molecular data in single analyses, as the morphological data might be more appropriately tied to the first occurrence of a species, while the molecular data are tied to the present day. The confounding effect of different times of observation is largely unexplored in the literature, but choices about times of observation should not be ignored, as these decisions can impact phylogenetic comparative analyses with fossil data (Bapst Reference Bapst2014; Cuff et al. Reference Cuff, Randau, Head, Hutchinson, Pierce and Goswami2015). A similar issue arises with calculations of phylogenetic diversity and the loss of evolutionary history, the measurement of which makes implicit assumptions about how we conceptualize the persistence of taxonomic units over geologic time (Huang et al. Reference Huang, Goldberg and Roy2015).
Stratigraphic Ranges and Stasis
Paleontologists have long worried about how well the age of the oldest (or youngest) sampled specimens of a species represent the time of speciation or extinction of that species (e.g., Strauss and Sadler Reference Strauss and Sadler1989; Marshall Reference Marshall1990, Reference Marshall1997; Weiss and Marshall Reference Weiss and Marshall1999; Holland Reference Holland2003; see Wang and Marshall [Reference Wang and Marshall2016] for a review). The gap between speciation and the first sampled occurrence of a species (the range offset; see Holland and Patzkowsky Reference Holland and Patzkowsky2002) is due at least in part to the evolutionary history of a species or clade, rather than simply a general failing of the fossil record. This is because most species start and end with small geographic ranges and low abundance (Foote et al. Reference Foote, Crampton, Beu, Marshall, Cooper, Maxwell and Matcham2007, Reference Foote, Crampton, Beu and Cooper2008; Liow and Stenseth Reference Liow and Stenseth2007), reducing the probability that member individuals will be sampled, even if they are preserved somewhere in the rock record (e.g., CoBabe and Allmon Reference CoBabe and Allmon1994). High-resolution sampling of the fossil record can only occasionally provide information about the process of speciation, or at least about the pattern of morphological divergence among putative descendant populations from an ancestral stock (e.g., Geary Reference Geary1992; Hunt et al. Reference Hunt, Bell and Travis2008).Paleontologists tend not to consider where in the process of reproductive isolation that morphological distinctiveness occurs, and thus what stage of speciation is reflected by first occurrences, as the geologic record often involves coarse timescales. However, there is considerable variation in how quickly speciation occurs (regardless of how it is defined; Marie Curie Speciation Network 2012), with some estimates as long as millions of years (e.g., to complete reproductive isolation; Dufresnes et al. Reference Dufresnes, Brelsford, Crnobrnja-Isailović, Tzankov, Lymberakis and Perrin2015). The appearance across clades of morphologically distinct units, as recognized in paleontology, may be entirely uncoupled from when lineages diverge (e.g., relative to divergences reconstructed on a dated molecular phylogeny; Huang et al. Reference Huang, Goldberg and Roy2015). The question of whether most morphological differentiation occurs during speciation is still under active investigation (Pennell et al. Reference Pennell, Harmon and Uyeda2014) but has implications for estimating evolutionary rates and divergence times, as we lack phylogenetic models that incorporate this possibility.
There will always be an interval of time over which a taxon existed, regardless of how well the first and last occurrences of a taxon are known to approximate the time of speciation and extinction both accurately and precisely. The observation that morphospecies are consistently found within sedimentary rocks spanning multiple intervals, and thus appear to persist for sometimes millions of years, underlies the concept of morphological stasis (Eldredge and Gould Reference Eldredge and Gould1972). Over many years, there has been discussion about how stasis should be modeled, how sampling and species concepts influence the documented patterns, and what processes might be driving it (see Lidgard and Hopkins [Reference Lidgard and Hopkins2015] for an annotated bibliography). Such considerations influence how stasis has been defined, with definitions ranging from the more general and oft-used pattern-based “little net morphological (or evolutionary) change within a lineage” (Eldredge et al. Reference Eldredge, Thompson, Brakefield, Gavrilets, Jablonski, Jackson, Lenski, Lieberman, McPeek and Miller2005; Pennell et al. Reference Pennell, Harmon and Uyeda2014), to the highly specific, process-based “no evolution within any of the coexisting species due to their interactions with their biotic or abiotic environment, but with occasional minimal evolution due to genetic drift” (Nordbotten and Stenseth Reference Nordbotten and Stenseth2016: p. 1849). Despite this debate on quantifying stasis, the existence of long-lived morphospecies has been widely documented (see Erwin and Anstey Reference Erwin and Anstey1995; Hallam Reference Hallam1998; Jackson and Cheetham Reference Jackson and Cheetham1999; Jablonski Reference Jablonski2000; Eldredge et al. Reference Eldredge, Thompson, Brakefield, Gavrilets, Jablonski, Jackson, Lenski, Lieberman, McPeek and Miller2005; Hunt Reference Hunt2007; Hopkins and Lidgard Reference Hopkins and Lidgard2012; Hunt et al. Reference Hunt, Hopkins and Lidgard2015), indicating a need to consider this aspect of the evolutionary process in phylogenetic analyses incorporating fossils.
Shifting Vantage Points
In some ways, molecular data might seem much more powerful than fossil data, in that they can be treated as precisely known points of observation. Unfortunately, the simple relationship between sampling of Recent specimens and time does not provide a universal framework for comparative analyses based on molecular phylogenies. A relatively well-known example of this comes from recent exploration of the performance of the gamma statistic. The gamma statistic assesses how internode distances vary through time relative to what would be expected under a pure birth process (Pybus and Harvey Reference Pybus and Harvey2000). Negative gamma values indicate that nodes are concentrated near the root of the tree, which in turn indicates that the diversification rate has decreased over time, as might be expected if diversification is diversity dependent (Phillimore and Price Reference Phillimore and Price2008). However, phylogenies driven by diversity-dependent diversification will only yield negative gamma values if the tree is sampled around the time that equilibrium diversities were first reached (Liow et al. Reference Liow, Quental and Marshall2010), and thus carries poor test power when the present marks a different point in a clade’s diversification history.
Although molecular phylogenies typically consist of taxa sampled from the same time, that particular time—the Recent—likely represents different points in the diversification history of different clades, contingent on both the age of the group and its specific diversification trajectory. This phenomenon is similar to the “shifting baselines” phenomenon recognized in ecology and conservation biology. The shifting baselines concept originated in fisheries research to describe the tendency for each new generation to consider the depauperate fish communities they grew up with as pristine (Pauly Reference Pauly1995). Thus the “baseline” for judging the health of current populations is frequently based on personal experience, as if no relevant change had occurred before, and thus shifts generation by generation. In the case of molecular phylogenies, the present represents many different baselines, depending on the clade of interest. If all diversification histories could be somehow standardized to the equivalent starting point, it would become clear that the present represents snapshots of many different evolutionary points. This is effectively what is done to apply the gamma statistic, but ironically, the suite of snapshots represented by the present makes clade histories much harder to compare within the same framework, as is apparent from the shortcomings of the gamma statistic. With the shifting baselines concept in mind, we have dubbed this the “shifting vantage points” phenomenon.
The shifting vantage points phenomenon extends to other common analyses in evolutionary biology, notably the application of early burst models of trait evolution to phylogenetic data sets, which tests whether trait evolution was higher early in a clade’s history rather than later (Harmon et al. Reference Harmon, Losos, Davies, Gillespie, Gittleman, Jennings, Kozak, McPeek, Moreno-Roark, Near, Purvis, Ricklefs, Schluter, Jr, Seehausen, Sidlauskas, Torres-Carvajal, Weir and Mooers2010; Slater and Pennell Reference Slater and Pennell2014). Like gamma, early burst models are time-dependent, with constant exponential rate change, and thus the initiation point is not arbitrary. Unfortunately, application of early burst models often assess the entire data set (i.e., all taxa on a given phylogeny) rather than a specific point chosen a priori. This means the initiation of the early burst is often at the divergence between a major clade and a small outgroup, which may have little relationship to where some prior expectation of an early burst may have been placed. For molecular phylogenies, this often means the initiation of a crown clade, even though the onset of an increase in the rate of trait change and the subsequent slowdown might be earlier, in an unseen stem portion of the clade (Slater and Pennell Reference Slater and Pennell2014). Even for paleontological phylogenies, the tested initiation point is likely at the origin of some major named group, which may be a poor choice if clades originate long before they enter a phase of intense diversification and trait change (e.g., Cooper and Fortey Reference Cooper and Fortey1998; Hopkins and Smith Reference Hopkins and Smith2015). Fortunately, very recent work extends these models to allow for early bursts within subclades rather than across the entire tree (Puttick Reference Puttick2018).
Where to Go from Here?
If fossils and living species are treated as observations of the same underlying diversification process, incomplete sampling can be modeled explicitly in the estimation of phylogenetic parameters (e.g., “the fossilized birth-death process”; Stadler Reference Stadler2010; Heath et al. Reference Heath, Huelsenbeck and Stadler2014). Under this modeling framework, discontinuous fossil sampling and the instantaneous sampling of extant species in the present are treated as distinct processes. In addition, the assignment of one or more specimens to a single taxon (i.e., sampled stratigraphic ranges) can also be incorporated into extensions of this model (Stadler et al. Reference Stadler, Gavryushkina, Warnock, Drummond and Heath2018). If character data are available for both living and fossil species, the phylogenetic position of the fossils can also be inferred, including the identification of sampled ancestors (Zhang et al. Reference Zhang, Stadler, Klopfstein, Heath and Ronquist2016; Gavryushkina et al. Reference Gavryushkina, Heath, Ksepka, Stadler, Welch and Drummond2017). Furthermore, the application of hierarchical models in phylogenetics enables the uncertainty associated with specimen ages to be incorporated into analyses explicitly (Drummond and Stadler Reference Drummond and Stadler2016).
Many advances in tree building, however, have been developed mostly with molecular data in mind, which means models of morphological evolution—and our understanding of the behavior of those models—are often lacking in Bayesian and maximum-likelihood phylogenetic software. Thus the inclusion of fossil taxa in phylogenetic analysis requires improved models of morphological character evolution (Giribet Reference Giribet2015; Lee and Palci Reference Lee and Palci2015; Sansom Reference Sansom2015; Wright et al. Reference Wright, Lloyd and Hillis2016). For example, existing models cannot effectively accommodate stasis or account for the possibility that morphological divergence occurs at the time of speciation. Model development should also account for the nonrandom nature of character preservation and sampling in the fossil record (Sansom et al. Reference Sansom, Gabbott and Purnell2010; Sansom and Wills Reference Sansom and Wills2013; Murdock et al. Reference Murdock, Gabbott and Purnell2016). This aspect of phylogenetic modeling should therefore benefit from a better appreciation of the evolution and development of morphological characters (Chipman Reference Chipman2015), the decay process (Sansom et al. Reference Sansom, Gabbott and Purnell2013; Murdock et al. Reference Murdock, Gabbott, Mayer and Purnell2014), and the way in which fossil and morphological data are collected (Mounce et al. Reference Mounce, Sansom and Wills2016). Similarly, many phylogenetic comparative methods have been developed to handle situations in which the framework tree is ultrametric (i.e., all tips are sampled from the same time point). Many available methods are limited to ultrametric trees, particularly those that involve the classic reconstructed birth–death process model (e.g., the large body of binary-state speciation and extinction model [BiSSE] type approaches developed to separate trait-dependent diversification from asymmetric trait change; Maddison et al. Reference Maddison, Midford and Otto2007; FitzJohn Reference FitzJohn2012). Unfortunately, such limitations are not always explicitly stated or appreciated. In fact, some methods have been designed such that non-ultrametric trees are inappropriate, even though the analysis itself is applicable in theory (see example and solution in Slater Reference Slater2013, Reference Slater2014). It is important for authors to note when methods are not applicable to non-ultrametric phylogenies, and explain what obstacles exist to generalizing the method (as recently exemplified by Bastide et al. Reference Bastide, Ané, Robin and Mariadassou2018).
Fossil occurrence data can contribute to phylogenetic parameter estimates even if character data are unavailable (Gavryushkina et al. Reference Gavryushkina, Welch, Stadler and Drummond2014; Heath et al. Reference Heath, Huelsenbeck and Stadler2014), meaning extinct diversity can be used to inform other macroevolutionary parameters, including speciation, extinction, and species sampling. In this respect, recent developments in phylogenetics are similar to previous paleontological approaches used to generate probabilistic estimates of divergence times based on speciation, extinction, and species sampling rates (Foote et al. Reference Foote, Hunter, Janis and Sepkoski1999; Wilkinson et al. Reference Wilkinson, Steiper, Soligo, Martin, Yang and Tavaré2011; Bapst Reference Bapst2013; Nowak et al. Reference Nowak, Smith, Simpson and Zwickl2013), except that they have the advantage of being able to inform diversification rates and/or divergence times across the entire tree topology and multiple time intervals simultaneously (Stadler Reference Stadler2010; Gavryushkina et al. Reference Gavryushkina, Welch, Stadler and Drummond2014). Rates of sampling and diversification during different intervals also have the potential to be better informed by available paleontological or geological data, such as regional or eustatic sea-level changes or alternative diversity and sampling proxies (Holland Reference Holland1995, 2000, Reference Holland2016; Smith Reference Smith2001; Smith and McGowan Reference Smith and McGowan2007; Wagner and Marcot Reference Wagner and Marcot2013). Indeed, fossil occurrences are the raw data paleontologists have been using for decades to infer evolutionary rates and to test virtually all models of Phanerozoic diversification (e.g., Raup Reference Raup1972; Sepkoski Reference Sepkoski1981; Peters and Foote Reference Peters and Foote2001; Smith Reference Smith2001; Smith and McGowan Reference Smith and McGowan2007; Alroy et al. Reference Alroy, Aberhan, Bottjer, Foote, Fürsich, Harries, Hendy, Holland, Ivany, Kiessling, Kosnik, Marshall, McGowan, Miller, Olszewski, Patzkowsky, Peters, Villier, Wagner, Bonuso, Borkow, Brenneis, Clapham, Fall, Ferguson, Hanson, Krug, Layou, Leckey, Nürnberg, Powers, Sessa, Simpson, Tomašových and Visaggi2008)!
It is rarely possible to sample the fossil record uniformly in time, locally (at a single outcrop) or globally (across dated fossil occurrences), because a majority of the geologic timescale consists of intervals with relatively precise boundary dates but variable in their duration. The nonuniform nature of the fossil record violates assumptions of many phylogenetic approaches (but see Gavryushkina et al. Reference Gavryushkina, Welch, Stadler and Drummond2014) and makes it difficult to infer times of origination and extinction. The severity of such violations may be a function of taxonomic or temporal scale, but this is unexplored. In the meantime, ongoing advances in our understanding of sedimentary processes and the stratigraphic record make it possible to construct more realistic models for predicting local and regional fossil occurrences (e.g., Holland Reference Holland1995, 2000, 2003, Reference Holland2016; Hannisdal Reference Hannisdal2006), for estimating preservation and sampling rates (Foote Reference Foote1997; Wagner and Marcot Reference Wagner and Marcot2013), and for evaluating hypotheses given the incompleteness of the fossil record, such as confidence that a set of taxa truly went extinct before or at some extinction event (e.g., Strauss and Sadler Reference Strauss and Sadler1989; Marshall Reference Marshall1997; Hayek and Bura Reference Hayek and Bura2001; Wang et al Reference Wang, Everson, Zhou, Park and Chudzicki2016).
Finally, the modeling of other aspects of species evolution linked to phylogenetic history is increasingly enabled by the introduction of other process-based models in Bayesian phylogenetics, such as those for modeling biogeography (Landis Reference Landis2016) or trait diversification (Kostikova et al. Reference Kostikova, Silvestro, Pearman and Salamin2016). These developments mirror recent advances in paleontological modeling for estimating macroevolutionary parameters from incomplete and nonuniformly sampled fossil data (Silvestro et al. Reference Silvestro, Schnitzler, Liow, Antonelli and Salamin2014, Reference Silvestro, Zizka, Bacon, Cascales-Miñana, Salamin and Antonelli2016; Brocklehurst Reference Brocklehurst2015; Dunhill et al. Reference Dunhill, Bestwick, Narey and Sciberras2016; Starrfelt and Liow Reference Starrfelt and Liow2016; Wang et al. Reference Wang, Everson, Zhou, Park and Chudzicki2016). This demonstrates a shift in both disciplines toward a more mechanistic approach to addressing questions in deep time that incorporates parameters that reflect our understanding of these evolutionary processes.
Summary
The data used by comparative biologists and paleontologists vary in their association with time, and in their inherent limitations. As a consequence, scientists within each field of study have developed different perspectives on how to view the past, leading to conflicting answers for some questions. It is often tempting to reconcile discrepancies by dismissing one set of observations as being wrong, rather than adopting the more difficult solution of considering all available theories and data. Although neither the molecular record nor the fossil record are perfect, the two records bear independent limitations, and what is missing from one is often available in the other. We must deal with the different and sometimes complex relationships between time and sampling to take full advantage of the complementary nature of the two records.
Acknowledgments
This paper was inspired by the many illuminating discussions each of us has had with colleagues at Evolution, GSA, SVP, and other conferences. Thank you also to M. Patzkowsky, S. Holland, M. Landis, D. Rabosky, M. Pennell, and others, whose detailed and thoughtful criticisms of the manuscript greatly helped us crystallize our perspectives on this issue. All authors contributed equally to the published work.


 Open access