





Introduction
Since the proposal of a molecular evolutionary clock by Zuckerkandl and Pauling (Reference Zuckerkandl, Pauling, Bryson and Vogel1965), the clock assumption has provided a fundamental component to dating evolutionary events. The early hypothesis of a strict molecular clock, in which the evolutionary rate is constant over time and across taxa (Zuckerkandl and Pauling Reference Zuckerkandl, Pauling, Bryson and Vogel1965), was soon proven to only hold for closely related taxa. To account for the violation of the molecular clock, several relaxed clock models were proposed (Kishino and Hasegawa Reference Kishino and Hasegawa1990; Huelsenbeck et al. Reference Huelsenbeck, Larget and Swofford2000; Yoder and Yang Reference Yoder and Yang2000; Kishino et al. Reference Kishino, Thorne and Bruno2001; Thorne and Kishino Reference Thorne and Kishino2002; Drummond et al. Reference Drummond, Ho, Phillips and Rambaut2006; Lepage et al. Reference Lepage, Bryant, Philippe and Lartillot2007; Rannala and Yang Reference Rannala and Yang2007), and have been widely used in phylogenetics for estimating divergence times and evolutionary rates (Heath and Moore Reference Heath, Moore, Chen, Kuo and Lewis2014; Ho and Duchêne Reference Ho and Duchêne2014; dos Reis et al. Reference dos Reis, Donoghue and Yang2016; Ho Reference Ho2021). In paleobiology, the analogical term for “molecular clock” is “morphological clock” (Lee et al. Reference Lee, Cau, Naish and Dyke2014; Lee Reference Lee2016; Warnock and Wright Reference Warnock and Wright2021), wherein the model describes the pattern of morphological character changes instead of nucleotide or amino acid substitutions, but the mathematical assumptions are essentially unchanged.
Relaxed clock models can be loosely divided into two families. In one family, the evolutionary rate is assumed to be independent among the branches in the tree, and these rates are commonly drawn from independent lognormal (ILN) or independent gamma (IGR) distributions (or exponential distribution, which is a special case of gamma distribution when the shape α = 1) (Drummond et al. Reference Drummond, Ho, Phillips and Rambaut2006). Slightly different from the IGR model, the white noise (WN) model (Lepage et al. Reference Lepage, Bryant, Philippe and Lartillot2007) assumes the variances of the gamma distributions are not identical but proportional to the branch lengths. In the other family, the evolutionary rate is autocorrelated, that is, the rate of a descendant branch is drawn from a distribution, with the mean depending on the rate of the ancestor's branch. In the autocorrelated lognormal (ALN) clock model (Kishino et al. Reference Kishino, Thorne and Bruno2001; Thorne and Kishino Reference Thorne and Kishino2002), the rates are lognormally distributed, with the variances proportional to the branch lengths.
Typically, the distribution characterizing the overall shape of the clock variation is preselected, for example, as a lognormal or gamma distribution, which is considered flexible enough to capture the variation. Testing the fit of clock models to the data is usually performed separately (Li and Drummond Reference Li and Drummond2012; Baele et al. Reference Baele, Li, Drummond, Suchard and Lemey2013).
In Bayesian statistics, model selection and model averaging are common techniques for such a purpose. The former estimates the marginal likelihood of each model and uses them to calculate Bayes factors that can ultimately be used to decide which model best fits the data (Kass and Raftery Reference Kass and Raftery1995). The latter employs the reversible-jump Markov chain Monte Carlo (rjMCMC) algorithm to move among the alternative models and estimates the posterior probability of each model (Green Reference Green1995). Model probabilities are directly provided by the rjMCMC but can also be estimated through the marginal likelihoods. Note that the ratio of posterior model probabilities (P(M 1|D)/P(M 2|D), M for model and D for data) equals the prior odds (P(M 1)/P(M 2)) multiplied by the ratio of marginal likelihoods (i.e., the Bayes factor, P(D|M 1)/P(D|M 2)). With no prior preference favoring one model over the other (P(M 1) = P(M 2)), the probability of M 1 is P(M 1|D) = P(D|M 1)/[P(D|M 1) + P(D|M 2)] and P(M 2|D) = 1 − P(M 1|D).
In theory, the marginal-likelihood and rjMCMC approaches should produce identical model probabilities. In practice, however, the performance of different estimators may vary. Studies have shown that the harmonic mean estimator has very poor performance and is often biased, while more advanced techniques such as path sampling (PS) and stepping-stone sampling (SS) greatly improve the performance of marginal-likelihood estimation (Lartillot and Philippe Reference Lartillot and Philippe2006; Xie et al. Reference Xie, Lewis, Fan, Kuo and Chen2011; Baele et al. Reference Baele, Lemey, Bedford, Rambaut, Suchard and Alekseyenko2012, Reference Baele, Li, Drummond, Suchard and Lemey2013). Despite being computationally demanding, PS and SS are being widely used in Bayesian model selection. On the other hand, rjMCMC usually takes much less computational cost to obtain similar or better accuracy in terms of estimating model probabilities and has the advantage of comparing more than two models simultaneously and averaging the uncertainties among them (Baele et al. Reference Baele, Li, Drummond, Suchard and Lemey2013). The rjMCMC algorithm does require careful design to achieve good mixing, and it is challenging to move among very distinct models.
Here I focus on the uncorrelated relaxed clock models and develop a new rjMCMC algorithm for drawing posterior samples between the ILN and IGR models. Previous studies have attempted averaging over the independent exponential rates and ILN models using a different approach, that is, by mapping the quantiles of the two distributions (Li and Drummond Reference Li and Drummond2012). Such mapping involves recalculating the data likelihood, which is likely computationally expensive. I propose a direct match of the branch rates, which is computationally fast while still maintaining good mixing.
I verify the ability of the new rjMCMC algorithm to infer the true model through simulations. The algorithm is then applied to the morphological data of Mesozoic birds (Zhang and Wang Reference Zhang and Wang2019) to average over the relaxed clock models while estimating the divergence times and evolutionary rates. A previous study (Zhang and Wang Reference Zhang and Wang2019) suffered from poor convergence and mixing under the WN model when the data were partitioned. Also, the age estimates were not very consistent between the unpartitioned and partitioned analyses, and the credibility intervals of the evolutionary rates appeared too wide. I will show that these aspects are improved by mixing the ILN and IGR clock models.
Methods
The rjMCMC Algorithm
The evolutionary rate at branch i, ci, is a product of the mean (base) rate, c, and the relative rate, ri. The ILN and IGR models differ in the probability distribution of ri. In the ILN model, ri follows a lognormal distribution with a mean of 1.0 and variance of σL; whereas in the IGR model, ri follows a gamma distribution with a mean of 1.0 and variance of σG. The similarity of the two models provides a simple mapping of the parameters, that is, direct matching of the branch rates and linear mapping of the variances, σL = wσG, for jumping between the two models.
The key component of the rjMCMC algorithm is calculating the acceptance probability when moving from one model to the other. This probability contains three multiplied parts: the posterior ratio, the generating-variable density ratio, and the Jacobian determinant for transforming variables (Green Reference Green1995). The posterior ratio is the product of the prior ratio and the likelihood ratio. Because the move does not change the tree, including branch lengths, the likelihood ratio is 1.0. The prior ratio involves the gamma rate densities multiplied across all branches over the lognormal rate densities moving from IGR to ILN, and the reciprocal when moving backward. The generating-variable density ratio is also 1.0, as the rates are directly mapped, thus no random variable is generated. Finally, the Jacobian determinant is w moving from IGR to ILN and is 1/w moving backward, where w is the ratio of the ILN and IGR clock variances.
Unlike conventional MCMC proposals in which the best efficiency is typically achieved when the acceptance rate is about 30% (Yang and Rodriguez Reference Yang and Rodriguez2013), for cross-model rjMCMC proposals, in principle, one should make the acceptance rate as high as possible (by adjusting w in this case) to maximize the proposal's efficiency (Yang Reference Yang2014). But the acceptance rate by its nature cannot reach an arbitrarily high value, for example, it cannot be higher than 20% if one model has posterior probability 0.9, as the chain has to stay in that model 90% of the time. In the current implementation, adjusting w in the proposal is the only option to increase efficiency. One could preselect several values of w (typically ranging from 1 to 4) for independent runs and use the results with the highest acceptance ratio. This helps to confirm convergence and consistency among runs but requires more computation. Here I introduce an auto-tuning feature to dynamically adjust w during the rjMCMC to avoid the trial and error for picking the appropriate value.
The starting value of w is set to 2.0, which can be changed by the user. When the rjMCMC proposal has been attempted for a certain number of generations (called a batch, default to 1000), the auto-tuner adjusts w by comparing the acceptance rates of this batch and the previous batch, aiming to achieve higher acceptance rate in the next batch. The adjustment amount is δ = min(0.1,  $1/\sqrt n $), where n is the current batch number. Thus, w increases or decreases by the amount of 0.1 in each of the first 100 batches, then changes more and more gradually in the following batches. When the acceptance rates are both zero after two adjacent batches, w is reset to its initial value to continue, such that the tuning mechanism can avoid getting stuck.
The rjMCMC algorithm was implemented in MrBayes software (Ronquist et al. Reference Ronquist, Teslenko, van der Mark, Ayres, Darling, Höhna, Larget, Liu, Suchard and Huelsenbeck2012b) (see “Software Implementation” for more details).
Simulation Study
To verify the implementation and performance of the rjMCMC algorithm, I simulated evolutionary rate variation along tree branches and ran MrBayes to infer the posterior probability of the clock models under each condition.
Specifically, I first generated 100 trees under the birth–death model with speciation rate λ = 3.0, extinction rate μ = 1.0, time of the most recent common ancestor t mrca = 1.0, and complete sampling of the lineages, using the TreeSim package in R (Stadler Reference Stadler2011). These trees have numbers of tips ranging from 6 to 75. The branch lengths were measured by the expected number of substitutions per site (character) under the base rate of the clock. Given each tree, the relative branch rates (ri values) were all drawn from a lognormal distribution with a mean of 1.0 and variance of σL = 0.1, 0.5, 1.0, 2.0, respectively; or from a gamma distribution with a mean of 1.0 and variance of σG = 0.1, 0.5, 1.0, 2.0, respectively. Note when σG = 1.0, the gamma distribution is actually an exponential distribution. I also tested a simple model mismatch, that is, the relative rates were drawn from a normal distribution (truncated at 0) with a mean of 1.0 and variance of σN = 1.0. Eventually, each tree was associated with nine sets of branch rates (100 × 9 combinations in total). The probability densities of these distributions are shown in Figure 1.

Figure 1. Probability densities of gamma and lognormal distributions under mean 1.0 and variance 0.1 (A), 0.5 (B), 1.0 (C), and 2.0 (D), and probability density of N(1, 1) distribution (truncated at 0) (C). Note that the Gamma(1, 1) distribution (α = 1) is Exp(1) distribution (C).
I initially fixed the tree topology, branch lengths, and relative rates to the simulated values, so that MrBayes only estimated the probabilities of the clock models and the variance parameter in each model. No data were used at this point (sampling from the prior). The aim was to verify the correctness of the rjMCMC implementation and to avoid introducing uncertainties from irrelevant sources. For each run, the ILN and IGR models were assigned equal prior probabilities (0.5). The base evolutionary rate (c) was assigned a diffuse prior of Exp(1.0) and the prior for the clock variance (σL or σG) was also Exp(1.0). The tuning parameter w was adjusted through auto-tuning. A single MCMC per replicate was executed for 1 million iterations and sampled every 100 iterations; this setting was determined from preliminary runs. The first 25% of the samples were discarded as burn-in. Convergence was checked across the 100 replicates by examining the traces of parameters and the effective sample sizes (ESS) all higher than 200 (same for the MCMC runs below).
Additionally, I simulated discrete morphological matrices under the Markov k-states variable (Mkv) model (Lewis Reference Lewis2001), that is, keeping only the variable characters in the matrices, on each of the 100 trees with each of the nine sets of rates generated earlier. There were 100, 300, and 500 characters, respectively, for each setting (100 × 9 × 3 data sets generated). Each data matrix contained from binary to up to five-state characters with proportions of 0.4, 0.3, 0.2 and 0.1, respectively. This round of simulations was intended to verify the ability of the program to estimate the clock model probabilities along with other parameters (including tree topology) directly from the morphological data. In the inference, I used also the Mkv model consistent with the model used to simulate the data. The prior for the tree was uniform (Ronquist et al. Reference Ronquist, Klopfstein, Vilhelmsen, Schulmeister, Murray and Rasnitsyn2012a) and that for the root age was gamma with a mean of 1.0 and a standard deviation of 0.1. The tip ages were fixed to their true ages, and these were treated as part of the data in the tip-dating analyses. The other prior settings were the same as before. The length of the MCMC was extended to 50 million iterations to ensure converge and sufficient ESS.
Apart from the clock models, the evolutionary rates estimated from data are usually of interest. Hence, I calculated the mean squared error to assess the accuracy with which the evolutionary rates are estimated. It is defined as

where ri is the true rate in the simulation,  $\hat{r}_i$ is the estimated value in the inference, and n is the number of branches (rates) in the tree. To match the simulated and estimated rates, the tree topology in the inference was fixed to the one used to simulate the data. In addition to using the rjMCMC to average the ILN and IGR models, I tested using the WN model in the inference that does not match either of the models used to simulate the data.
Mesozoic Birds
The morphological data of Mesozoic birds (68 species and 280 characters; Zhang and Wang Reference Zhang and Wang2019) were used to investigate the performance of the rjMCMC algorithm under the tip-dating framework. The fossilized birth–death (FBD) model (Stadler Reference Stadler2010; Gavryushkina et al. Reference Gavryushkina, Welch, Stadler and Drummond2014; Heath et al. Reference Heath, Huelsenbeck and Stadler2014; Zhang et al. Reference Zhang, Stadler, Klopfstein, Heath and Ronquist2016) was used for the tree prior. To account for nonuniform fossil sampling, the sampling rate (ψ) was allowed to vary along time in a piecewise manner with four intervals divided at 145, 100, and 66 Ma. The speciation rate (λ) and extinction rate (μ) were assumed to be constant in the model. The prior for the base evolutionary rate (c) was Gamma(2, 100) with a mean of 0.02 (about 2 changes per character per 100 Myr) and a standard deviation of 0.014, which is weakly informative based on the inference results reported by Zhang and Wang (Reference Zhang and Wang2019). The ILN and IGR clock models were given equal prior probabilities, and the variance parameter (σL or σG) was assigned Exp(0.5) prior. Two independent runs were executed for 70 million iterations each and sampled every 2000 iterations. The first 25% of the samples were discarded as burn-in, and the remaining samples from the two runs were combined after checking consistency between runs. The efficiency of the rjMCMC algorithm was tested under w = 1, 2, 3, and 4, respectively, to compare with auto-tuning w.
The rjMCMC algorithm has two relaxed clock models implemented: the ILN and the IGR. Nevertheless, I also ran an additional analysis under the ALN model to assess the fitness of this model if compared with the analyses run under the two uncorrelated-rates models implemented in the new algorithm. For this model-selection analysis, I computed the marginal likelihoods under these three models using the SS approach (Xie et al. Reference Xie, Lewis, Fan, Kuo and Chen2011), which I would later use to find out the best-fitting model. The priors for the base evolutionary rate and the variance parameter were the same in these models (i.e., Gamma(2, 100) for c and Exp(0.5) for σ). For each clock model, a total of 50 steps were used with 40 million iterations (20,000 samples) within each step. The first step was discarded as initial burn-in. Additionally, the beginning of each step (10 million iterations, 5000 samples) was discarded as burn-in. The sampling was from posterior to prior with the power drawing from a beta(0.4, 1) distribution in the default implementation.
I further applied the rjMCMC algorithm to the characters divided into six anatomical partitions, as in the previous study, which are skull (53 characters), axial skeleton (36 characters), pectoral girdle and sternum (48 characters), forelimb (65 characters), pelvic girdle (23 characters), and hindlimb (55 characters) (Zhang and Wang Reference Zhang and Wang2019). In this case, the program was able to infer the probabilities of the relaxed clock models (ILN vs. IGR) for each partition together with the evolutionary rate variations across partitions. The prior and MCMC settings were the same as in the unpartitioned analysis, except that the chain length was set to 120 million iterations and the first 40% samples were discarded as burn-in. In the previous study (Zhang and Wang Reference Zhang and Wang2019), the MCMC was unable to converge using the WN relaxed clock and standard FBD models (e.g., low ESS values and segregated estimates of several key parameters), as a trade-off, fossil ancestors had to be disallowed. In comparison, the inference using the ILN and IGR mixed clock models for the partitioned data were executed under the standard FBD model with fossil ancestors.
Results
Simulation Study
As the number of characters goes from small (l = 100) through medium (l = 300) to large (l = 500), the data should carry more and more information to inform the evolutionary rate variation and the true model generating the rates. Having the tree and rates fixed in the inference can be viewed as a limiting condition with an infinite number of characters and a very informative prior for the times; thus, the times and rates can be estimated without error. The results indeed agree with this. Under the same clock variance, the probability of the true model increases along with the number of characters (Fig. 2, except for normal distribution). Note that the model used in the inference is not misspecified, that is, the models in the rjMCMC include the true model generating the data.
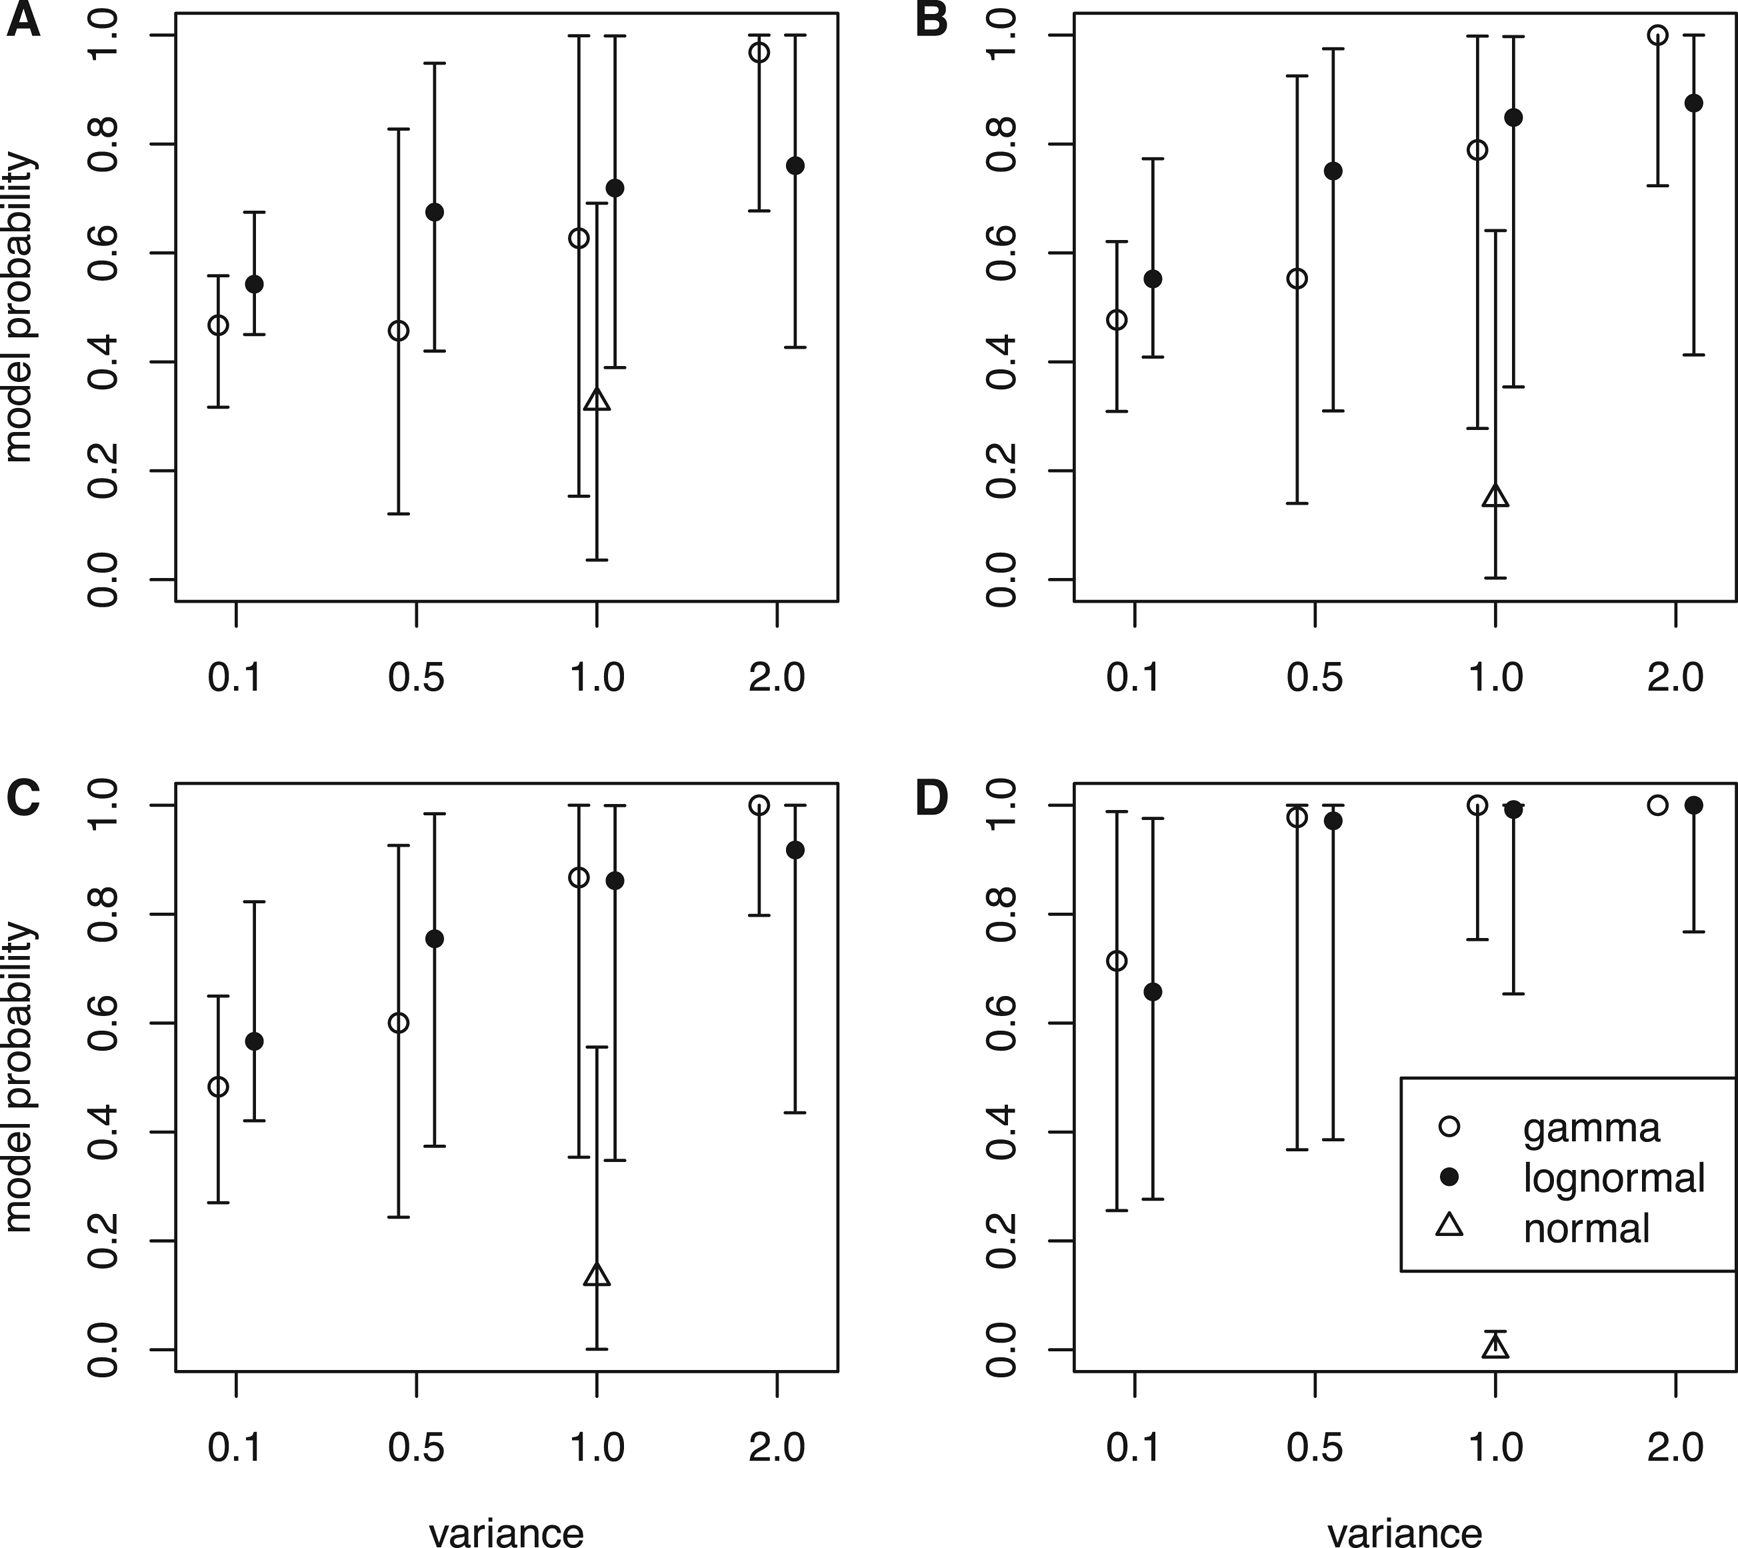
Figure 2. Model probabilities estimated by the reversible-jump Markov chain Monte Carlo (rjMCMC) algorithm. Nine sets of rates were simulated under distributions in Fig. 1 given each tree, and for each tree with rates, data matrices with 100 characters (A), 300 characters (B), and 500 characters (C) were simulated for inference. The model probabilities were also inferred when the trees and rates were fixed to the simulated values (no data) (D). When the rate-generating distribution was gamma, the posterior probabilities of the independent gamma rates (IGR) model are shown; when the generating distributions were lognormal and normal, the posterior probabilities of the independent lognormal (ILN) model are shown. The circle is the median, and the error bar denotes the 5th and 95th percentiles summarized across the 100 replicates (trees).
When the branch rates were generated from a normal distribution, neither ILN nor IGR matched the generating model, but the IGR model dominated the posterior. In the limiting condition when the rates were fixed to the simulated values, the probability of ILN approached zero (Fig. 2D). It appears that the N(1, 1) distribution can be better fit by a gamma distribution with variance slightly smaller than 1.0 than any lognormal distribution that has a sharp peak and long tail.
Given the same amount of data (characters), the ability to infer the true clock model depends on the clock variance. When the variance of the branch rates is small (0.1), the shape of the two distributions is quite similar (Fig. 1A), thus the ILN and IGR models fit the data (rates) almost equally well. As a result, the posterior probability of the true model is close to 0.5 (Fig. 2). As the variance increases, the shapes of the two distributions becomes sharply different (Fig. 1B–D), making it easier for the rjMCMC to distinguish the two models (Fig. 2). Interestingly, the lognormal rate variation is slightly more easily distinguished when the variance is small (σ = 0.1 or 0.5), but the opposite is true when the variance is large (σ = 2.0).
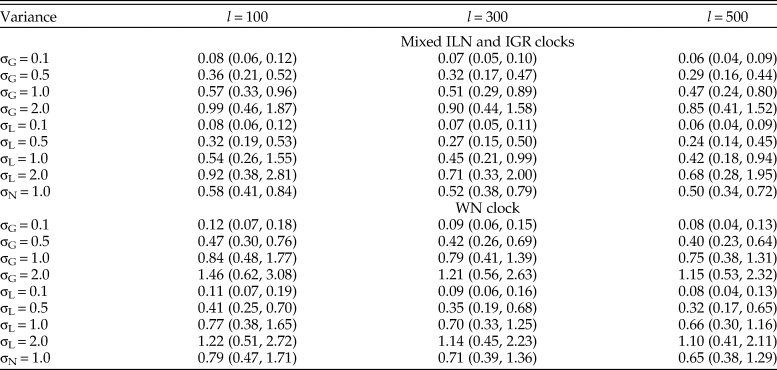
The evolutionary rates are estimated more accurately when the variance is small (0.1), while the MSEs become one order of magnitude larger when the variance is large (2.0) (Table 1). The estimates are slightly improved by adding more characters, but the effect can be overridden by increased clock variance, for example, the median MSE is larger using 500 characters for variance of 1.0 than using 100 characters for variance of 0.5 (Table 1). When the rates were generated from the normal distribution, the rjMCMC algorithm does not include the true model, but the values of MSE are comparable to those when the rates were generated from gamma or lognormal distributions with variance of 1.0. This type of model mismatch on the rate estimates is less dramatic than using the WN model for inference (Table 1). The WN model has nonidentical variances for the branch rates and thus resulted in worse accuracy when the rates were generated from independent and identical distributions.
Table 1. Median (5th, 95th percentiles) of the mean squared errors (MSE) of relative rates across the 100 replicates (trees). For each tree, there were nine sets of rates (σG for gamma variance, σL for lognormal variance, and σN for normal variance) and three character lengths (l = 100, 300, and 500) simulated (100 × 9 × 3 datasets). Each dataset was then analyzed using the mixed independent lognormal (ILN) and independent gamma rates (IGR) clock models and the white noise (WN) clock model.
Mesozoic Birds
The time-scaled phylogeny and evolutionary rates inferred are largely consistent with the previous results (Fig. 3, cf. Zhang and Wang Reference Zhang and Wang2019: fig. 1). But in detail, averaging over the ILN and IGR models refines both the divergence time and evolutionary rate estimates. As shown in Figure 4, the ages of five key nodes in early stem birds are quite consistent between the unpartitioned and partitioned analyses, but previous ones had differences of at least 5 Myr. The variances of the branch rates are also reduced, resulting in narrower credibility intervals for drastic rates than those under the WN model. For example, the 95% highest posterior density (HPD) intervals are (0.08, 7.9) and (0.96, 9.8) at branches subtending Ornithothoraces and Enantiornithes under the mixed model, but are (0.0, 32.5) and (1.49, 30.8) under the WN model. The latter intervals are much wider given the same amount of data, indicating the WN model favors larger variance (or more heterogeneous rates).
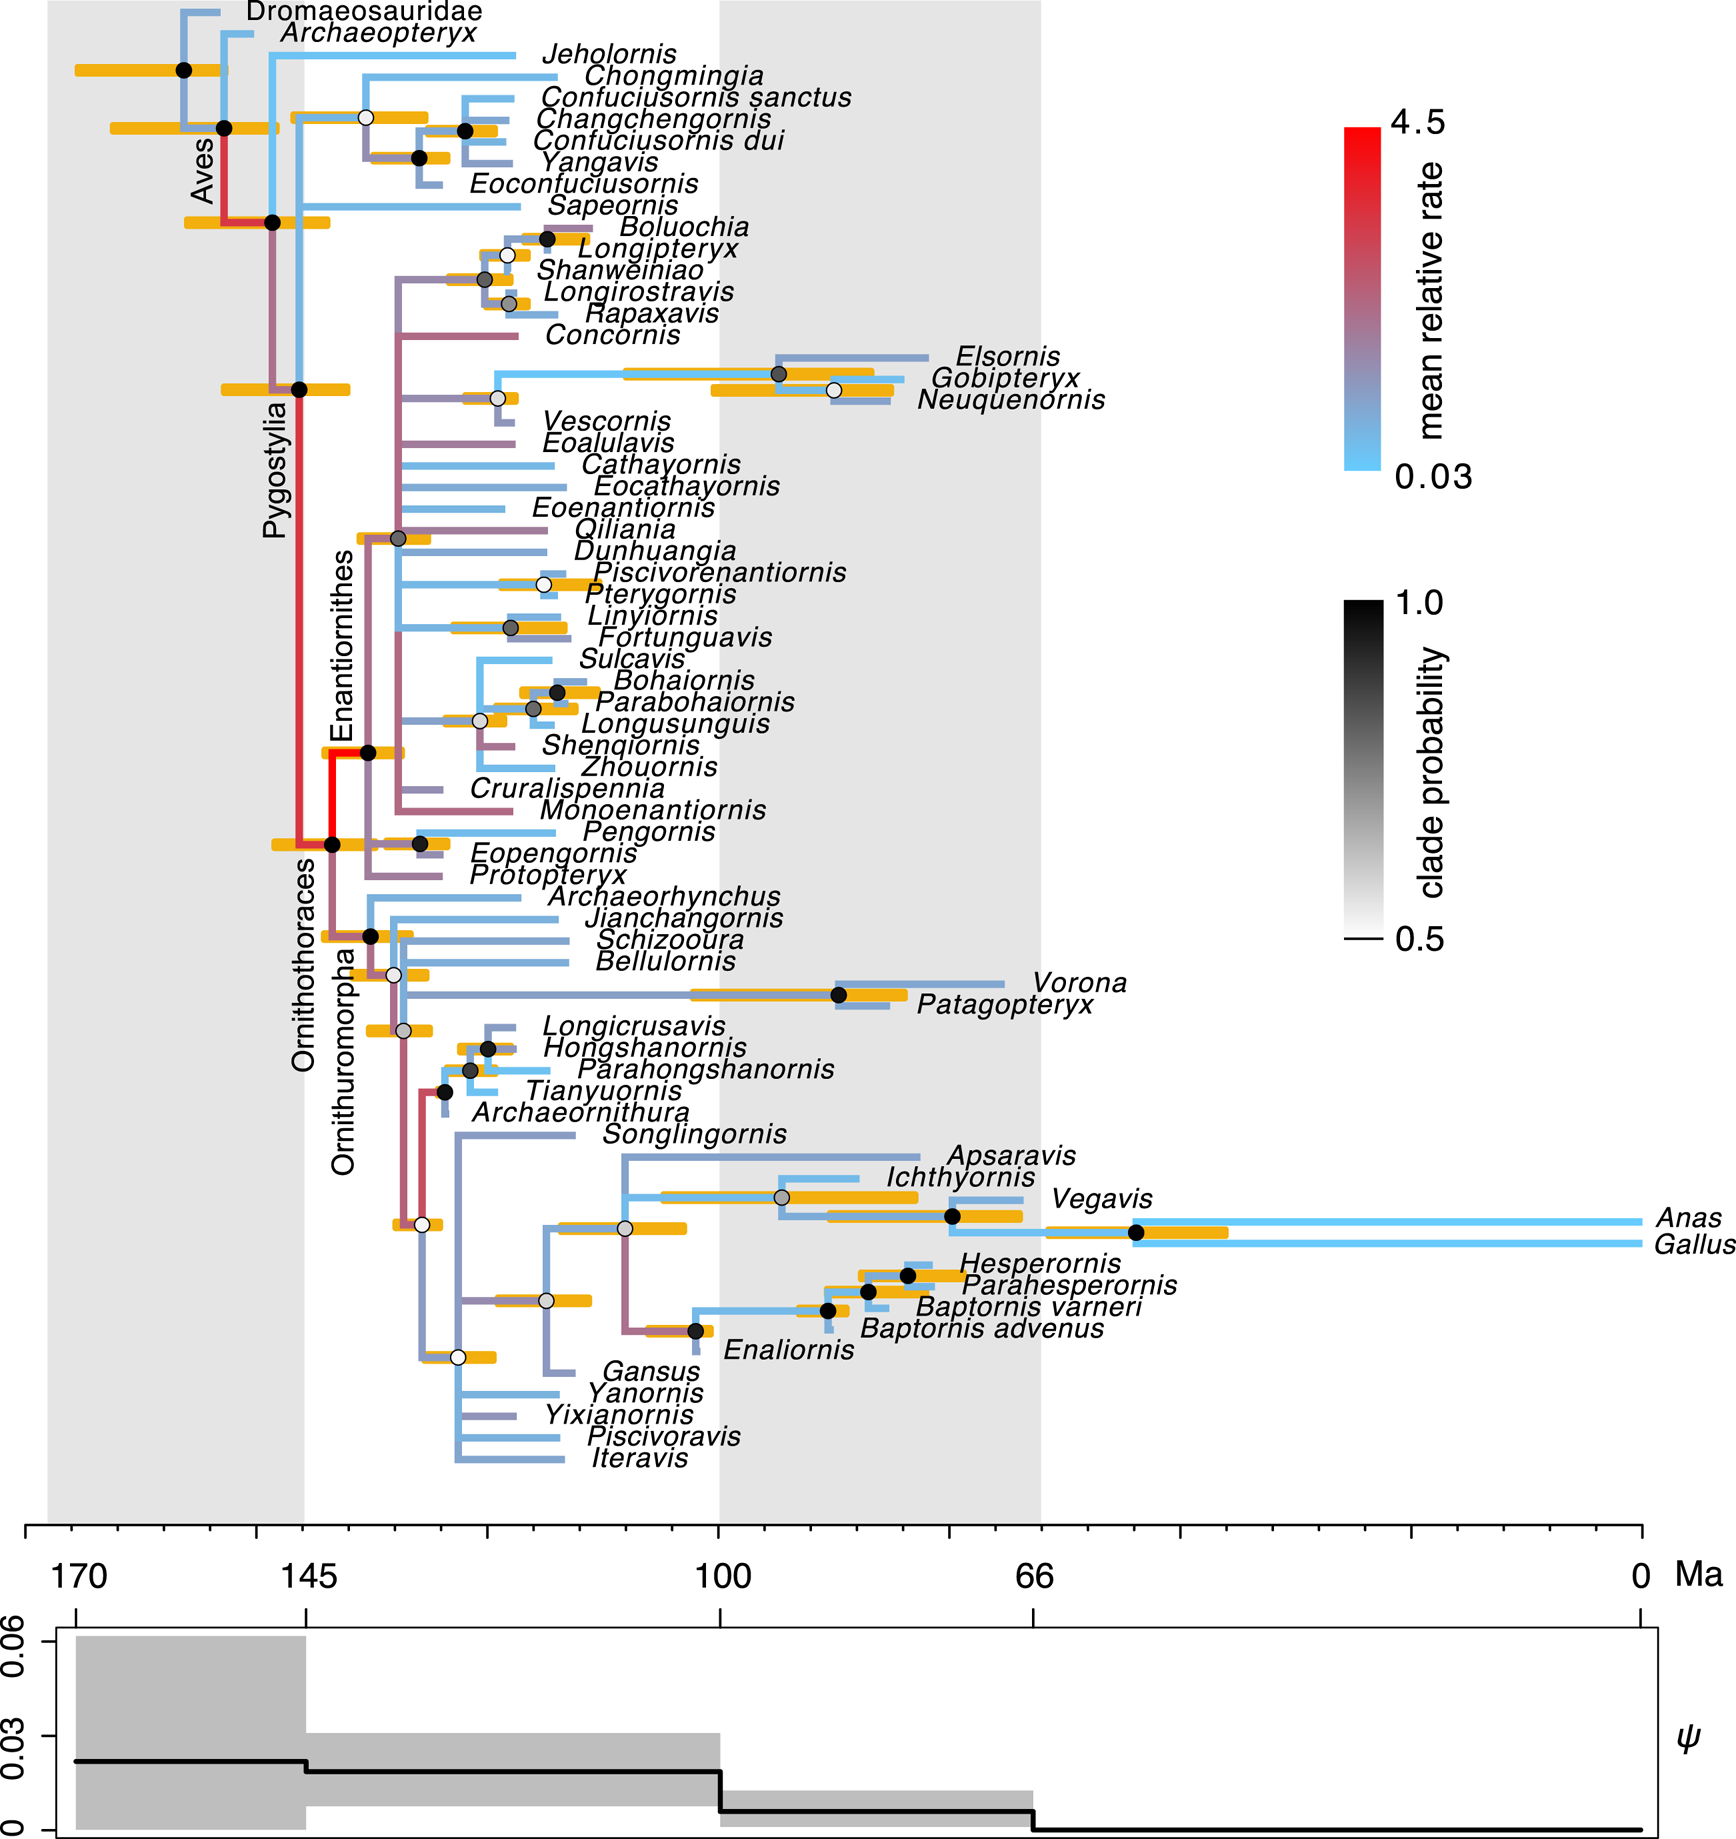
Figure 3. Dated phylogeny of Mesozoic birds. The topology shown is the majority-rule consensus tree summarized from the posterior trees. The node ages in the tree are the posterior medians, and the error bars at the nodes denote the 95% highest posterior density (HPD) intervals. The shade of each node circle represents the posterior probability of the corresponding clade. The color of the branch represents the mean relative evolutionary rate at that branch. The fossil sampling rate, ψ, varies along time in a piecewise constant manner, with four intervals divided at 145, 100, and 66 Ma. The solid line is the posterior mean, and the shade denotes the 95% HPD interval.
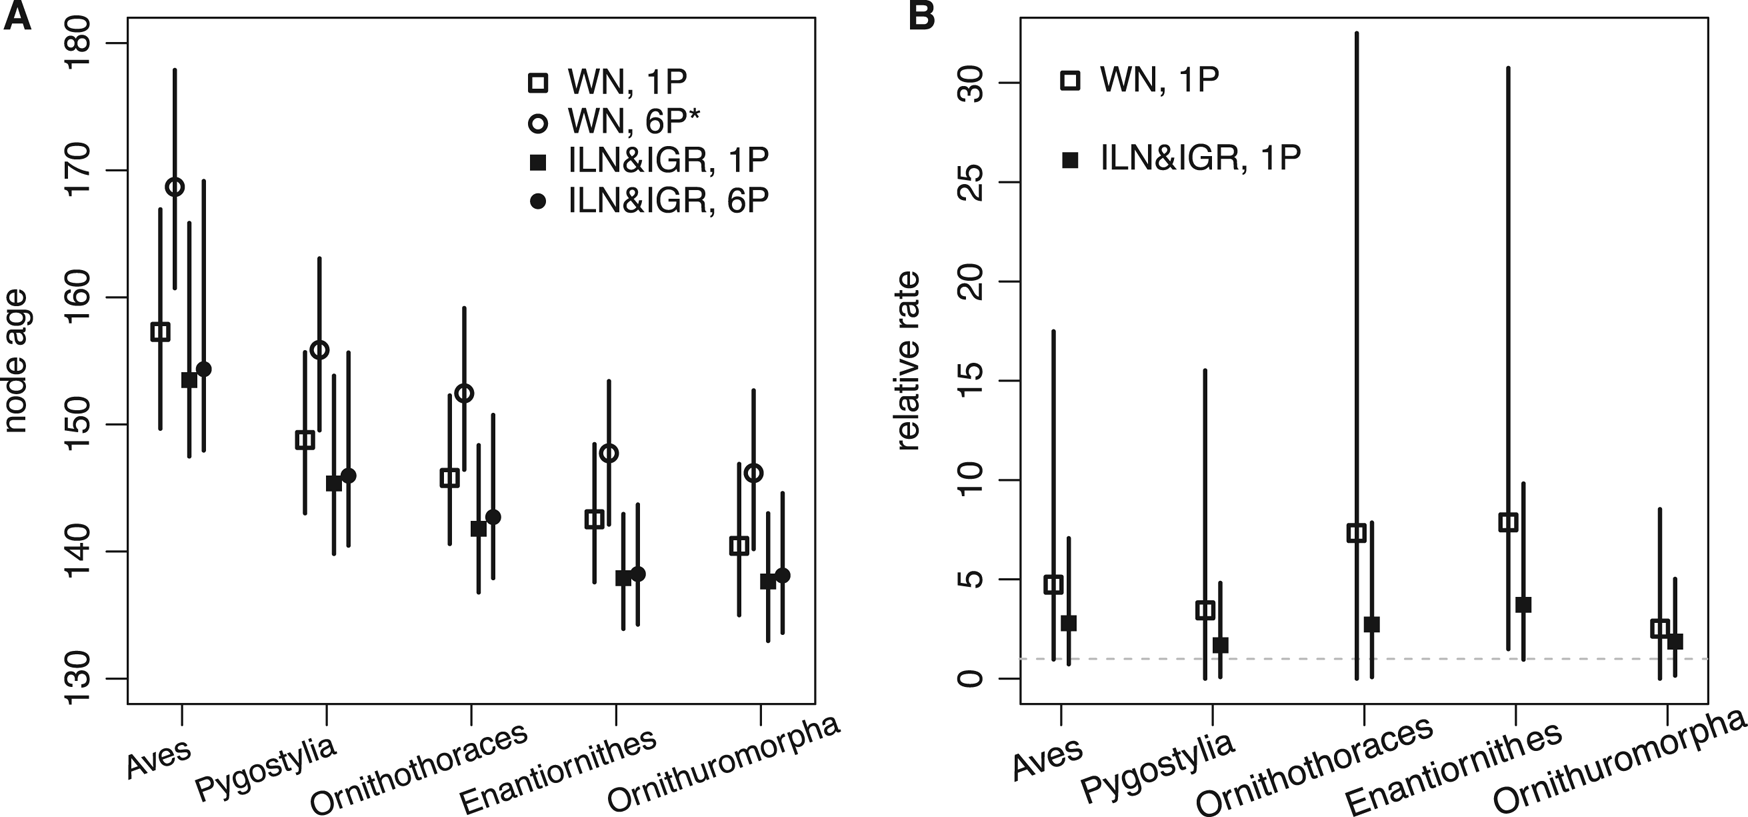
Figure 4. A, Five focal node ages (mean and 95% highest posterior density [HPD] interval) of early stem birds estimated under the white noise (WN) model for the unpartitioned data (WN, 1P), WN model for the partitioned data (WN, 6P*; the star denotes disallowing fossil ancestors in the fossilized birth-death [FBD] model), mixed independent lognormal (ILN) and independent gamma rates (IGR) models for the unpartitioned data (ILN&IGR, 1P), and mixed ILN and IGR models for the partitioned data (ILN&IGR, 6P). B, Relative evolutionary rates (mean and 95% HPD interval) at the five focal branches under the WN model for the unpartitioned data (WN, 1P) and mixed ILN and IGR models for the unpartitioned data (ILN&IGR, 1P).
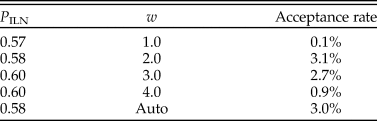
The rjMCMC algorithm consistently estimated the posterior probability of the ILN model as P ILN = 0.6 (and P IGR = 0.4). Judging by the acceptance rate of the move, the best efficiency was achieved when w was at 2.0 or 3.0 (Table 2). This is obvious when looking at the estimates of σL and σG, which are 2.5 (1.1, 4.4) and 0.9 (0.6, 1.3), respectively (mean and 95% HPD interval). The lognormal distribution is more skewed than the gamma distribution under the estimated variances, meaning that it can better capture some extreme rates. Smaller and larger values of w (0.5 and 5) were also tried but resulted in much poorer convergence and mixing; thus, the results were discarded. With auto-tuning enabled, the values of w fluctuated mostly between 2.0 and 3.0 during the run, and the efficiency was similar to when w was fixed to 2.0 or 3.0 (Table 2).
Table 2. Posterior probability of the independent lognormal (ILN) clock model and acceptance rate of the reversible-jump Markov chain Monte Carlo (rjMCMC) proposal under each of the four fixed values of w and when w is auto-tuned.
The rjMCMC algorithm does not include an autocorrelated relaxed clock model (e.g., the ALN model). In fact, it is quite challenging to do that (see “Discussion”). On the other hand, it is straightforward to compare these models using marginal likelihoods or Bayes factors. The SS ran about 20 times slower than the rjMCMC (70 million vs. 2 billion iterations). The marginal likelihoods (natural logarithms) were −4788.1 and −4788.9 in two runs under the ILN model and −4789.2 and −4789.9 under the IGR model. Given equal prior probabilities for the two models, the posterior probability of the ILN model, P ILN = M ILN/(M ILN + M IGR), ranges from 0.57 to 0.86. The SS had slightly worse convergence under the ALN model, resulting in marginal likelihoods of −4882.3 and −4884.8 in two runs. It has been shown that convergence is much more difficult to reach under the ALN model due to the lack of power to detect the autocorrelation (Ho et al. Reference Ho, Duchêne and Duchêne2015). Nevertheless, the natural logarithm of the Bayes factor (difference of logarithmic marginal likelihoods) is much larger than 10 for IGR against ALN, indicating IGR fits the data much better than ALN (Kass and Raftery Reference Kass and Raftery1995). The independent-rates models (ILN or IGR) allow drastic rate variation among adjacent branches, whereas the ALN model has a smoothing effect and thus has less tolerance for drastic changes at adjacent branches. A study of Hymenoptera (Ronquist et al. Reference Ronquist, Klopfstein, Vilhelmsen, Schulmeister, Murray and Rasnitsyn2012a), for example, also detected that the independent rates (WN) fit the data better than the autocorrelated rates (ALN) for the same reason.
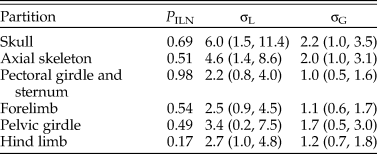
When the characters were partitioned according to six anatomical regions, the relative rates at five focal branches among these regions were consistent with previous estimates in general, with slightly narrower credibility intervals (Fig. 5, cf. Zhang and Wang Reference Zhang and Wang2019: fig. 2). Moreover, the rjMCMC algorithm also estimated the posterior probabilities of the clock models for each partition (Table 3). The third partition, which contains pectoral girdle and sternum characters, has the highest probability for the ILN model (0.98), while the sixth partition, which contains hind-limb characters, has the highest probability for the IGR model (0.83). This illustrates the importance of model averaging, because different character regions have distinct patterns of evolutionary rate variation due to varying natural selection and can thus be better fit by different distributions. The high evolutionary rates during early avian evolution largely correspond to extensive morphological modifications refining flight capability. As discussed in Zhang and Wang (Reference Zhang and Wang2019; see also Yu et al. Reference Yu, Zhang and Xu2021), the high rate for axial skeleton reflects extensive morphological changes in the vertebral column, especially the forming of pygostyle, while the high rates for pectoral girdle and sternum correspond to the unique morphological changes related to flight apparatus and the deviation of flight styles transitioning from Pygostylia to Enantiornithes. There appears to be no dominant selective pressure in the skull and pelvis during early avian evolution.
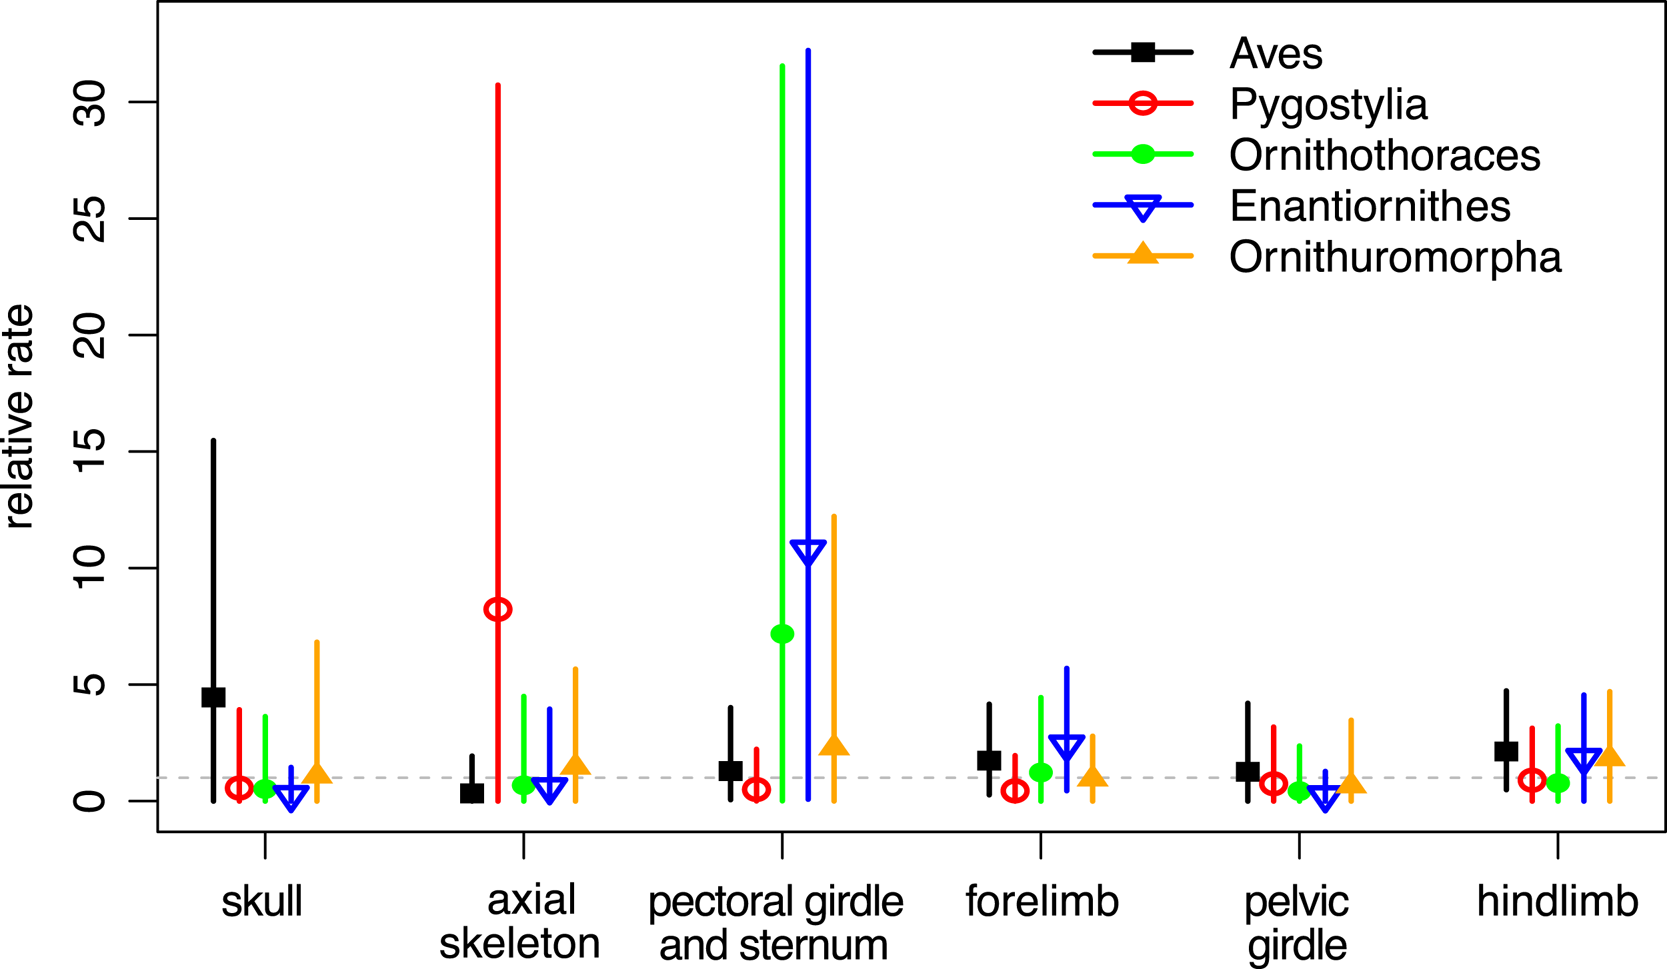
Figure 5. Relative evolutionary rates (mean and 95% highest posterior density [HPD] interval) for the six anatomical partitions at the five focal branches averaging over the independent lognormal (ILN) and independent gamma rates (IGR) models (ILN&IGR, 6P).
Table 3. Posterior probability of the independent lognormal (ILN) clock model for each of the six partitions and the variance parameters estimated (mean and 95% highest posterior density [HPD] interval).
Discussion
In this study, I developed a rjMCMC algorithm to average over the ILN and IGR clock models. The simulation study revealed the ability of the algorithm to infer the true model, while the estimates of divergence times and evolutionary rates in the Bayesian tip dating of Mesozoic birds were both improved by averaging over these two clock models.
The mixed ILN and IGR clocks also improved the MCMC sampling, as the partitioned analysis converged efficiently under the standard FBD model allowing fossil ancestors but failed under the WN model. In the WN model, the rate distribution is also gamma, but the variance of the branch rate is proportional to the branch length. Thus, a change of the time influences the rate and vice versa, but the MCMC proposals are not optimized for these correlated parameters. In the IGR or ILN model, the variance parameter is independent of the branch length, making the MCMC more efficient to update the times and rates. Thus, the overall convergence and mixing are improved.
Nevertheless, there is clearly some room for improvement in the rjMCMC algorithm, as it only achieved acceptance rate of about 3% (Table 2). Take the results of P ILN = 0.6 and P IGR = 0.4, for example. One could imagine that if the chain moves to ILN with certainty and moves to IGR with probability P IGR/P ILN, such a move would be the most efficient with an acceptance rate of P ILN × P IGR/P ILN + P IGR × 1 = 2 × 0.4 = 0.8. Note this is a theoretical upper limit, which is hard to reach in practice. Recall that the evolutionary rates are directly mapped between models, so the term that changed during rjMCMC is the joint probability distribution of the rates, which is the multiplication of either lognormal or gamma densities across branches. Apparently, matching these two multidimensional distributions would require a very accurate (and different) value of w in each iteration to avoid the move being rejected too often. The auto-tuning feature developed here has not accomplished this goal, and a smarter one is needed. Li and Drummond (Reference Li and Drummond2012). Took another direction by mapping the quantiles of two distributions, such that the probability distribution of the evolutionary rates is unchanged in the cross-model move, but the data likelihoods are different as the evolutionary rates themselves are changed. Because the likelihood would dominate the posterior, this strategy would probably result in a poorer acceptance rate. Also, the likelihood computation is usually much heavier than the prior calculation. Regardless, further studies are necessary to make more thorough evaluations and comparisons. A better algorithm to achieve good acceptance rate and efficiency might lie in between these two strategies, where the likelihood and evolutionary rate distribution need to be co-updated, which is left for further research.
A desirable feature of the rjMCMC algorithm appears to be including an autocorrelated relaxed clock model such as the ALN model. However, it is quite challenging to design efficient moves between the autocorrelated and uncorrelated clock models. The ALN model has rates of ri 1 and ri 2 at both ends of branch i, and ri 2 follows a lognormal distribution with mean ri 1 and variance σAti, where ti is the time duration of branch i. One could map the branch rate ri in the ILN model to ri′ = (ri 1 + ri 2)/2 in the ALN model, but this mapping sometimes reaches negative value of ri 1 or ri 2, resulting in such moves being rejected. For the variance, one could use σA = wσL, where w can be chosen close to the mean of ti values. Nevertheless, such an initial attempt tended to get stuck in different clock models. Further efforts are needed to achieve reasonable mixing while giving more consideration to the deviation of the autocorrelated and independent distributions. Alternatively, a mixed relaxed clock model has been introduced to balance the autocorrelated and uncorrelated models (Lartillot et al. Reference Lartillot, Phillips and Ronquist2016), which is a sensible approach in the context of model averaging.
This study draws attention to the importance of comparing alternative relaxed clock models in dating analyses, something frequently overlooked in empirical studies. It is a good practice to test the fit of different clock models, as the pattern of evolutionary rate variation is likely data dependent. Carefully selecting relaxed clock models could also improve parameter estimates and MCMC performance, as shown in this study. Although the rjMCMC algorithm introduced here is applied to the morphological data of Mesozoic birds, it is generally applicable in any node dating or total-evidence dating approaches for which a relaxed clock model is suitable. Thus, it provides a general framework for selecting and averaging relaxed clock models. Future research will have to show how the algorithm performs on molecular sequences or a combination of both morphological and molecular data.
Software Implementation
The rjMCMC algorithm has been implemented in the latest development branch of MrBayes (Ronquist et al. Reference Ronquist, Teslenko, van der Mark, Ayres, Darling, Höhna, Larget, Liu, Suchard and Huelsenbeck2012b) available from GitHub (https://github.com/NBISweden/MrBayes) and will be included in the upcoming release version 3.2.8. The relevant commands of using this algorithm are listed here (with comments in square brackets). Complete commands are given in the Supplementary Material.
-
prset clockvarpr = mixed; [specify the mixed ILN and IGR clocks]
-
prset clockratepr = gamma(2, 100); [for the base evolutionary rate]
-
prset mixedvarpr = exp(0.5); [for the clock variance]
-
propset rj_clocks$ratio = 2.0; [initial value of w, or fixed if autotune = no]
-
mcmcp autotune = yes tunefreq = 5000; [auto-tuning (default) and batch length]
[Note:
1. Auto-tune is a global control, i.e., setting it to “no” disables auto-tuning for all proposals.
2. The relaxed clock model indicators (m_RCl) are recorded in .p files with 0 for IGR and 1 for ILN. The ‘sump’ command summarizes these values and prints the posterior probability of ILN (mean of m_RCl).
3. The “clockvarpr = igr” command in v. 3.2.7 and older is replaced by “clockvarpr = wn” in v. 3.2.8 to specify the WN model, while “clockvarpr = igr” and “clockvarpr = iln” in v. 3.2.8 specify the IGR and ILN models.]
Acknowledgments
I am funded by the Hundred Young Talents Program of Chinese Academy of Sciences and the Strategic Priority Research Program of Chinese Academy of Sciences (XDB26000000). I thank Fredrik Ronquist and Nicolas Lartillot for helpful discussions on the rjMCMC algorithm and M. Wang, S. Ho, D. Silvestro, R. Borges, L. H. Liow, and three anonymous reviewers for their useful comments on the article.
Data Availability Statement
Data available from the Dryad Digital Repository: https://doi.org/10.5061/dryad.51c59zw5b.


 Open access

