


The glycaemic response to an oral glucose tolerance test (OGTT) can be used to predict risk of development of type 2 diabetes mellitus( Reference Alys, Almgren and Akerlund 1 ). Low habitual physical activity is associated with undiagnosed impaired glucose tolerance and type 2 diabetes( Reference Dunstan, Salmon and Owen 2 ), and OGTT response is inversely related to physical activity levels in a population at risk of T2D development. However the relationship between habitual physical activity and OGTT response in a low-risk population is not as well understood. The study was approved by the Ethics Committee of Sheffield Hallam University and all participants provided written informed consent. Thirty-one non-diabetic adults (25·9yrs ±6·6; 23·8 kg/m2 ±3·8) participated. An OGTT was performed: capillary blood samples were obtained and analysed for blood glucose at baseline, 15, 30, 45, 60, 90 and 120 minutes after ingestion of 50 g of glucose. Participants were categorised into 3 groups based on self-reported physical activity levels: Sedentary (< 30 min.day−1 ‘moderate’ intensity activity, n = 11), Active (⩾ 30 min.day−1 of ‘moderate’ intensity physical activity, n = 10) and Very Active (⩾ 60 min.day−1 of ‘intense’ physical activity (n = 10). There were no significant differences between groups for age or percentage body fat (P > 0·05); however, there was a significant difference between groups for BMI (P = 0·043). Area under the curve (AUC) was significantly impacted by the intensity and duration of physical activity (P = 0·049) with the AUC of the very active group being significantly lower than that of the sedentary and active groups (P = 0·027 and P = 0·041 respectively). There was no significant difference between the active and sedentary groups (P = 0·844).
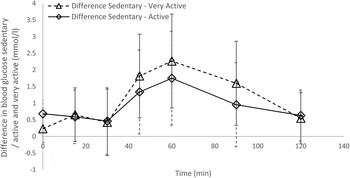
Fig 1 Difference in blood glucose levels between sedentary / active (diamond shape) and very active (triangle shape) participants. Error bars represent 95 % CI.
Differences in blood glucose response in non-diabetic subjects doing different amounts and intensities of physical activity needs further exploration; this preliminary investigation begins to identify where the differences may lie.

