


A major challenge in nutritional epidemiology is assessing dietary intake accurately enough to be able to reveal diet and health associations( Reference Reedy, Krebs-Smith and Miller 1 , Reference Harmon, Boushey and Shvetsov 2 ). For assessing habitual dietary intake, an accurate profile of foods consumed and an accurate estimation of portion sizes are of paramount importance. Diet is a universal exposure and self-reporting is the most common approach of dietary assessment used. Accurate self-report depends on a person's willingness to report and the ability to remember and estimate portion sizes( Reference Willett 3 ). Recovery biomarkers, such as doubly labelled water (DLW), have assisted researchers in identifying the level of accuracy of dietary self-report for total energy intake( Reference DeLany, Coulston, Boushey and Ferruzzi 4 ). Studies using DLW as a reference measurement for total energy expenditure (TEE) indicate that energy intake is underreported by 4–37 % depending on the population group and assessment method( Reference Thompson, Subar, Coulston, Boushey and Ferruzzi 5 , Reference Moshfegh, Rhodes and Baer 6 ). These results from studies using DLW and other recovery biomarkers( Reference Subar, Kipnis and Troiano 7 ) have motivated scientists to enhance dietary assessment methodology to improve the accuracy of dietary reporting.
As early as the 1980s, Hankin and Wilkens( Reference Hankin and Wilkens 8 ) used pictures of common foods in ranges of three different portion sizes determined systematically from dietary studies for use with paper-based dietary records and FFQ. Other systematic evaluations of using images to aid portion size estimation have been carried out( Reference Nelson, Atkinson and Darbyshire 9 ). With advances in technology, food images with portion sizes ranging from three to ten different choices have been incorporated into web or mobile applications for FFQ( Reference Forster, Fallaize and Gallagher 10 – Reference Kristal, Kolar and Fisher 12 ), dietary records( Reference Wilken, Novotny and Fialkowski 13 ) and 24-h dietary recalls( Reference Forster, Fallaize and Gallagher 10 , Reference Kirkpatrick, Subar and Douglass 14 , Reference Foster, O'Keeffe and Matthews 15 ). Multiple studies( Reference Nelson, Atkinson and Darbyshire 9 , Reference Forster, Fallaize and Gallagher 10 , Reference Foster, O'Keeffe and Matthews 15 ) have supported the use of images to enhance portion size estimation. Despite the gains documented using these professionally derived images these stock photographs are static images as they remain the same for all respondents. These images may or may not represent an exact replication of a food or foods consumed by respondents.
When static images are used, all participants view the same images and must translate the image to a personal experience to estimate portion sizes consumed or trigger memory of a food. Mobile technologies have changed the role of images from static to dynamic. When an individual takes pictures of his/her own eating occasions, the resulting unique images represent a true-life experience of an individual's actual foods eaten. These images create a dynamic collection of relevant information. A unique, more dynamic image can act as a reference for portion size, as well as act as a reminder of foods consumed and the context surrounding an eating occasion, such as the time of consumption. With regard to dietary assessment, the utility of a dynamic image likely exceeds the scope of a static image.
Dietary assessment methods using dynamic images, i.e. images captured by the respondent, can be subdivided into image-assisted and image-based approaches. Images taken with handheld devices or wearable cameras can be used to assist traditional dietary assessment methods for portion size estimations (image-assisted methods) or to aid in the recollection of foods eaten and not remembered. Image-assisted approaches can supplement either dietary records or 24-h dietary recalls. In recent years, image-based approaches integrating application technology for mobile devices have been developed (image-based methods). Image-based approaches aim at capturing all eating occasions by images as the primary record of dietary intake, and therefore follow the methodology of dietary records.
The present paper provides an overview of several image-assisted and image-based methods reported in peer-reviewed publications, a brief overview of implementation of these methods, followed by details on an image-based mobile food record (mFR) developed by a multidisciplinary team of nutritionists and engineers. This review comprises publications of image-assisted or image-based methods published between December 2013 and January 2016 as a follow up to the systematic review on image-assisted dietary assessment completed by Gemming et al.( Reference Gemming, Utter and Mhurchu 16 ). The more detailed description of the mFR also includes publications before December 2013 and through April 2016. Fig. 1 displays an overview of the technologies by image-assisted and image-based methods covered in this review.

Fig. 1. Image-assisted and image-based dietary assessment methods
Summary of image-assisted approaches
To provide an overview of possibilities to supplement conventional dietary assessment methods with images or video sequences, the latest studies using three different variations of the image-assisted approach are presented in Table 1. For the assessment of dietary intake of persons with intellectual and developmental disabilities, proxy-assisted dietary records are most commonly used. Proxy-assisted refers to a family member or support person assisting the participant in completing a dietary record. Ptomey et al.( Reference Ptomey, Willis and Goetz 17 ) analysed whether digital images are a feasible method to improve estimation of energy and macronutrient intake of proxy-assisted 3-d dietary records among adolescents diagnosed with intellectual and developmental disabilities. Twenty adolescents aged between 11 and 18 years with mild (intelligence quotient 50–69) to moderate (intelligence quotient 35–49) intellectual and developmental disabilities were given a tablet (iPad 2, Apple, Cupertino, CA, USA) to capture images of all food items consumed over three consecutive days of two weekdays and one weekend day. The participants were instructed to take before and after images by themselves and place a 5 × 5 cm2 checkered fiduciary marker in the image. Programmed prompts reminded the participants to take images. For the same 3-d period, the participants were asked to complete a paper-based proxy-assisted dietary record. After the recording period a dietitian reviewed the proxy-assisted dietary records with the participants to clarify and estimate portion sizes. The same procedure was undertaken with the images. All data were entered using the Nutrition Data System for Research for energy and macronutrient estimation.
Table 1. Overview of studies using image-assisted approaches to improve dietary data collected using traditional dietary assessment methods
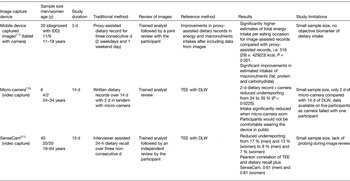
y, years; IDD, intellectual and developmental disabilities; TEE, total energy expenditure; DLW, doubly labelled water.
The authors estimated that participants captured images for 68 (sd 32) % of all eating occasions. The main reason for not capturing an image was due to prohibited mobile devices in their schools. The image-assisted records showed significantly higher estimates (P = 0·001) of total energy intake per eating occasion 2159 (sd 121) kJ (516 (sd 29) kcal)) compared with proxy-assisted records 1795 (sd 96) kJ (429 (sd 23) kcal)), after adjusting for age, sex, race and level of intellectual and developmental disabilities severity. This resulted in a 20 % higher total amount of energy reported per eating occasion and significantly greater intakes of total fat (P = 0·011), carbohydrates (P = 0·003) and protein (P = 0·004)( Reference Ptomey, Willis and Goetz 17 ). The most common difference between the image-assisted records and the proxy-assisted records without images was incorrect portion size (37 %), forgetting a food eaten (32 %), missing or incorrect details about food (28 %) and reporting a food that was not actually consumed (2 %).
These results would suggest that capturing images with a mobile device may be a successful approach to allowing independent diet data capture among children with disabilities. The study did not provide detail regarding the mechanics of downloading the images, which would be useful information for implementation by others. Future research in this area needs to include recovery biomarkers as an objective measure to ascertain the degree, if any, of misreporting.
Pettitt et al.( Reference Pettitt, Liu and Kwasnicki 18 ) developed a wearable sensor worn over the ear consisting of a microphone and a micro-camera. Eating sounds transmitted through the jaw, such as chewing, are recognised by the sensor in real-time triggering the camera to capture a video sequence. A pilot study was conducted among six volunteers aimed at assessing the accuracy of reporting using this device. TEE was measured using DLW over a 14-d period and the volunteers completed written dietary records over the 14 d. For two of the days during this period, the participants simultaneously wore the micro-camera. Dietary analysis software (Dietplan 6.0; Forestfield Software Ltd) was used to calculate mean daily energy intake from the written dietary records over the 14 d. If no portion details were provided by the participant, standard portion size estimations were used. For the 2-d period while wearing the micro-camera, a second analysis was completed using the additional details on food type and exact portion size captured with the camera. Mean underreporting was 34 % (3912 kJ (935 kcal); P = 0·01) for the 2-d food record compared with the mean TEE by DLW. The use of the data secured through the micro-camera reduced the underreporting to a mean of 30 % (3506 kJ (838 kcal); P = 0·0225). For the 2-d period of wearing the micro-camera, the mean energy intake as estimated by the dietary records was 7757 kJ (1854 kcal)/d. In contrast, using the dietary records over the 14-d period, the mean energy intake was 10162 kJ (2429 kcal)/d. This reduction in energy intake is indicative of a change in eating behaviour induced by wearing the micro-camera.
Participants reported they would not be comfortable wearing the device in public and that it would affect their activities( Reference Pettitt, Liu and Kwasnicki 18 ). These results would suggest that with the current format, significant user bias is introduced. Similar concerns were expressed by children aged between 8 and 13 years using a similar device, the eButton( Reference Beltran, Dadabhoy and Chen 19 ). Unless these approaches can address the discomfort expressed by the users, dietary data collected using these methods would need to be interpreted with caution.
SenseCam is a camera worn around the neck( 20 ). Once the camera is turned on sensors detect movement (accelerometer), heat (IR) and light to trigger image capturing every 20 s. Participants can activate a privacy button to cease image capturing temporarily. A study amongst forty participants aged 18–64 years tested validity of a SenseCam assisted 24-h dietary recall against the DLW technique( Reference Gemming, Rush and Maddison 21 ). Reported energy intakes measured from three multiple-pass 24-h dietary recalls alone and from the same dietary recalls enhanced with information from the SenseCam images were compared with TEE measured by DLW over a 15-d period. The participants wore the SenseCam on three non-consecutive days prior to the interviewer-administered 24-h dietary recall. After the participants screened the images privately, the researcher viewed the images and restated the self-reported foods and portion sizes. The 24-h dietary recall alone underestimated TEE by 17 % among men (P < 0·001) and by 13 % among women (P < 0·001). The images captured with the SenseCam reduced the magnitude of underestimation to 9 % for men (P = 0·02) and 8 % for women (P = 0·004). This reduction was derived predominantly from 265 unreported foods revealed in the images from SenseCam and these were often foods considered to be snacks( Reference Gemming, Rush and Maddison 21 ). The wearable camera significantly reduced underreporting in the 24-h dietary recall for men and for women, as the images revealed unreported foods and misreporting errors.
Despite the improvements to under reporting achieved with viewing the SenseCam images, there were at times some food items obscured due to the angle of the camera and in low-light, there was poor image quality. Thus, technical improvements in these areas could reduce further the level of under reporting. Contrary, to the study of Pettitt et al.( Reference Pettitt, Liu and Kwasnicki 18 ), the participants wearing the SenseCam were not as self-conscience about wearing the device. Additional studies with larger sample sizes and diverse populations comparing outcomes between several devices would be useful for moving this line of research forward.
Summary of image-based approaches
Image-based approaches rely on the captured images as the main source of information and only use additional input from the user as verification. The image capturing can be passive, meaning that in a defined time frequency the device automatically takes an image; whereas active approaches need the participant to take images. The studies using image-based approaches are summarised in Table 2.
Table 2. Overview of studies using image-based approaches to improve dietary assessment

y, years; FRapp, food record app; NuDAM, Nutricam Dietary Assessment Method; T2DM, type 2 diabetes mellitus; TEE, total energy expenditure; DLW, doubly labelled water; WFR, weighed food records.
The food record app (FRapp; ActiPal; MEI Research, Ltd.) offers six dietary intake input methods: (1) images; (2) typing in food descriptions; (3) speech-to-text conversions with food item extraction; (4) voice recording; (5) capturing images of food labels, nutrition facts or barcodes; (6) selecting from saved consumed food sets( Reference Casperson, Sieling and Moon 22 ). These input methods can be used single or combined, but have to be enabled by the investigator. In a usability study amongst eighteen adolescents, the amenability to use the FRapp combining capturing, annotating meal images and typing in free text food descriptions was analysed. Participants were instructed to take images of all eating occasion over 3–7 d from a 45° angle and place a fiducial marker into the image. After taking the image, participants were instructed to annotate each item, then eat their meal, and finally, capture an after image of any leftover foods or beverages. The adolescents recorded a mean of 3·2 (sd 1·3) d and a mean of 2·2 (sd 1·1) eating events per d. In 16 % of recorded eating events, all necessary components of before and after images, fiducial marker and description of foods were integrated( Reference Casperson, Sieling and Moon 22 ).
Work reported by Schap et al.( Reference Schap, Six and Delp 23 ) among adolescents stressed that any tool that provides a simple means to improve adolescent amenability with collecting dietary information without changing usual eating behaviours is an important advance. Many of the extra steps required for adolescents as part of the FRapp would likely be burdensome over time. As an example, the extra step of selecting an eating occasion as breakfast, lunch, dinner or snack prior to taking a picture is likely unnecessary. A mobile device will provide detailed time of eating, thus eliminating the user's burden of identifying the social label of an eating occasion that can differ throughout the world. One key to cooperation is making the process as simple as possible and placing the burden on technology rather than users( Reference Six, Schap and Zhu 24 , Reference Daugherty, Schap and Ettienne-Gittens 25 ). Casperson et al.( Reference Casperson, Sieling and Moon 22 ) included no information about acceptability among the study participants regarding FRapp, which is an important component of system design.
The Nutricam Dietary Assessment Method (NuDAM) is designed as a 3-d mobile phone image-based dietary record complemented with recorded notes immediately following image capture and combined with a brief telephone call to participants the following day( Reference Rollo, Ash and Lyons-Wall 26 ). The user needs to put a standardised card as a reference object in the image. After taking an image the user is automatically prompted to make a voice recording describing the foods and leftovers; as well as the location and meal occasion. The image and accompanying voice recording are then used by a trained analyst to identify and quantify the foods. For the energy and nutrient estimation the FoodWorks® program was used. Follow-up phone calls were implemented to clarify items and probe for commonly forgotten foods. The recordings of the follow-up calls are used to make any adjustments. In a pilot study amongst ten adults with type 2 diabetes mellitus, results from using the NuDAM in week 1 were compared to a weighed dietary record (WFR) in week 2 and both were used for 3-d periods (two weekdays and one weekend day). Over the 2-week period the DLW method was used to estimate TEE, which was compared with total energy from NuDAM and WFR. The overall mean energy intake was 8791 (sd 1996) kJ/d from the NuDAM and 8791 (sd 1795) kJ/d from the WFR. Both of these estimated energy intakes were significantly lower than mean TEE of 11791 (sd 2297) kJ/d (P < 0·01). Underreporting of energy intake was found for the NuDAM (−23·7 %) and WFR (−23·9 %). Participants described their preference to use the NuDAM over the WFR, citing ‘convenience’, ‘ease of use’, or ‘portability’. All participants reported willingness to use both recording methods again. The stated maximum period of using the NuDAM was 7 d or longer (n 9), whereas for the WFR it was up to 3 d (n 5)( Reference Rollo, Ash and Lyons-Wall 26 ).
The NuDAM tool requires a respondent to cooperate with many steps. The high level of cooperation was likely due to the individuals being committed to the process as an approach to diabetes control. The preference for NuDAM among the users would suggest that the amount of burden tolerated by individuals regarding a dietary assessment method is likely influenced by the potential to receive a direct health benefit from the process( Reference Pladevall, Divine and Wells 27 ).
Jia et al.( Reference Jia, Chen and Yue 28 ) developed a chest-worn camera device, called eButton, which automatically takes images at a pre-set rate during eating occasions. To date, the system has focused on the semi-automatic volume estimation of purchased foods. The image for the volume estimation has to be selected manually and a virtual three-dimensional shape is manually fitted to the portion. A computer program then estimates the volume of the fitted three-dimensional shape. The weight of the portion is then obtained from a database, such as the USDA Food and Nutrient Database for Dietary Studies, therefore only foods with an existing volume-to-weight conversion can be assessed. A referent needs to be placed in the image to allow for accurate volume estimation. As such, plates and bowls of known size are preferentially used as a fiducial marker for studies. In an experimental study including 100 images of known food samples, the mean difference of the computer results to the seed displacement method results was −5 % (95 % CI 29·2, 20·79)( Reference Jia, Chen and Yue 28 ).
In this study( Reference Jia, Chen and Yue 28 ), seed displacement was used as the criterion validation for volume. Different methods of displacement are available and would likely have provided more accurate volume estimations for soft foods, such as the stir-fried shrimp, stewed pork and potato, stir-fried zucchini, dumplings, noodles and spring rolls( Reference Okos and Boushey 29 , Reference Kelkar, Stella and Boushey 30 ). Thus, when estimating volume and/or gram weights of foods, a variety of methods should be applied for volume estimation. In a more recent study( Reference Beltran, Dadabhoy and Chen 19 ), portion size estimation of thirty-three food items using this same virtual three-dimensional shape method had a moderate ICC (intra-class correlation) agreement with known values (ICC = 0·60). The intra-class correlation was highest when data were limited to the estimates from dietitians for the same foods (ICC = 0·97).
Image review process
The described methods already briefly introduced the different types of image review processes. The main distinction is whether the image review process is done by a human-trained analyst or an automated method (see Fig. 2). In the case of a trained analyst reviewing the images, the participant can be included in the review process to clarify content of the images. This is the methodology used by Gemming et al.( Reference Gemming, Rush and Maddison 21 ), Ptomey et al.( Reference Ptomey, Willis and Goetz 17 ) and Kerr et al.( Reference Kerr, Harray and Pollard 31 ) all included in this review. With pattern recognition techniques and volume estimation, the process of identifying foods and estimating portion sizes can be automated. After the food items are identified by the automated system, either the participant or a trained analyst can be prompted to clarify possible misidentifications as described by Zhu et al.( Reference Zhu, Bosch and Woo 32 ) and shown in Fig. 3.

Fig. 2. Image review process

Fig. 3. Architecture of the technology-assisted dietary assessment (TADA) image-based system( Reference Zhu, Bosch and Woo 32 ). Step 1. User captures before and after images of an eating occasion with the mobile food record which runs on the iOS and android platforms. The images along with metadata, such as time and GPS coordinates, are sent to the server. Step 2. Initial image analysis completed using colour and other features to identify the foods and beverages. Step 3. Food identification results are returned to the user. Coloured bubbles with matching coloured pins label the foods (i.e. a unique colour for each identified food). Step 4. User reviews the labels and edits or confirms the labels. Once confirmed, the bubble and matching pin turn green. Once all labels are confirmed, the image is returned to the server. Step 5. Image analysis refinement and volume estimation completed. Step 6. Food and volume are matched to a food composition data base for energy and nutrient analysis. Researchers can view the images, metadata, food identification and analysis in real-time on a secure website and download data.
Overview and features of the mobile food record
The technology-assisted dietary assessment system( Reference Six, Schap and Zhu 24 , Reference Zhu, Bosch and Khanna 33 ) uses the integrated digital camera in a mobile device for taking food images. The technology-assisted dietary assessment system consists of two main parts: a mobile application that runs on a mobile telephone or tablet, which is known as the mFR and the backend secure cloud-like system consisting of computation for food image analysis (e.g. automatic identification and portion size estimation) and database servers. Crucial for the image analysis is the inclusion of the fiducial marker in the image, therefore an automated feature on the mFR alerts participants if the fiducial marker cannot be detected in the image( Reference Six, Schap and Zhu 24 , Reference Zhu, Bosch and Woo 32 , Reference Xu, Zhu and Khanna 34 ). The fiducial marker is used to calibrate the camera system with respect to colour and area measurements. A functional fiducial marker is usually in the form of a coloured checkerboard of known dimensions and colours. The dimensions and colour markings of the fiducial marker are known. Used as a reference for the spatial and colour calibration of the camera, the fiducial marker enables the identification of the foods and beverages as well as the portion size estimation( Reference Xu, Zhu and Khanna 34 ). To enhance the image analysis process, the image is best captured between a 45° and 60° angle. An angle-detection algorithm signalises the user via two interchangeable colour borders (i.e. red or green) in which position to take the image( Reference Xu, Zhu and Khanna 34 , Reference Xu, Khanna and Boushey 35 ). If the device is held in the correct angle, then the borders turn green and the user is tasked to take the image. After capturing the image, the user can decide whether the image is acceptable or needs to be retaken. The accepted images get automatically uploaded to a secure central server through wireless (WiFi) or cellular (3G/4G) networks. Push notifications can be sent to remind the participant to capture food occasions at pre-set times.
Automated food identification and portion size estimation
The images from the mFR are sent to a secure central server for image analysis (see Fig. 3). The methods for the automatic food segmentation and identification have been described previously( Reference Zhu, Bosch and Woo 32 ). Briefly, the food identification relies on statistical pattern recognition techniques, which classify the food by comparing the image with images in the database. The images in the database are characterised by a class label and several attributes such as texture features and colour features of the food items( Reference Zhu, Bosch and Woo 32 , Reference Zhu, Bosch and Khanna 33 ). The portion size estimation relies on the estimated volume of the identified food item. The volume estimation is performed based on three-dimensional reconstruction of the food item from the image as described previously( Reference Woo, Otsmo and Kim 36 – Reference Fang, Liu and Zhu 39 ). Images captured over a 24-h day by adolescents (n 15) were used to assess the error of automated determination of food weights compared with the known weights( Reference Lee, Chae and Schap 38 ). For the nineteen foods shown in Table 3, the mean ratios of automated weight estimates compared with known weights ranged from 0·89 to 4·61 (1·00 being perfect) when published in 2012( Reference Lee, Chae and Schap 38 ). After applying improved methods published in 2015( Reference Fang, Liu and Zhu 39 ), the mean ratios of automated weight estimates compared with known weights ranged from 0·62 to 1·26. These results outlined in Table 3 demonstrate how automated methods can improve over time with enhanced algorithms, whereas these levels of improvement for human subjects are less likely( Reference McGuire, Chambers and Godwin 40 ). The estimates of two condiments that were in transparent single serve containers regressed. Thus, for now, these items would retain the 2012 methodology as the preferred method. Once the volume estimate is derived, the nutrient intake is extracted from the data of the USDA Food and Nutrient Database for Dietary Studies( Reference Zhu, Bosch and Woo 32 , Reference Six, Schap and Kerr 41 ) (see Fig. 3).
Table 3. Accuracy of weight estimates from images taken by fifteen adolescents served three meals over a 24 h period using automated volume analysis converted to weights compared with known weights of foods

* Ratio of estimated weight to known weight. A value >1 indicates an overestimation. A value <1 indicates an underestimation.
† Items were in single-serve transparent condiment packs.
‡ Sheet cake cut into serving pieces.
§ Canned fruits.
The user is prompted to confirm or change the food identification made by the automatic classifier. The before eating image is displayed to the user in landscape view with coloured pins and labels identifying the foods. The user can confirm, remove or change labels on the food identification pins. The system presents the user four ‘Suggested Foods’( Reference Ahmad, Khanna and Kerr 42 ), ranked by the number of matching attributes. Beyond these four suggestions the user is free to search for other foods in the ‘Complete Food List’. If the user does not confirm the food, the automatic identification with the highest number of matching attributes is used.
Usability and transition into community dwelling conditions using the mobile food record
A study amongst forty-one boys and girls aged between 11 and 15 years assessed the willingness of adolescents to take images of food items of their eating occasions( Reference Boushey, Harray and Kerr 43 ). Adolescents attending a summer camp took images of consumed meals and snacks for two consecutive days. Following the recording period focus group sessions evaluated usability by means of content and themes on the mFR. At the end, a usability questionnaire was completed. The majority of the adolescents accepted the mFR. Variation according to sex and eating occasion were observed. Girls were significantly more likely than boys to capture images of their eating occasions (Fisher exact test, P = 0·03). Breakfast was captured most often (90 %, 36/40) and lunches (90 %, 72/80) compared with the least likely captured afternoon and evening snacks, 54 % (43/80) and 40 % (32/80), respectively. The focus groups revealed that games, rewards, and the need to know more about why they were using the app, were the major themes recommended to improve collection of all eating occasions with the mFR. The usability questionnaire showed that including a game component could be an approach to ensure capture of all eating occasions with the mFR. A high majority of the participants already indicated a willingness to use the mFR for 7 d or more.
A subset of the total sample took part in think-aloud method sessions to evaluate the usability of the user confirmation component of the mFR, which includes the food identification review. This subset of participants took part in the think-aloud method sessions to aid with evaluating the configuration and ease of these steps comprising the image review process. The children found the steps easy to use except for some confusion with overlapping markers on the screen which has subsequently been addressed. The images can be expanded to allow uncluttered viewing of the foods and their respective pins( Reference Boushey, Harray and Kerr 43 ).
The amenability and acceptability of the mFR were examined among young children aged between 3 and 10 years attending summer camps. The aim was to determine if children of this age range could successfully capture a usable image pair or pairs with the mFR( Reference Aflague, Boushey and Guerrero 44 ). The first sample of sixty-five children was recruited from a summer camp in Guam 2013 and the second sample of seventy-two children in 2014. While sample 1 was tasked to capture at least one image pair of one eating occasion during the summer camp, sample 2 was tasked to record all eating occasions for two consecutive days at two time periods that were 2–4 weeks apart. The usability of the image pairs were rated by trained analysts. All children (n 63) returned the smartphones undamaged. A majority, 90 % of sample 1, took one usable image pair, 70 % of the image pairs had the fiducial marker included, 95 % had foods and beverages present, and 70 % had both the before and after images. The usability of the mFR as well as the fiducial marker was found to be easy for 89 and 94 % of the children in samples 1 and 2, respectively. For the sample 2, the mean number of captured image pairs during the first time period was 6·21 (sd 4·65). For the second time period, the mean was 5·65 (sd 3·26). For the sample 2, the images were used to estimate fruit and vegetable intakes. The levels of cooperation were impressive considering that these studies concentrated on child involvement without the assistance of parents or care givers.
The focus of the Connecting Health and Technology study was to investigate the effectiveness of tailored feedback and weekly text messaging as a method to increase serves of fruit and vegetables and decrease serves of energy dense nutrient poor (EDNP) foods ( Reference Kerr, Harray and Pollard 31 , Reference Kerr, Pollard and Howat 45 ). The EDNP foods are primarily identified as fast food, sweets and sugar-sweetened beverages. The target population of a 6-month three-arm, parallel, randomised control trial was 247 young adults aged between 18 and 30 years. They were equally randomised to one of three groups: (A) dietary feedback and weekly text messages, (B) dietary feedback only or (C) control group. All three groups were tasked to capture images of all food occasions using the mFR over a 4-d period at baseline before randomisation and post-intervention. Group A received personalised dietary feedback on their intake of fruits and vegetables, EDNP and sweetened beverages and weekly motivational and informative text messages. Group B received the dietary feedback without the weekly text messages and group C (control group) received none. Comparing baseline to the end of the 6-month study, group A significantly reduced EDNP food (P < 0·05). Group B increased vegetables intake and reduced sweetened beverages and EDNP food, and the control group significantly increased vegetable intake (P < 0·05).
A major strength of this study was the high retention level achieved, which may be partly attributed to the level of engagement in technology by using the mFR app. Of note the data collection of diet information using the mFR was similar for each group, even the control group, at each time point. Although the control group only had two interactions with the research team 6 months apart, 89 % completed the study, including the completion of the 4-d of diet record using the mFR at the beginning and the end of the study.
In the Connecting Health and Technology study, a trained analyst identified foods and beverages in the images. Then the trained analyst estimated the portion sizes from the images. When needed, the trained analyst consulted with a participant to clarify information (see Fig. 2). As image-based methods continue to move towards automation of analysis, this may further improve the accuracy of the dietary assessment( Reference Zhu, Bosch and Khanna 33 , Reference Zhu, Bosch and Khanna 46 , Reference Meyers, Johnston and Rathod 47 ).
Conclusion
Mobile technology offers a wide range of feasible options for dietary assessment, which are easier to incorporate into daily routines. The presented studies illustrate that image-assisted methods can improve the accuracy of conventional dietary assessment methods by adding detail from dynamic images to participants’ self-reports. All of the studies reduced underreporting with the help of images compared with results with traditional assessment methods alone. Larger sample sizes are needed to get more detailed information on subgroups and to make results generalisable.
Image-based methods hold the capability of substituting for conventional methods. The image-based methods are well received by users and preferred over traditional dietary records. The mFR is designed to automatically identify foods and estimate portion sizes. Prospectively, automated food identification and portion size estimation will be analysed in more detail and refined to aim at substituting the review of images by trained analysts. None of the studies reviewed addressed costs. Delineating the associated monetary and/or time costs would allow researchers and practitioners to compare costs with potential benefits.
Acknowledgements
The authors would like to thank Luke Gemming for sharing search methods and search outcomes from a review of image-assisted dietary assessment methods conducted prior to December 2013.
Financial Support
Support for this work comes from the NIH, NCI (grant numbers 1U01CA130784-01 and P30 C071789); NIH, NIDDK (grant numbers 1R01-DK073711-01A1 and 2R56DK073711-04); NIH, NIEHS (grant number 2R01ES012459-06); and Department of Health, Western Australia, Healthway Health Promotion Project Grant No: 18932.
Conflict of Interest
None.
Authorship
C. J. B. and M. S. developed scope of the review and conducted search for review papers; M. S. prepared first draft; C. J. B. prepared version of manuscript for co-author review; C. J. B., D. A. K., E. J. D. and F. M. Z. designed, carried out and analysed studies used for review of the mobile food record; C. J. B., M. S., D. A. K., E. J. D. and F. M. Z. reviewed and contributed to final manuscript.


