Previous research has shown a biphasic pattern underlying resting metabolic rate (RMR) in women, namely RMR greater in the luteal phase (LP) than in the follicular phase (FP) of the menstrual cycle (MC)(Reference Solomon, Kurzer and Calloway1, Reference Howe, Rumpler and Seale2), although others have shown no differences between phases(Reference Piers, Diggavi and Rijskamp3, Reference Henry, Lightowler and Marchini4). When alterations have been found, these have been attributed to changes in ovarian hormones, i.e. oestrogen and progesterone, throughout the MC. The aim of this study was to investigate whether RMR fluctuates significantly in women with regular and natural MC.
Eleven healthy women, aged 26·6 (SD 5·9) y, BMI 22·7 (SD 2·2) kg/m2 and experiencing regular MC (25–35 days), were tested three times a week during an entire MC. Subjects attended the laboratory after an overnight fast for the assessment of their RMR, oestrogen and progesterone levels. RMR was measured for 30 min by indirect calorimetry using a ventilated hood system. Ovarian hormone levels were measured in venous blood sample and analysed by an Electrochemiluminescense Immuno-Assay (ECLIA). RMR fluctuations were determined by co-efficient of variation (CV%) and differences between phases were analysed using one-way ANOVA for repeated measures.
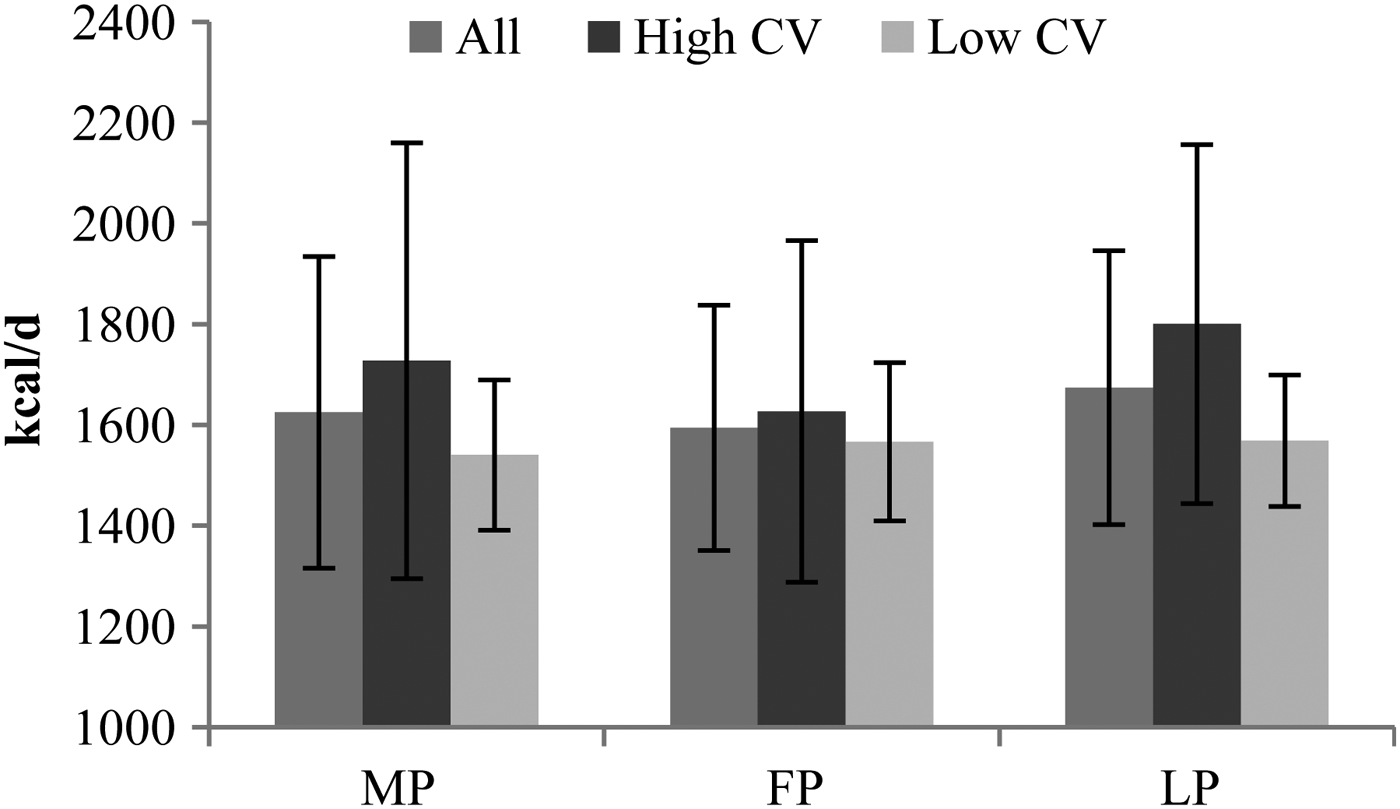
There were no significant differences in RMR between the menstrual phase (MP), FP or LP. Mean intra-individual variation (CV%) in RMR was 6·3 (SD 2·8) % and ranged from 3·0–11·7 %. When dividing the sample between women with high (n 5) and low (n 6) intra-individual variation (CV> and ≤5%, respectively) the difference in RMR between the LP and FP increased in the high CV group, although it did not reach significance.
The LP presented significantly higher oestrogen and progesterone levels than the MP and higher progesterone than the FP. Moreover, oestrogen was significantly greater in the FP than the MP. There were no correlations between the hormones and the RMR in the different phases. There were no significant differences in hormone levels throughout the MC between the high and low CV% groups.
Although no significant differences were found in RMR between the phases of the MC in all subjects, there was a trend towards a higher RMR in the LP and this was particularly evident in females with a high CV% in their RMR. Further work is required to investigate the exact mechanisms underlying these variations.


Values are means of hormones for three phases. *Significantly different to the FP; §significantly different to the LP (p ≤ 0·05)

