


Is democracy backsliding worldwide? Relying on prominent cross-national indices including Varieties of Democracy (V-Dem), Freedom House, and Polity, many observers warn that democracies are increasingly “under siege” around the world (Repucci and Slipowitz Reference Repucci and Slipowitz2021). In this symposium, Little and Meng (Reference Little and Meng2023) (hereafter L&M) raise the concern that these indices, most notably V-Dem, rely on “subjective” indicators based on expert evaluations. As a result, what appears to be global democratic decay could be an artifact of coder bias. Using more “objective” indicators that focus primarily on electoral competitiveness, constraints on the executive, and threats against journalists, L&M find little to no evidence of worldwide democratic decline.
We argue that one promising way to adjudicate between these conflicting perspectives is to study the events associated with democratic backsliding and the resistance to it. At present, it is difficult if not impossible to map changes in existing indices—subjective or objective—to the actual political phenomena that cause countries’ scores to increase or decrease over time. Drawing on data from a beta version of the Democratic Erosion Event Dataset (DEED), we show that event data can help to explain discrepancies between different democracy indices and, in doing so, deepen our understanding of the nature and extent of democratic backsliding around the world.
Drawing on data from a beta version of DEED, we show that event data can help to explain discrepancies between different democracy indices and, in doing so, deepen our understanding of the nature and extent of democratic backsliding around the world.
The article begins by describing the unique methodology through which DEED is created: students write qualitative case studies informed by various publicly available sources, which research assistants then systematically transform into quantitative data using a detailed codebook. The examples of Turkey and Brazil illustrate the dataset’s utility for evaluating the extent to which changes in different democracy index scores reflect developments on the ground. In the case of Turkey, we show that an objective index like L&M’s may underestimate the extent of democratic erosion by focusing too narrowly on electoral competitiveness and executive constraints. Doing so ignores events—in this case, a failed coup and massive state repression of peaceful protests—that clearly constitute threats to democracy, according to many if not most definitions of the term.
More broadly, we argue that L&M’s approach may underweight events that degrade the quality of democracy but do not (and may never) result in changes to electoral institutions and outcomes or that are difficult to measure objectively, such as threats to civil liberties or attacks on the independence of the judiciary. These types of events are common in eroding democracies and are more likely to be captured by subjective indices. Although objective indicators, in principle, could incorporate these events, doing so would introduce additional coder discretion and further blur the line between objective and subjective approaches.
Conversely, in the case of Brazil, we show that a more subjective index like V-Dem may overestimate the degree of democratic erosion by overweighting events with ambiguous and debatable implications for the quality of democracy, such as anti-democratic rhetoric that does not materialize into action. To be clear, we do not view either L&M or V-Dem as more correct or informative in a general sense. Neither do we assert that objective indices will always underestimate the extent of democratic erosion or that subjective indices will always overestimate it. We also do not propose our events-based approach to studying democratic erosion as a substitute for either objective or subjective indicators. Rather, we view it as a complement that can help researchers to look under the hood of existing indices and adjudicate discrepancies between them that otherwise are difficult to resolve.
We also emphasize that there are broader benefits of event data for democratic erosion research—in particular, its ability to document elite strategies for consolidating power, popular or bureaucratic resistance to those strategies, and the more general dynamics and mechanisms underlying democratic stability and change that scholars may want to study more systematically. In this way, we hope that event data like DEED will help researchers to understand not only whether democracy is backsliding but also how and why. We discuss these benefits in the conclusion.
…we hope that event data like DEED will help researchers to understand not only whether democracy is backsliding but also how and why.
INCREMENTAL DEMOCRATIC BACKSLIDING AND EVENT DATA
DEED is an event dataset supported by the Democratic Erosion Consortium (DEC).Footnote 1 Although still in development, the current beta version includes 5,523 events across 143 countries between 2000 and 2022, with more coverage of some countries than others (Baron et al. Reference Baron, Blair, Gottlieb and Paler2023). We chose 2000 as the start of the panel for tractability and because democratic backsliding has been discussed prominently in the academic literature only in the past decade or so. We initially focused on coding democratic countries that appeared to be eroding as evidenced by year-on-year declines in V-Dem’s liberal democracy index. We have expanded the dataset well beyond this initial scope condition—for example, by including autocracies—such that it now covers the majority of countries globally (excluding microstates), with more added in each annual update. Because the data for 2021 and 2022 are still under construction, this article focuses on the period from 2000 to 2020.
Building DEED
DEED follows a two-step process for identifying and coding events. First, students enrolled in a DEC-led course on democratic erosion produce case studies using a standardized template. Second, research assistants use a detailed codebook to convert these qualitative narratives into quantitative data.Footnote 2 Thus, unlike datasets that use machine learning or web scraping to identify relevant sources, humans curate the information in DEED in two stages. We developed the event framework for the DEED codebook through an inductive process that combined insights from the existing literature with lessons learned from progressively test-coding actual cases. Although the same codebook is applied to all country-years, some categories of events are regime specific. For example, when a candidate or media outlet rejects the results of a free and fair election in a democracy, this may be indicative of democratic erosion, whereas when an opposition candidate or media outlet disputes a fraudulent election in an autocracy, this may be a sign of resistance to autocratic consolidation.
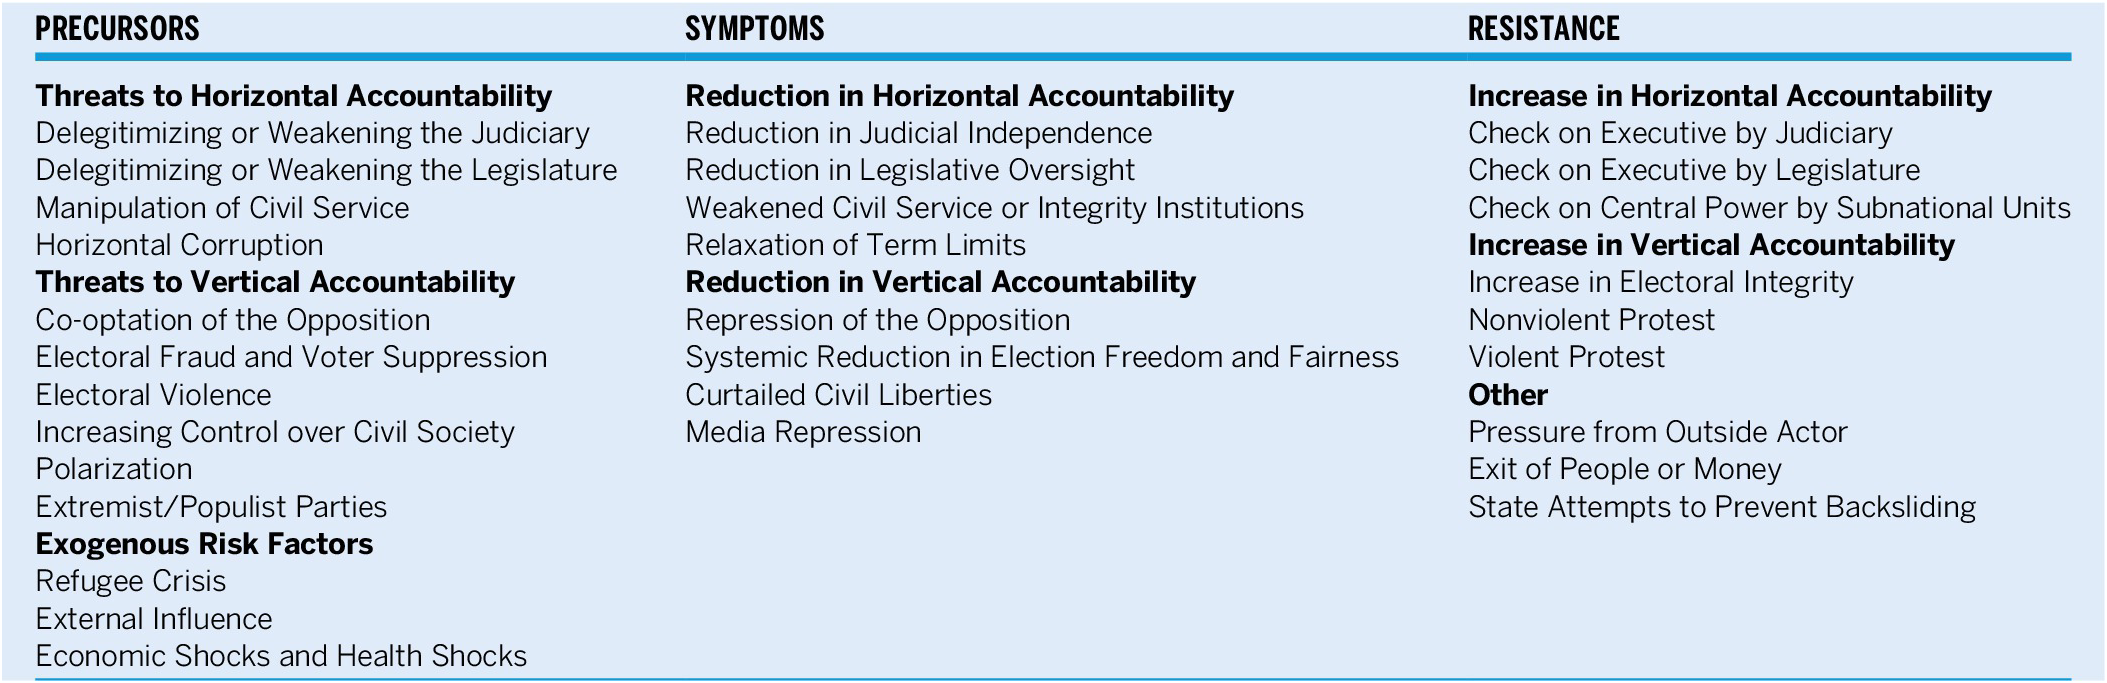
In addition to these event codes, we created a classification scheme to distinguish events that often precede democratic erosion (precursors) from those that constitute erosion (symptoms) and those that counteract erosion after it already has begun (resistance).Footnote 3 Tracking precursors can help researchers to understand when and under which conditions emerging threats to democracy metastasize. Measuring resistance illuminates the strategies that have been more or less successful at slowing or reversing democratic decline and also distinguish cases of democratic stability in which there are no (or few) threats to democracy from those in which threats are neutralized as they occur. These two types of cases may differ in important ways but may be indistinguishable using standard democracy indicators. Within these three categories, we further divide events into those related to vertical or horizontal accountability.Footnote 4 Sample event codes and classifications are shown in table 1.Footnote 5
Table 1 Sample Event Codes and Classifications for DEED
We validate the data in multiple ways. First, DEED includes primary-source citations for the majority of events (93%). Sources include local and international news outlets, peer-reviewed journals in political science and area studies, and reports from think tanks and local and international non-governmental organizations (NGOs). When a case study specifies a source for an event, research assistants verify the source; when it does not, they seek to identify one. Second, research assistants score the credibility of the sources underlying each event. Third, for most countries, DEED draws on multiple case studies (i.e., 4.1 on average), which ensures that we consistently and reliably capture events. Fourth, research assistants append brief narrative descriptions to all events in the dataset, which allows users to quickly judge whether any given event should count as democratic erosion.Footnote 6
We are currently in the process of using alternative sources of information to capture events that students’ case studies may have missed (i.e., false negatives) and to remove or recategorize events that are miscoded or mistakenly included in the data (i.e., false positives). Most notably, we are coding Freedom House’s annual Freedom in the World country reportsFootnote 7 using the DEED framework, converting the qualitative information in them to quantitative data that can be merged with DEED. We have coded 326 of these reports thus far. The DEC will support yearly updates to DEED to add new country-years and expand or improve the description and categorization of existing events using new case studies. The next version, for example, will add months to each observation to allow for a better understanding of the sequencing of events. We also will engage country experts to further validate the data, in partnership with international NGOs. We post updates to the dataset and codebook on our website at www.democratic-erosion.com.
The beta version of DEED is more comprehensive for some countries and years than others, and we expect that patterns in the data may change with subsequent updates. With this caveat, as shown in figure 1, the most common precursors of democratic erosion in the beta version are violence by state (most common) and non-state (fifth most common) actors; vertical (second most common) and horizontal (fourth most common) corruptionFootnote 8; and the rise of extremist or populist parties (third most common). Perhaps more telling, the top three most common symptoms affect vertical accountability: media repression, curtailing of civil liberties, and repression of the opposition. The fourth most common symptom affects horizontal accountability (i.e., reductions in judicial independence) and the fifth most common (i.e., systemic reduction in election freedom and fairness) also is vertical. By far, the most common type of resistance to democratic erosion is nonviolent protest, followed by pressure from outside actors and checks on the executive by the judiciary. Additional descriptive statistics from DEED are in online appendix B.
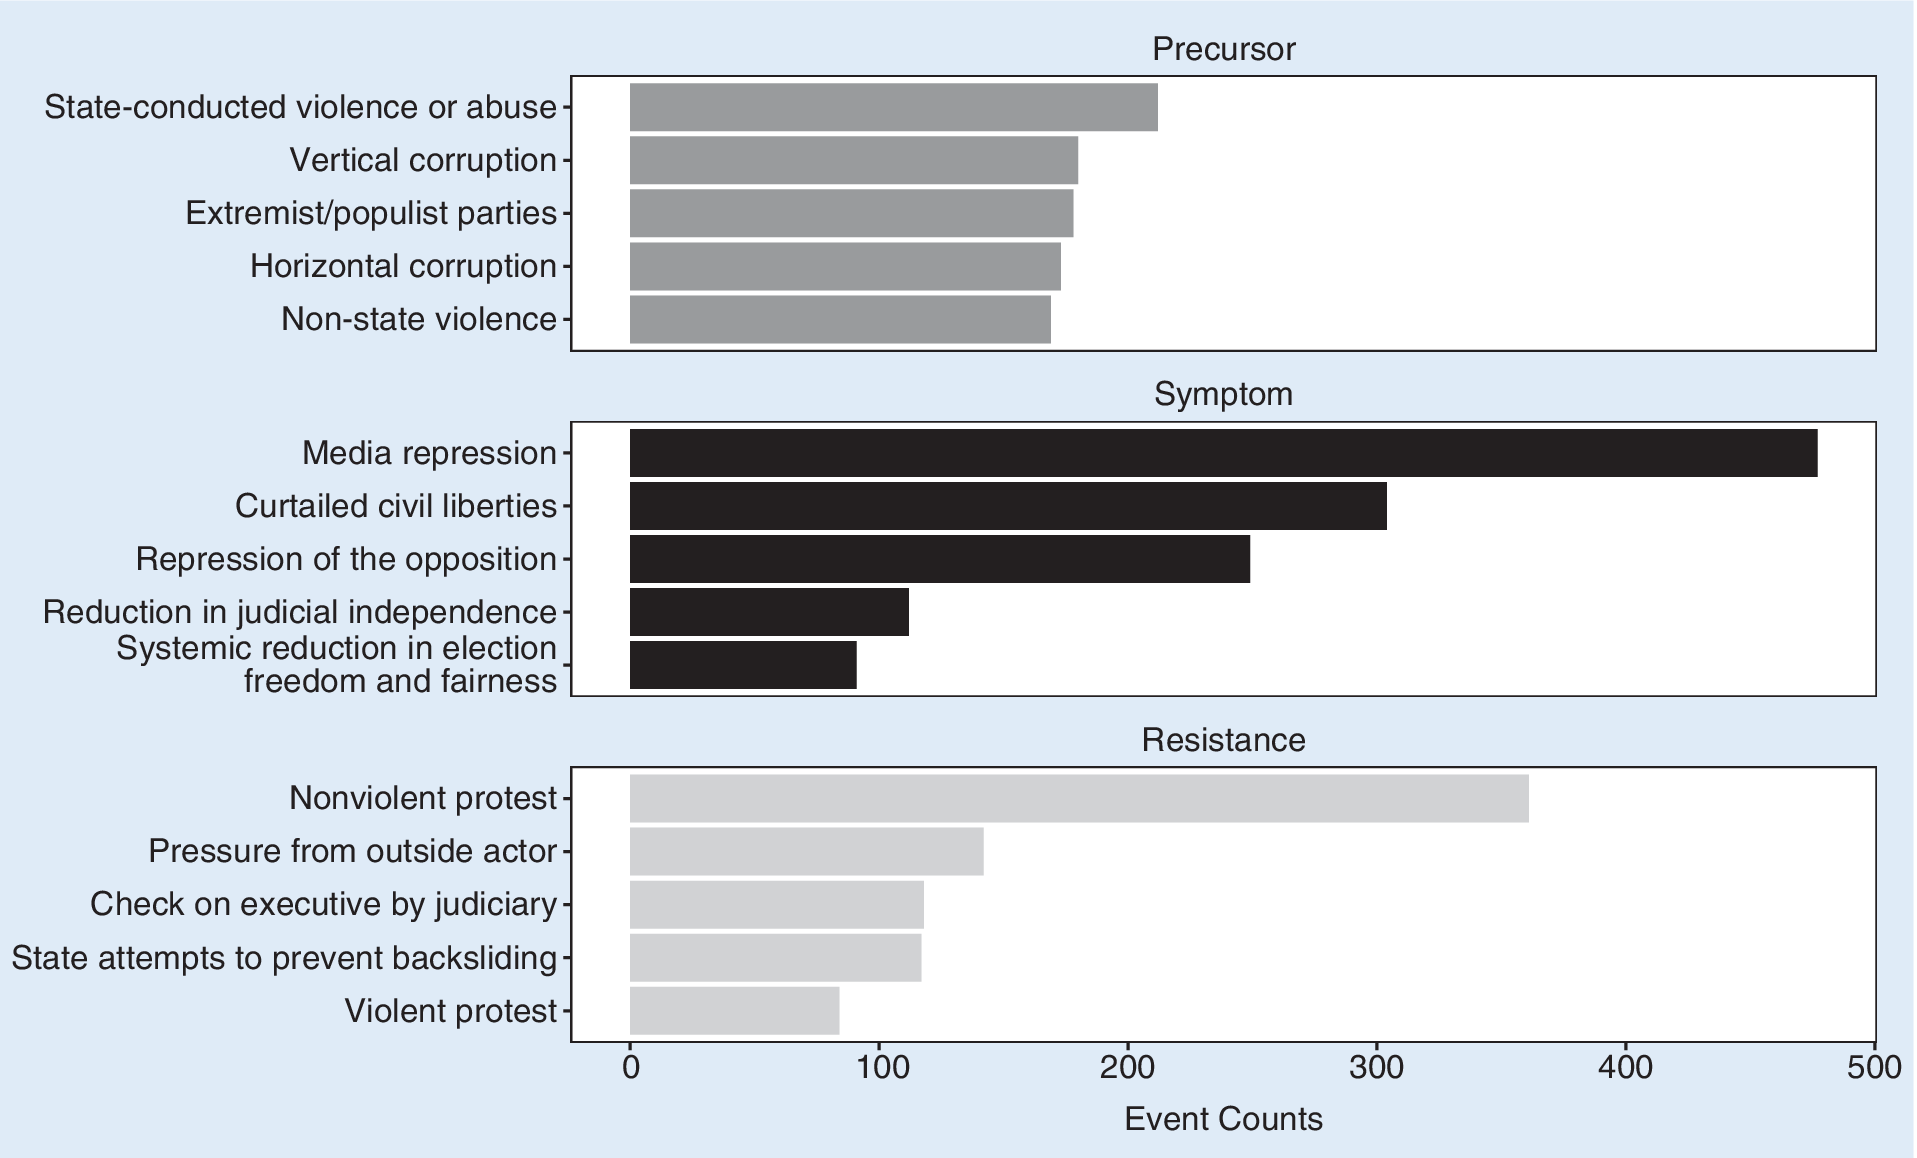
Figure 1 DEED Event Counts by Category and Type
Counts for the most common events in the precursor (top panel), symptom (middle panel), and resistance (bottom panel) categories in DEED, aggregating across all countries and from 2000 to 2020.
Overall, these patterns suggest that undermining vertical accountability may be easier or less costly for elites. They also suggest that some of the most pervasive manifestations of democratic erosion (e.g., reductions in civil liberties) may elude objective indices that focus primarily on electoral institutions and outcomes. We explore this possibility in more detail through the two case studies described in the next section.
DEED IN COMPARISON
To illustrate DEED’s utility, we examine trends in the quality of democracy in two countries—Turkey and Brazil—for which DEED is already relatively comprehensive, and for which the V-Dem electoral democracy index (i.e., v2x_polyarchy) and L&M’s objective democracy index differ dramatically. Importantly, L&M note that their index is not designed to be a “substitute for existing democracy indices” and is intended only to “summarize the aggregate trends” in their disaggregated indicators (Little and Meng Reference Little and Meng2023, 17). However, they also compare their index to V-Dem across all countries and in specific subsets of countries (e.g., democracies and autocracies). Moreover, they note that changes in the index “can give a general sense of how indicators related to the quality of democracy have changed over time” (Little and Meng Reference Little and Meng2023, 17). We use their index in this same spirit.
To complement the L&M index, we also compare trends in V-Dem’s electoral democracy index to the “objective-to-subjective score mapping” (OSM) index proposed by Weitzel et al. (Reference Weitzel, Gerring, Pemstein and Skaaning2023) in this symposium. The OSM index aims to overcome some of the potential empirical and conceptual problems with L&M identified by other contributors to the symposium. OSM is derived from a random-forest model trained to predict scores on existing “subjective” democracy indices (including V-Dem’s) using 26 “easily observable features of democracy” (Weitzel et al. Reference Weitzel, Gerring, Pemstein and Skaaning2023, 3). Online appendices C and D compare V-Dem’s electoral democracy index to trends in the disaggregated indicators that L&M and Weitzel et al. (Reference Weitzel, Gerring, Pemstein and Skaaning2023) propose.
Before proceeding, we emphasize that we do not view DEED as either “objective” or “subjective;” the dataset incorporates elements of both approaches. If objective indicators are defined as those that can be verified independently or otherwise are less susceptible to coder bias, then some DEED indicators meet this definition (e.g., relaxation of term limits). However, other indicators do not: manipulation of the civil service and repression of the opposition, for example, require subjective assessments of what constitutes “manipulation” and “repression.” Moreover, even in the case of relatively objective events, DEED relies on the subjective judgment of students and research assistants to determine whether any given event warrants inclusion in the dataset (although we err on the side of inclusivity) and, if so, which event code to apply to it.
Like all attempts to measure democratic backsliding (including L&M’s), DEED involves decisions about how to initially conceptualize and operationalize the phenomenon. This process of selecting indicators is inherently subjective, even if the indicators ultimately are not considered subjective, and subjectivity of this type can have important implications for understanding democratic erosion, as our case study of Turkey illustrates. DEED’s transparency allows users to make these decisions in a principled and systematic way, not only for classes of indicators but also for individual events. That is, because (almost) all events in DEED have sources and short narrative descriptions attached to them, users can decide whether and how to include them in their analyses. When comparing DEED to V-Dem and L&M, the primary distinction we want to draw is not between objective or subjective approaches but rather between events and more highly aggregated indicators and indices.
Turkey
Figure 2 plots the V-Dem, L&M, and OSM indices for Turkey for 2000–2020. Between 2000 and 2012, the V-Dem and L&M indices trend roughly in parallel. Beginning in 2012, however, they diverge sharply, yielding incompatible conclusions about the trajectory of Turkish democracy. According to V-Dem, Turkey’s electoral democracy score decreased by 0.318 points, from approximately the 63rd percentile worldwide in 2000 (0.606) to the 26th percentile in 2020 (0.288). This decline is approximately equivalent in magnitude to the difference between Ecuador and Zimbabwe or between Poland and Libya in V-Dem’s 2020 data. In terms of percentiles, only five other countries experienced declines more dramatic than Turkey’s during this period (i.e., Bolivia, Hungary, Nicaragua, Thailand, and Venezuela). According to L&M, in contrast, the quality of Turkish democracy in 2020 was virtually indistinguishable from its quality in 2000, with modest peaks and valleys in between. The OSM index tracks very closely with L&M and, if anything, suggests that the quality of democracy in Turkey improved between 2000 and 2020.
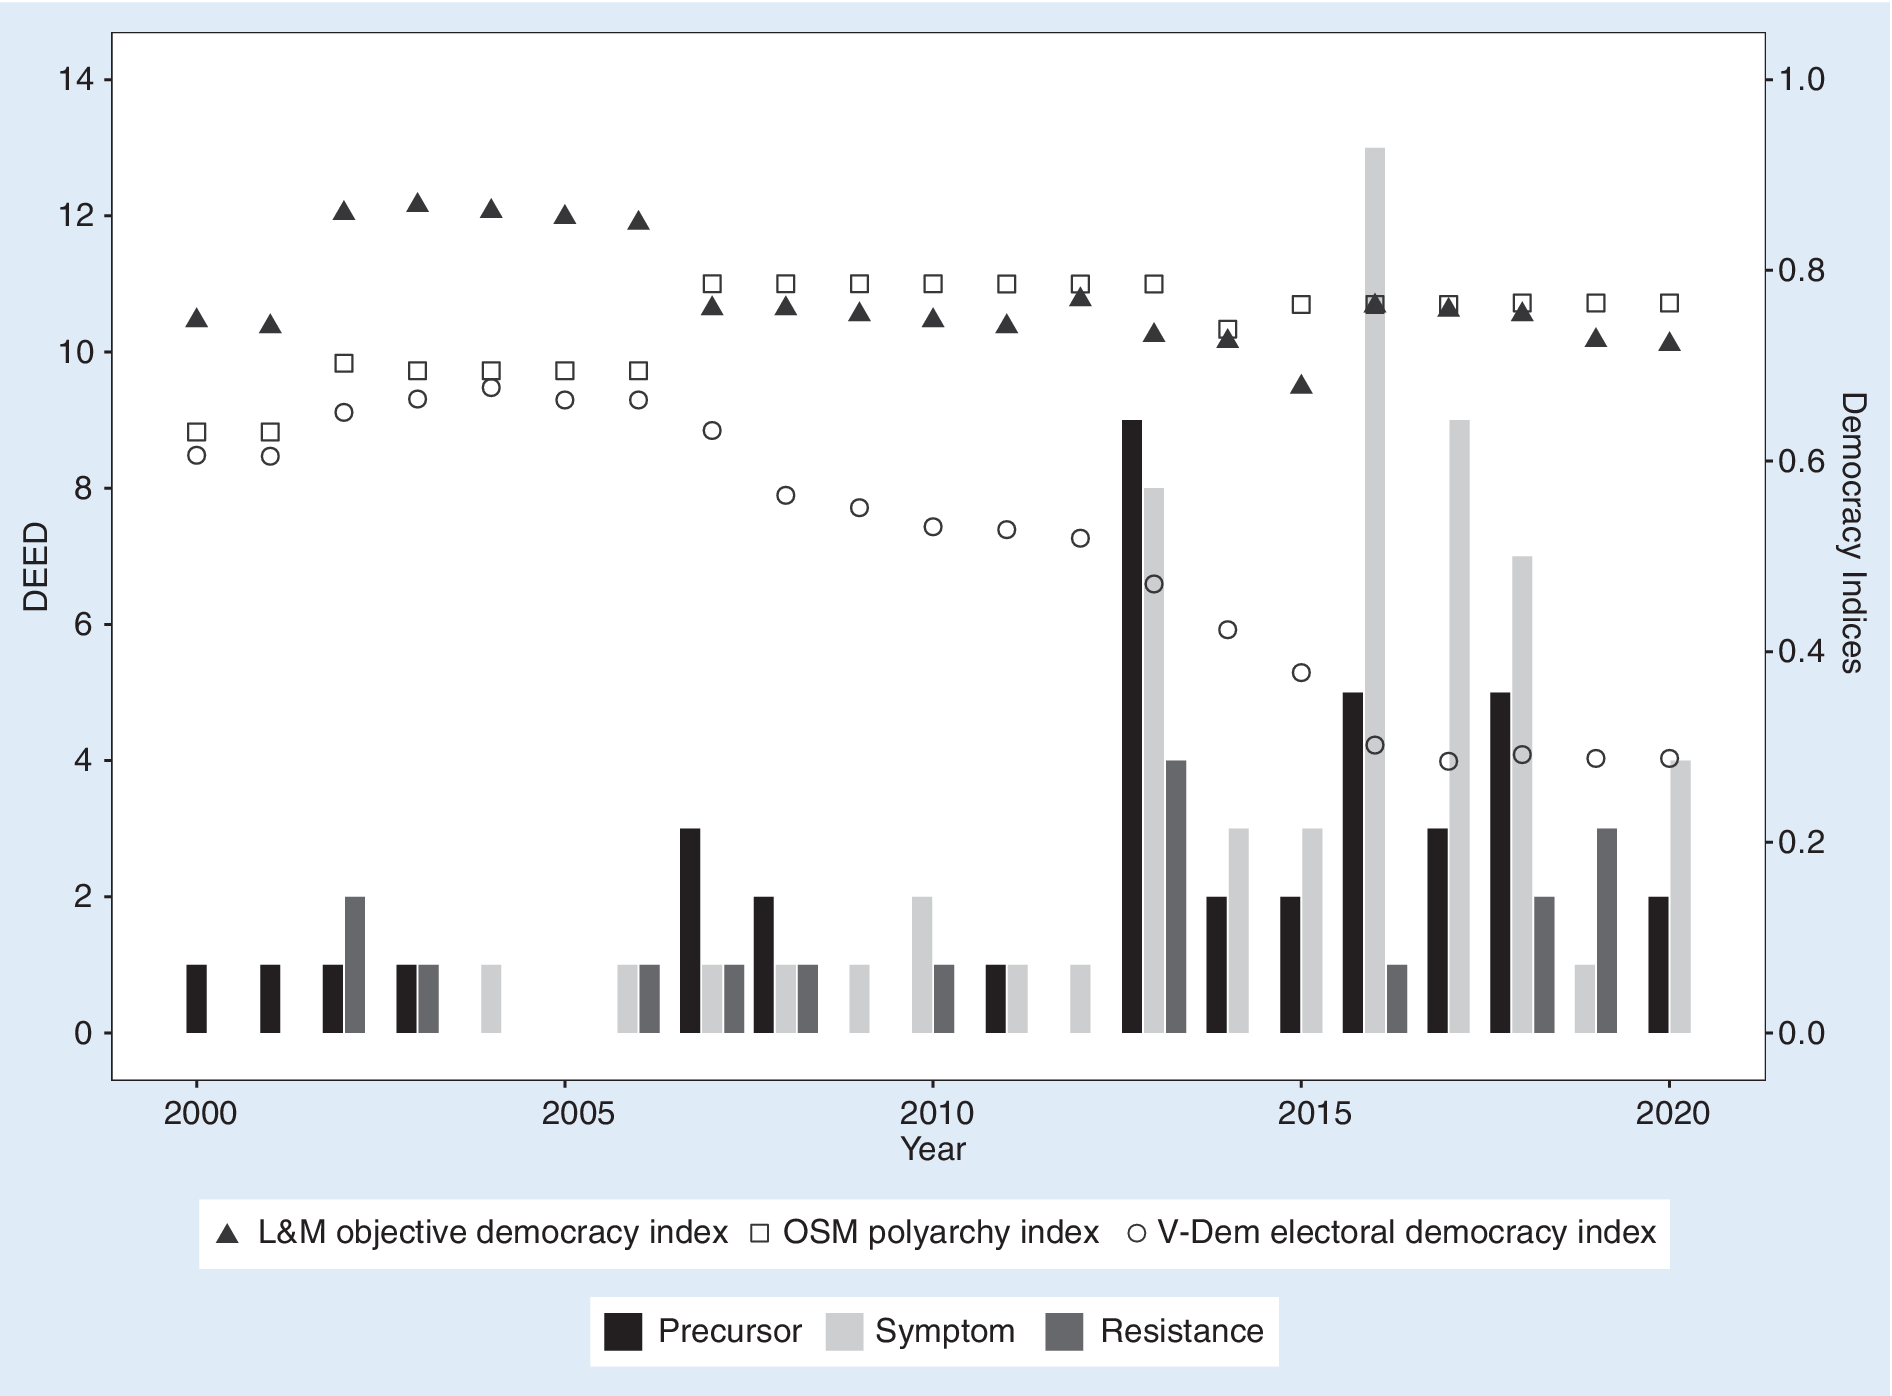
Figure 2 Measuring Democracy in Turkey
On the y-axis on the left-hand side, counts for all events in the precursor (gray bars), symptom (dark gray bars), and resistance (light gray bars) categories in DEED for Turkey from 2000 to 2020. On the y-axis on the right-hand side, trends in the L&M (dark gray triangles), OSM (white squares), and V-Dem (white circles) indices. All three indices are scaled to range from 0 to 1.
To illuminate the source of these discrepancies, figure 2 also plots the number of precursor (57), symptom (38), and resistance (17) events in Turkey according to DEED during the same 20-year period. DEED records few events of any type during the first decade of the panel, but it shows a spike in all three types of events in 2013, followed by an even more dramatic spike in 2016. Events persist at elevated (albeit declining) levels in 2017 and 2018 as well. These trends correspond to a series of high-profile events. In May 2013, demonstrators gathered in Istanbul’s Gezi Park to protest the government’s urban development plans. State security forces violently evicted the demonstrators, catalyzing a wave of protests across the country, to which the government responded brutally. Three years later, in July 2016, a small faction of the Turkish Armed Forces launched a failed coup against President Recep Tayyip Erdogan. In response, Erdogan’s regime declared a state of emergency and arrested or otherwise forced from their jobs thousands of soldiers, police officers, judges, and journalists.
Failed coups and massive state repression likely would qualify as symptoms of democratic erosion by even minimalist definitions of democracy.Footnote 9 However, because these events did not precipitate legal or institutional changes banning opposition parties or lifting term limits or otherwise affecting (most of) the subcomponents of L&M’s index, the index appears to underestimate their importance for the quality of Turkish democracy.Footnote 10 Indeed, appendix C shows that of the 12 indicators that comprise the L&M index, seven are constant throughout the panel (although four of the seven are missing for most years). Of the five subcomponents that vary, only two suggest that Turkish democracy may have eroded between 2000 and 2020. None of these five indicators declines in response to the Gezi Park protests or the repression that followed, and only two—the multiparty and process violations indices, both from National Elections Across Democracy and Autocracy (NELDA)—appear to fall around the time of the failed coup in 2016. The OSM index does not capture these events either: it decreases slightly in 2014, increases again in 2015, and then remains constant throughout the remainder of the panel.
Of course, in principle, L&M’s selection of indicators could be expanded to encompass massive state repression and failed coups. However, whereas these events could be considered relatively objective, new indicators likely would introduce new opportunities for time-varying coder discretion and potential bias. For example, new objective indicators would require subjective decisions about what counts as repression and how massive it must be to constitute a threat to democracy. Incorporating new indicators also likely would require extending L&M’s quasi-minimalist definition of democracy, raising further questions about which indicators to include in the first place.
L&M anticipate this concern by arguing that even if democracy is eroding in ways that elude objective measurement, the extent of erosion nevertheless should be reflected in objective indicators focused on elections. Weitzel et al. (Reference Weitzel, Gerring, Pemstein and Skaaning2023) make a similar argument in their contribution to this symposium. However, as the example of Turkey illustrates, this is not necessarily true. (The example of the 2020 US presidential election and the January 6, 2021, assault on the US Capitol illustrates the point as well.Footnote 11) V-Dem’s more “subjective” approach does seem to capture the fallout from the Gezi Park protests and (to a lesser extent) the failed coup of 2016,Footnote 12 but only at a highly aggregated level. Ultimately, it is impossible to know what caused the decline in Turkey’s electoral democracy score based on V-Dem alone. DEED can help to fill these gaps, illuminating events that more highly aggregated approaches may miss.
Brazil
Figure 3 plots the V-Dem, L&M, and OSM indices for Brazil. From 2005 to 2016, the V-Dem and L&M indices move roughly in parallel. Beginning in 2016, however, they trend in opposite directions: Brazil’s score on the V-Dem index decreases sharply whereas its score on the L&M index increases. By the end of the panel, according to V-Dem, the quality of Brazilian democracy had declined to its lowest level in 20 years (0.687). In contrast, according to L&M, Brazilian democracy had risen by 2020 to almost its highest level in two decades (0.915, only slightly lower from its previous high of 0.919 in 2019). Unlike in Turkey, in Brazil, the OSM index tracks closely with V-Dem and similarly suggests that Brazilian democracy had declined to its lowest level since 2000 by the end of the panel.

Figure 3 Measuring Democracy in Brazil
On the y-axis on the left-hand side, counts for all events in the precursor (gray bars), symptom (dark gray bars), and resistance (light gray bars) categories in DEED for Brazil from 2000 to 2020. On the y-axis on the right-hand side, trends in the L&M (dark gray triangles), OSM (white squares), and V-Dem (white circles) indices. All three indices are scaled to range from 0 to 1.
DEED can help to resolve these discrepancies between indices. DEED records an uptick in events beginning around 2016, just as the V-Dem and L&M indices begin to diverge. Many of these events are related to the impeachment trial of former President Dilma Rousseff, who was removed in April 2016 over charges of corruption and criminal administrative misconduct. After a lull in 2017, events again spike in 2018—this time related to the ultimately successful presidential campaign of far-right candidate Jair Bolsonaro.
Unlike in Turkey—where relatively “objective” events seem to explain the country’s plunging V-Dem score—the extent of democratic erosion under Bolsonaro is more subjective and remains a matter of debate today. Both as candidate and as president, Bolsonaro’s rhetoric signaled disdain for democratic norms and institutions. He expressed nostalgia for Brazil’s authoritarian past, repeatedly attacked the fairness of the country’s electronic voting system, joked about killing opposition-party members, routinely threatened retaliation against critical journalists and judges, and promised supporters that “only God” could remove him from office. In general, however, his rhetoric did not materialize into action, and the legislature and judiciary served as consistent and largely effective checks on his more anti-democratic impulses—at least until the onset of the COVID-19 pandemic in 2020.
Some scholars argue that rhetoric alone can threaten democracy (Mercieca Reference Mercieca2019). However, by most definitions, words that only occasionally inspire action probably would not justify a dramatic decline in a country’s democracy index score. Both the V-Dem and OSM indices appear to overestimate the importance of Bolsonaro’s rhetoric for the quality of Brazilian democracy. It is important to note that the fact that OSM tracks V-Dem rather than L&M in Brazil suggests that even purportedly “objective” indices are not immune to this problem. The L&M index appears to be less sensitive to changes in rhetoric alone, although the notion that Brazilian democracy actually improved under Bolsonaro—to say the least—is controversial.Footnote 13 Moreover, as in Turkey, Brazil’s scores on the V-Dem, L&M, and OSM indices mask the events that caused them to rise or fall. Furthermore, as in Turkey, DEED can inform debates about the extent to which potential threats to democracy are serious enough to warrant a drastic change in a country’s index score—objective or otherwise.
CONCLUSION
This article argues that event data can generate unique insights into the nature and dynamics of democratic erosion that cannot be deduced from more highly aggregated democracy indices—subjective, objective, or otherwise. We do not claim that DEED can be a substitute for these indices. To the contrary, we believe event data are perhaps most informative when used alongside V-Dem, L&M, and other aggregated approaches. In many cases, a proliferation of events coded as symptoms of democratic erosion in DEED is likely to correspond to periods of democratic backsliding in the V-Dem or L&M (or other) indices. In other perhaps less common cases, symptoms in DEED may not be accompanied by deterioration in other indices. This could happen for one of two reasons, both of which we think are worthy of study.
…event data can generate unique insights into the nature and dynamics of democratic erosion that cannot be deduced from more highly aggregated democracy indices—subjective, objective, or otherwise.
First, it is possible that once a regime attains a certain concentration of power, it must continue to engage in anti-democratic actions to sustain the new (less democratic) equilibrium. In these cases, DEED is likely to record many symptoms of democratic erosion whereas scores on the V-Dem and L&M indices are likely to remain low but stable. This could be what happened between 2016 and 2020 in Turkey—a period marked by stability in V-Dem and L&M but a continued proliferation of events in DEED.
Second, efforts to concentrate power may be met with sustained and effective resistance from bureaucrats, the media, and civil society. If attempts at executive aggrandizement ultimately are unsuccessful, they may not manifest in changes to a country’s subjective or (especially) objective index scores. In relatively consolidated democracies, for example, these dynamics could indicate off-the-equilibrium-path behavior followed by subsequent regression to the previous (more democratic) mean.
Documenting these dynamics is important regardless of whether they result in long-term democratic decline. Scholars may want to understand the conditions under which resistance to democratic erosion is likely to succeed or to fail; practitioners (e.g., international NGOs) may want to support resisters to increase the probability of success. Both scholars and practitioners similarly may want to understand cases where elites break democratic norms and use anti-democratic rhetoric; where checks and balances are subjected to constant stress; and where citizens become more polarized, more tolerant of political violence, and more fearful of government and one another. Whether and when these conditions are likely to produce long-term democratic erosion is an open empirical question that should be of concern to students of political science and that event data can help to answer.
ACKNOWLEDGMENTS
The authors thank Benjamin Aronson, Juliana Mothersbaugh, and the Democratic Erosion Consortium fellows for their excellent research assistance.
DATA AVAILABILITY STATEMENT
Research documentation and data that support the findings of this study are openly available at the PS: Political Science & Politics Harvard Dataverse at https://doi.org/10.7910/DVN/6I27DM.
Supplementary Material
To view supplementary material for this article, please visit http://doi.org/10.1017/S1049096523001026.
CONFLICTS OF INTEREST
The authors declare that there are no ethical issues or conflicts of interest in this research.


 Open access