


A confident application of methods is necessary to perform high-quality research both within and outside of academia. Whereas much of the statistical and methodological training that political science students experience is in high demand, we can provide better integration of methods courses in the curriculum (Adeney and Carey Reference Adeney and Carey2009; Williams et al. Reference Williams, Brown, Davis, Pavri and Shafiei2021) and also make statistics and programming classes more accessible for students (Asal et al. Reference Asal, Jahanbani, Lee and Ren2018; Forte Reference Forte1995). This article describes an approach to stimulate engaging and problem-based learning environments using an inverted classroom setting applicable for both in-class and virtual seminar settings. Although the article uses a working example from political science and the programming language R, the setup also can be transferred to other disciplines and other programming languages.
Different statistical languages typically are taught at both undergraduate and graduate levels in programming and statistics courses in political science. They often include SPSS, Stata, R, and Python. Because R and Python are the only fully open-source languages among these four languages that also are highly versatile, I am convinced that they have substantial advantages over SPSS and Stata. In addition to the versatility in using R and Python for various tasks beyond statistical analysis (Ozgur et al. Reference Ozgur, Colliau, Rogers, Hughes and Myer-Tyson2017), they are among the top languages requested in nonacademic professions (daSilva Reference daSilva2019).
Because learning a programming language requires constant practice, I approached this challenge from two different angles: (1) interactive project-based group work with integrated peer support, and (2) elements of an inverted classroom. The inverted classroom allowed me to provide input but left enough space for students to (re)apply learned skills and to practice them with online learning platforms. This was further supported by interactive group work that required students to work continuously on their research projects. Using a combination of RStudio Cloud, GitHub, and R Markdown, I was able to introduce students to a coherent workflow that generates reproducible research. Teaching transferrable skills as part of the curriculum is essential because it better prepares students for the future job market. The proposed course setting offers various transferable skills, ranging from specific programming skills to critical and analytical thinking, to teamwork and presentation experiences.
This article proposes an easily applicable step-by-step guide for turning a statistics course into an interactive seminar setting that allows students to experience access to real data and to practice their skills early in the program.
COURSE SETUP: USING PROJECT-BASED LEARNING AND AN INVERTED CLASSROOM SETTING
I taught the seminar in both in-class and virtual settings with undergraduate political science students. To facilitate communication, I relied on an interactive communication platform (e.g., Slack) that increases peer support and cohesion. Although the class sizes were relatively small (i.e., fewer than 20 students), the group-work component that integrates peer support also should accommodate larger class sizes.
To create an inclusive learning environment that equips and empowers students with methodological skills, I did not request any prerequisites. Therefore, the courses were heterogeneous, including students who had prior statistical knowledge through their undergraduate courses and those who were not previously exposed to statistical programming languages or statistics.
I am convinced that interactive learning generates the greatest learning success—and even more so in a methods course. Therefore, I used an inverted classroom setting with a project-based learning approach. Proponents of both approaches often highlight that they encourage student participation (Krajcik and Blumenfeld Reference Krajcik, Blumenfeld and Keith Sawyer2006; Låg and Sæle Reference Låg and Sæle2019). Project-based learning is a teaching and learning approach that successfully contributes to students’ learning progress. According to Krajcik and Blumenfeld (Reference Krajcik, Blumenfeld and Keith Sawyer2006, 317), “[p]roject-based learning allows students to learn by doing and applying ideas. Students engage in real-world activities.” Using this approach, students practice their statistical knowledge from the first class session and apply it early to their projects. It also combines recommendations by Bailey (Reference Bailey2019) to apply the knowledge to something meaningful and by Knoll (Reference Knoll2016) to learn by using project-based learning approaches. I divided students into small research groups that collaborated throughout the course and used synergetic effects to learn from and with one another. The project-oriented work setting of the seminar mimics both academic and nonacademic workflows, thereby preparing students for future jobs in different disciplines.
The project-oriented work setting of the seminar mimics both academic and nonacademic workflows, thereby preparing students for future jobs in different disciplines.
An inverted classroom, also called a flipped classroom, describes a setting in which “activities traditionally done by students outside class (e.g., practicing problem-solving) are moved into the classroom session, whereas what is traditionally done in class (e.g., expository, information transmission teaching) is done outside and prior to class” (Låg and Sæle Reference Låg and Sæle2019, 1). As Låg and Sæle (Reference Låg and Sæle2019, 2) summarized, an inverted classroom can allow students to learn at their own pace in a more personalized teaching and learning environment. It also encourages students to learn independently and to become more responsible for their learning success. I am convinced that an inverted classroom is favorable for methods courses because learning a new programming language is a highly independent endeavor that often requires much self-effort to find a workable solution (Chen et al. Reference Chen, Hsiao, Kang, Wu and Chen2020; Shaw Reference Shaw2012).
Define Project Groups at the Beginning
Grouping students into project groups at the beginning of the course is essential. Depending on the class size, ideal working groups usually consist of two to three students. Grouping can be performed, for example, based on their interests and mixed levels of previous skills.Footnote 1 For the example seminar, I asked students to submit a research question at the beginning of the semester. Students then were grouped based on an overarching thematical overlap. The key task during the group work was to merge different datasets, wrangle the data, and generate first plots to visualize the initial findings. Thus, the common denominator for grouping students was driven primarily by an overlap in potential datasets. Because the example seminar was an undergraduate class that introduces students to R and statistics, additional guidance was required. Another option is grouping students randomly; instructors then may distribute problem descriptions that students must solve during the semester.Footnote 2
Mimic a Typical Workflow
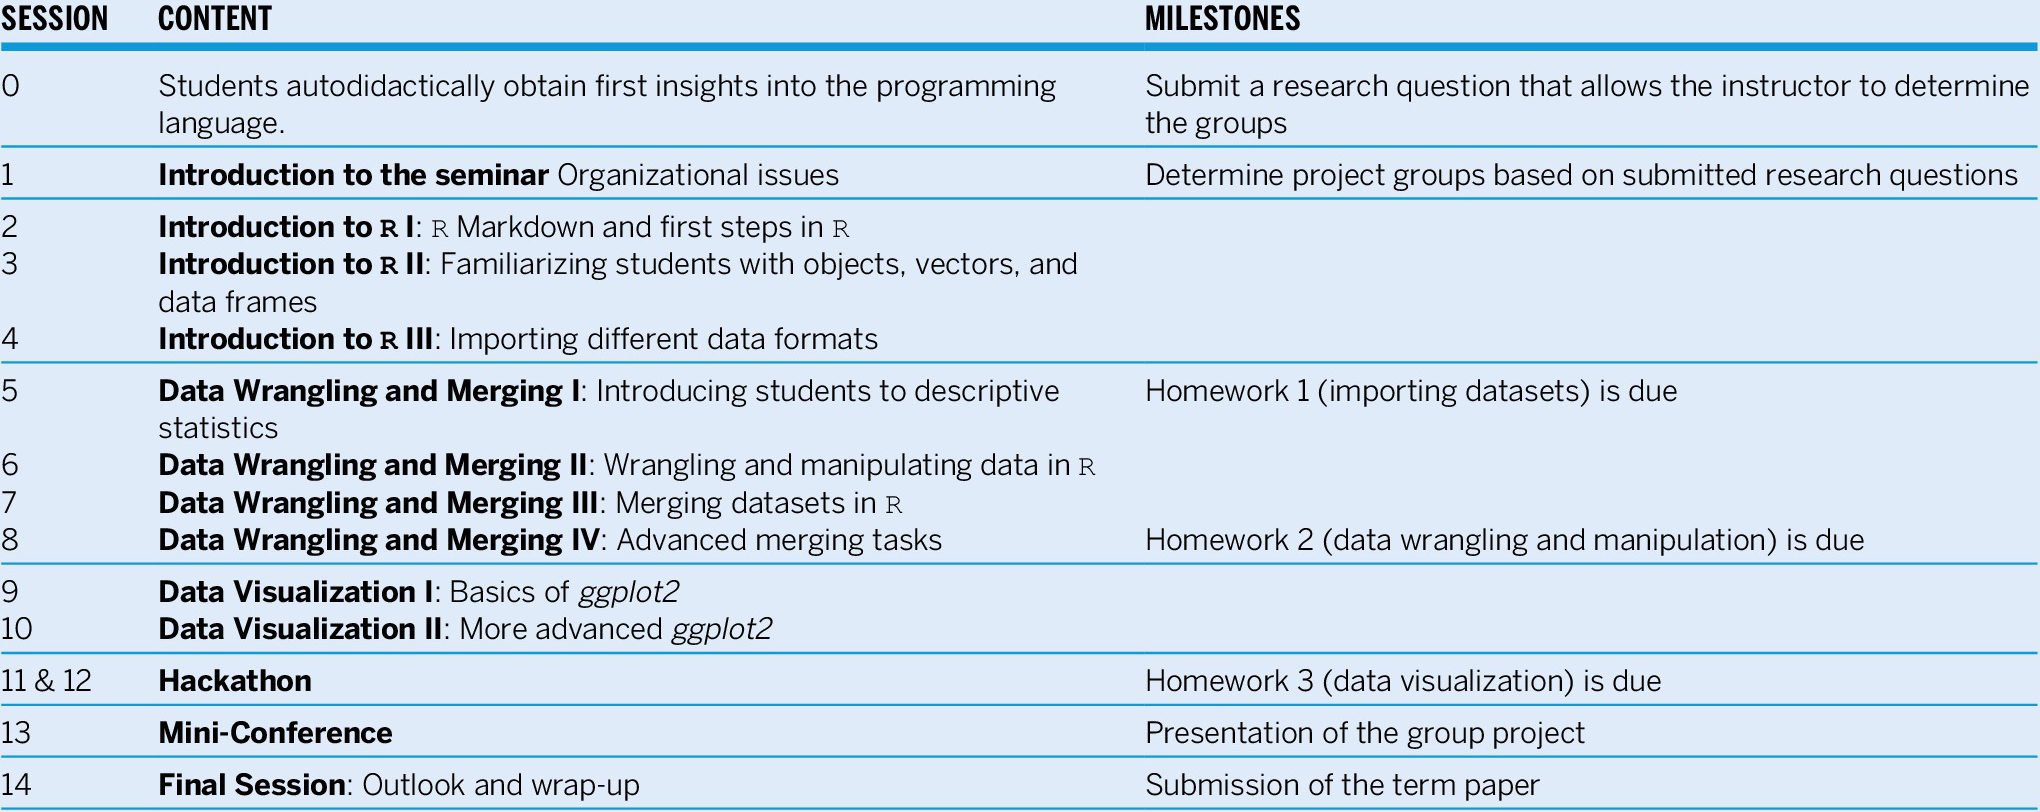
To demonstrate a typical academic workflow, I followed single steps to replicate the figures of one important article in the field of conflict studies,Footnote 3 dividing the seminar into five thematic blocks: (1) introduction, (2) data wrangling and merging, (3) data visualization, (4) a hackathon, and (5) a mini-conference. Table 1 illustrates an exemplary schedule for the course, which may be adjusted to different topics. The course also has been taught as a block seminar using a similar plan.
Table 1 Schedule for the Course (Example)
To reduce the heterogeneity in knowledge as best as possible, I first assigned a short introductory course in R, which students were required to complete before the first class session. Every student thus had at least some previous experience using R. Experiencing R for the first time at their own pace allowed students to take the time they needed without feeling limited or peer pressure in the classroom.
The scientific study for replication can be exchanged easily because the process to replicate the study likely follows similar steps. To provide a coherent in-class working example that allows students to follow easily, I replicated a scientific paper. Because students were required to submit a short research paper with a visualization of their results, I used the in-class examples to demonstrate how this can be done. The in-class sessions were divided between input from my side (i.e., show and tell) and group work to (re)apply previously learned skills (i.e., hands-on). During the show-and-tell section, I used the working example to demonstrate the different steps in a data science workflow (e.g., accessing the data, wrangling the data, and presenting the data). To enable students to follow the single steps, I also implemented short practical sections to directly apply the new skills. For instance, when I explained how to generate a new variable, I first demonstrated using the working example. I then included a short practical session, in which students were asked to apply the same approach to generate other new variables required for processing the working example. During the hands-on sections, which were always part of the seminar sessions, students worked in their group with their own datasets on the steps discussed during the show-and-tell section.Footnote 4 This way, the instructor can continuously supervise the process and provide guidance when necessary. Based on my experience, it also generates a collaborative atmosphere among the students and the instructor.
Open Access and Reproducibility
Open access and reproducibility are essential pillars of research. In light of the reproducibility crisis (Baker Reference Baker2016), training students to perform reproducible research early in their career is essential. To familiarize students with these concepts and teach them a logical workflow that enables them to achieve their goals, I shared all teaching material on GitHub, a cloud-based version control, and RStudio Cloud, a cloud-based version of RStudio Desktop. RStudio Cloud mimics RStudio Desktop on a local machine without installation or operational system-dependent details.Footnote 5 For teaching purposes, this setup is convenient because students can start using the program directly, and they still experience how the program would work on their local machine. Based on my experience, those who needed to transition to the local RStudio Desktop version to work with larger datasets had no difficulty and experienced only a short transition cycle. My teaching material is based on R Markdown files, an efficient and easy-to-use typesetting that is common even outside of academia. Because it provides separate code and text blocks, users can generate reproducible reports in one file (RStudio 2021b).Footnote 6 Although it has an initial steep learning curve, it pays off quickly because it is easily accessible and does not require much in-line coding. Furthermore, it can be compiled as a PDF, HTML, or even Word file and directly communicate research results. For the seminar, I designed an R Markdown template containing a standard structure and a template for the term paper. The templates were reapplied to the students’ research projects.Footnote 7
Assignments
Practical skills such as programming are best learned when they are constantly practiced. Based on my personal experience, to confidently write their own code, learners need sufficient time for practice and exercise, which exceeds executing prewritten lines of code. Therefore, I implemented an inverted classroom setting for this seminar to provide input and assistance during in-class sessions. Students also were asked to practice their skills outside of the classroom. I enabled this by (1) using external learning sources, (2) assigning continuous homework submissions, and (3) requiring progress during the group work. Using this combination maintained the constant practice and allowed students to apply their newly gained skills to their own real-world projects.
Based on my personal experience, to confidently write their own code, learners need sufficient time for practice and exercise, which exceeds executing prewritten lines of code.
External learning forums are excellent tools that often offer free and openly accessible teaching material that allows students to practice and revisit their previously learned skills outside of the classroom.Footnote 8 I preselected relevant courses and exercises that I assigned as homework. This allowed students to (re)apply and consolidate their knowledge interactively to new datasets. I also preselected optional advanced courses and listed them in the syllabus to further assist students. This allowed me to accommodate different learning levels. Based on the feedback that I received, course participants were pleased to take advantage of this offer.
Hackathon
To further support the students’ progress, I mimicked the productive atmosphere generated during a hackathon and dedicated a double session to individual course projects at the end of the seminar. This hackathon mirrored a classical hackathon setting, a competitive event that allows participants to dedicate a predefined period to a project with the goal of working collaboratively toward its finalization—well known in tech challenges. Because students were required to present their projects and visualizations in a subsequent session, they used the hackathon to polish their work. Hackathons are used widely in learning environments to foster independent learning through applications (Cwikel and Simhi Reference Cwikel and Simhi2021; Kienzler and Fontanesi Reference Kienzler and Fontanesi2017). The teams consisted of students’ previous peer groups with whom they already were working. During the dedicated time, students also had the opportunity to consult with me individually for guidance on finalizing and polishing their visualizations.
Presenting Results as Part of the Mini-Conference
Good presentation skills are key to delivering a convincing message. This is true for both academic and other contexts. To provide students time to practice these skills, I introduced a mini-conference setting in this course. The session is similar to a traditional academic workshop or a conference, with students serving as presenters and discussants. In this setting, they learned to provide and receive substantial feedback on their work while also improving their presentation skills. For this seminar, students presented the final visualizations with their group. During their presentation, students had to briefly present the relevance of their topic, their individual research questions, and the theoretical reasoning driving their work. Although the focus of the presentation should be the final visualization, the contextual framework was essential to provide substantive feedback. Throughout the presentations, I served as the chair and moderated the feedback rounds. I particularly emphasized their learning to provide and receive feedback from their peers. Using peer feedback as a component in teaching is beneficial because it empowers students to think about and reflect on both their work and others’ work (Sackstein Reference Sackstein2017). By constantly revising their work in guided steps throughout the course and especially as part of the mini-conference, the students also experienced a typical research and working cycle.
Final Paper
As part of their final paper, students were asked to present their descriptive visualizations framed in a research note (approximately 2,000 words), including (1) a research question, (2) a short literature review and theoretical assumption, (3) a detailed discussion of their research design, and (4) their interpretation. This approach allows them to practice academic working and writing while keeping the focus of the seminar on the methodological part. To support students with their academic work, I provided individual feedback on their research questions and discussed theoretical mechanisms, data resources, and potential ways to conduct an exploratory analysis. The goal of this course was to allow students to work confidently with R to generate descriptive statistics. If an instructor prefers more statistics-focused training, this may be integrated into the course setting.
Students’ projects were diverse, ranging from analyzing the effects of natural resources or religious diversity on conflict onset to the effects of COVID-19 restrictions on levels of violence. Students often relied on traditional data using the Uppsala Conflict Data Program’s data (UCDP) (Pettersson Reference Pettersson2020), the World Bank (Reference Data2015), and the Armed Conflict Location & Event Data project (Raleigh et al. Reference Raleigh, Linke, Hegre and Karlsen2010), but they also hand-coded their own data. To visualize their findings, students used—for instance—circular plots for relational data, bar plots for share comparisons, and even ShinyApps, interactive web applications in R, to demonstrate the effects of different democracy measures.
CONCLUSION
Engaging students early with a hands-on course on methods and programming can be a challenging endeavor. Based on my experience, combining a project-based approach with group work allows students to apply their knowledge directly to relevant problems and encourages them to follow a continuous learning process. Acquiring strong and competitive programming and statistics skills is relevant for both academic and nonacademic jobs. Increasingly attractive data-related professions such as data science, data engineering, and data analytics require transferable skills and goal-oriented working behavior. This specific setting demonstrates to students that data usually do not come in the convenient format they often are presented throughout teaching examples, but rather that it often requires much creative thinking to make the data accessible and usable. In addition to demonstrating how it should work, this course equips students with an essential skill: formulating search requests that enable them to find answers to questions themselves. Based on anecdotal evidence, formulating searchable questions has been one of the most challenging components of the course. However, once students have mastered this skill, it allows them to expand their knowledge independently. I also observed this development throughout the course when students used, for instance, YouTube resources to learn how to generate interactive maps in R. The suggested classroom setting equips students with their data science project, which they can use later to demonstrate their skills.
In addition to demonstrating how it should work, this course equips students with an essential skill: formulating search requests that enable them to find answers to questions themselves.
The proposed classroom setting can be applied to various methods courses. Whereas the course described in this article used an introductory methods course, the outline also can be applied to more advanced courses and different statistics and methods subtopics. For example, if a course is designed to replicate one specific scientific process (e.g., producing descriptive findings or running a regression analysis with robustness tests), the single steps can be mimicked. However, for courses in which students are introduced to various methods and analytical approaches, the core part of this course setting—the hands-on and project-based approach—can be applied and transferred. Instead of having one overall example, instructors can use multiple small examples or toy examples to introduce students to the methods. However, in this instance, the general setting of project-based group work and an inverted classroom can remain the same.
ACKNOWLEDGMENTS
I thank Sabine Carey (University of Mannheim) for the opportunity to teach seminars at her Chair and also Dennis Hammerschmidt (University of Mannheim), Anna-Lena Hönig (University of Mannheim), Melanie Klinger (University of Mannheim, Department of Educational Development and eLearning), and two anonymous reviewers and the copyeditor for their helpful feedback on earlier versions of an interactive course setup and this article. I also thank the two excellent seminar groups who participated in “Complexities in Analyzing Conflicts: Data Wrangling and Data Management in R” and “Computational Conflict Research: Using R to Analyze Patterns in Conflicts” at the University of Mannheim for being curious enough to try a new setting and to explore the world of R. This work was supported by the University of Mannheim Graduate School of Economic and Social Sciences, funded by the German Research Foundation.
DATA AVAILABILITY STATEMENT
Additional material related to this article—templates for a syllabus (in LaTeX), a data processing file (R Markdown), and a term paper (R Markdown and LaTeX)—are openly available on the PS: Political Science & Politics Harvard Dataverse at https://doi.org/10.7910/DVN/JQLNCT.


 Open access