


Computer-based assessment offers many obvious advantages over handwritten assessment. Independent of the method of administration, typed answers are much easier for instructors to read; thus, grading and evaluation can be done more efficiently. In addition, typing allows students to produce more in response to questions and eases the editing process, making answers potentially more complete and accurate. Computerizing assessment allows instructors to administer quizzes and tests that are flexible, easy to customize, and quick and efficient to grade.
Although computer-based assessments offer clear advantages, instructors might be concerned about their effect on student performance. The literature on the equivalence of computer- and paper-based assessments has yielded mixed results. Some studies find that computer test-taking enhances student performance, others find that paper is better, whereas still others find equivalence between the two test modes (Noyes and Garland Reference Noyes and Garland2008). The contradictory findings are due in part to the variety of assessments used (e.g., multiple-choice questions and essays), the different thresholds for equivalence, and the different research designs employed (Albers, Boevé, and Meijer Reference Albers, Boevé and Meijer2015). This implies that the topic is a “moving target,” warranting further study.
The goals of this article are twofold. First, we evaluate whether student performance differs between handwritten and computer-based exams through a randomized field experiment conducted in our research methods course. Second, after finding a significant difference, we then investigate potential causes of that difference. Overall, our findings suggest nearly a full-letter-grade increase in student performance on computer-based exams that is driven primarily by the relative ease of producing thorough responses on the computer versus by hand.
Our study contributes to the existing literature on test-taking by using a particularly suitable but relatively underutilized experimental design in a naturalistic setting. Moreover, our investigation goes beyond simply evaluating the equivalence of test modes by providing an explanation for why performance might be higher in computer-based exams. Finally, by using student-generated data to answer a question of direct interest to students and faculty alike, we provide another tool for engaging students with research methods in political science (Adriaensen, Kerremans, and Slootmaeckers Reference Adriaensen, Kerremans and Slootmaeckers2015; Rosen Reference Rosen2018).
Moreover, our investigation goes beyond simply evaluating the equivalence of test modes by providing an explanation for why performance might be higher in computer-based exams.
CONTEXT
We conducted our IRB-approved experimental design in two sections of a required introductory course in methods and statistics in political science in the fall of 2017 at a small liberal arts institution. The sections, capped at 30 and yielding a total enrollment of 59 students, met three times per week, one after the other in the same classroom.Footnote 1 Each instructor taught a single section of 29 or 30 students. The course introduced students to the fundamentals of social science research, including statistical analysis and computer programming. The two instructors used the same syllabus for both sections and coordinated each class meeting to cover the same material.
EXPERIMENTAL DESIGN
We used two equally weighted, 50-minute, in-class exams to evaluate whether the test-taking mode affects student performance.Footnote 2 Each exam tested students on the quantitative part of the course and required them to produce several short-answer/essay responses. Although the nature of the course material is cumulative, the two exams were designed to test for different material. The exam questions and instructions were identical across sections and they were administered in the computer lab where the class met during the semester. The first two rows of the classroom were reserved for students who took their exams on paper; the last two rows were reserved for those who took them on a lab computer. Thus, we essentially ran two parallel experiments, one in each section, using two separate exams and two treatments: (1) the computer-based version of each exam administered via learning-management software (i.e., Moodle); and (2) the paper-based version of each exam taken with pen and paper.
In each section, students were randomly assigned to one of the two sequences of test-taking—paper first or computer first—and then switched to the other test-taking mode in the second exam. They were informed about their test-taking sequence before they took the exams. For example, if a student was randomly assigned to take the first exam using a computer, she took the second exam using paper and vice versa. More technically, we used a counterbalanced within-subjects design, also known as a 2x2 crossover design, with two periods (exams 1 and 2) and two treatments (computer and paper) (figure 1).
Figure 1 Schematic Representations of the Within-Subject Experimental Design
This experimental design is particularly suitable for our research question (Albers, Boevé, and Meijer Reference Albers, Boevé and Meijer2015). First, it treats each subject as one’s own control, which effectively removes all of the differences between subjects in calculating average treatment effects (Jones and Kenward Reference Jones and Kenward2014). Thus, the treatment effects are within-subject and account for all of the between-student differences that could have arisen due to individual factors and instructor differences.
Second, our counterbalanced design was uniform within periods and sequences, which means that each treatment appeared an equal number of times within each period and each sequence. This allowed us to remove period and sequence effects that could be confounding factors. For example, it could be that students become more comfortable with the material over the course of the semester and perform better in later than in earlier exams. Or it could be the case that the test-taking sequence—computer or paper first—affects performance. By randomly assigning students to each test-taking mode and then switching them to the other mode, we accounted for both of these effects.
Third, crossover experiments require fewer subjects, which makes them statistically more efficient at estimating treatment effects. In fact, a far smaller sample size is required—often less than half of that of a traditional parallel design—to achieve the same statistical power (Li et al. Reference Li, Yu, Hawkins and Dickersin2015). Given the relatively small number of students in our classes, this is a crucial advantage.Footnote 3
Despite these advantages of our experimental design, we were acutely aware of the potential for bias to enter our analysis through differences in grading, both within and between instructors. To avoid within-instructor grading bias that could stem from preference for one test mode versus another, we employed three research assistants who transcribed the handwritten answers and entered them in a spreadsheet. We then added the answers from the computer exams to the same spreadsheet and anonymously graded answers in our own sections. To avoid between-instructor bias, we used two strategies. First, the crossover design effectively removes differences in performance between students that could arise due to the teaching or grading style of the instructor because treatment effects are estimated for individual students across treatments. Second, we discussed our grading criteria in-depth and agreed on suitable answers for each question.Footnote 4 The formal way to test for instructor effects is to introduce an indicator variable for sections in the analysis of variance and determine whether there is an interaction between sections and the direct treatment effect (Jones and Kenward Reference Jones and Kenward2014, 62–63). Our analysis shows that there is no evidence for such an interaction, further warranting the combination of data from both sections into one analysis.
Another disadvantage of crossover designs is the potential for the treatment at time t to affect the outcome at time t+1. In other words, if a subject receives treatment A in the first period and treatment B in the second period, the outcome measured at the second period could be due in part to the lingering effect of treatment A. This carryover effect is of particular concern in pharmaceutical trials, in which the administration of a certain drug in the first period could affect the outcome of interest in a subsequent period. To reduce such carryover effects, crossover designs often include washout periods.Footnote 5 A carryover effect, however, was unlikely to occur in our application because there was no reason to expect that using one test-taking method in the first exam should have any lingering effect on student performance later (Senn Reference Senn2002). However, given our main findings, we could argue that the students who took the first exam on a computer may have felt more confident in their abilities going forward and therefore performed better on the second exam conducted on paper. That clearly did not happen, further reducing our concerns about carryover effects.
Finally, our experiment meets all of the criteria for field experiments. Field experiments are conducted in naturalistic settings, which gives them higher external validity than laboratory experiments.Footnote 6 In our case, the treatments resembled real test-taking modes, the participants were students who generally take tests, the relevant context was the classroom, and the outcome measures were actual test scores (Gerber and Green Reference Gerber and Green2012, 10–11). The high-stake nature of the exams and the setting in which they were taken thus closely mirror the test-taking experience of an average student. In addition, our within-subject crossover design greatly reduced concerns about confounders and internal validity, which often plague field experiments.
In short, there is fairly strong evidence that taking an exam on a computer as opposed to on paper not only does not hinder student performance but also actually enhances it.
RESULTS
To properly estimate the treatment effect in crossover designs, we must account for the fact that observations are paired. In other words, because student A’s performance in period 1 is obviously related to her performance in period 2, we needed a statistical test that accounts for the repeated-measure nature of the data. To do this, we used analysis of variance (ANOVA) for a 2x2 crossover study.
Table 1 reports summary statistics of the within-student difference with respect to exam scores across sequences of test-taking, as well as the total treatment effect from ANOVA controlling for period effects. The second exam proved more difficult than the first, with average scores about 12 points lower, which provided evidence of a significant period effect. However, average scores fell far less for students who took their second exam on a computer than for those who took it on paper. Figure 2 plots student scores for each period by sequence of treatment and confirms this impression. The solid lines indicate individual students in the sequence who managed to improve their score between exams. Whereas students tended to perform better in the first exam than in the second, it is clear that more students improved their score when they took the second exam on a computer rather than on paper. Moreover, there was a steeper decrease in performance for students who took the second exam on paper than on a computer, further implying a treatment effect.
Table 1 Results for the Two-Treatment, Two-Period Crossover Design
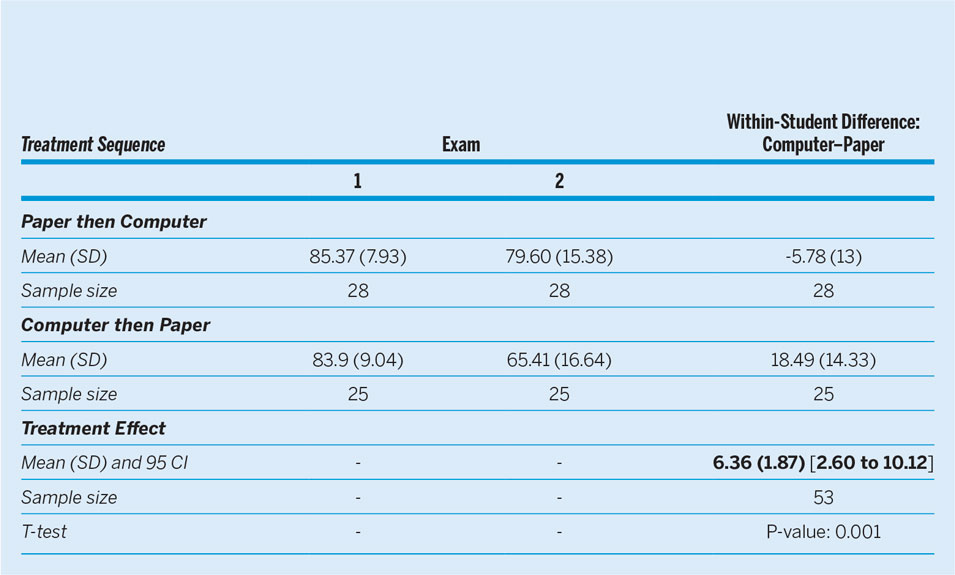

Figure 2 Profile Plots for Student Scores for Each Period by Sequence of Treatment
The within-subject treatment effect and the corresponding 95% confidence interval for taking the exams on a computer versus paper are shown at the bottom of table 1. Accounting for the period effect, students scored about 6 points higher when they took their exam on a computer than on paper. This effect is statistically significant at the 0.001 level, which means that computer test-taking led to nearly a full-letter-grade increase in student performance—a substantive effect. In short, there is fairly strong evidence that taking an exam on a computer as opposed to on paper not only does not hinder student performance but also actually enhances it.
FURTHER DISCUSSION AND ANALYSIS
Why is there a positive treatment effect for computer-based tests? These results were surprising to us, so we decided to probe them further by asking our students to fill out a quick online survey on notetaking preferences at the end of the course (see online appendix A2). The idea was to see whether a preference for notetaking on a computer helps with the retrieval of information, and thus performance, during exams also taken on a computer. Of the students who filled out the survey, almost 80% (43) preferred paper and only about 20% (12) preferred computers for notetaking. The ANOVA analysis with interaction effects between treatment and notetaking preference for computers showed no statistically significant results. In other words, the boost in performance from computer test-taking does not depend on a preference for notetaking on a computer.
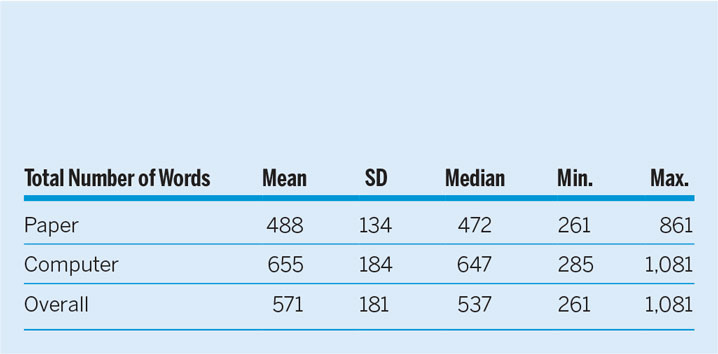
Another alternative explanation is that taking tests on a computer allows a student to provide more comprehensive and higher-quality answers due to the higher speed of typing and ease of editing (Goldberg, Russell, and Cook Reference Goldberg, Russell and Cook2003). Indeed, students taking the exams on paper wrote an average of 488 words whereas those taking them on a computer wrote 655 words (table 2).
Table 2 Descriptive Statistics for the Total Number of Words by Treatment
To what extent is the observed treatment effect due to the fact that students can write better and more comprehensive answers using a computer? To explore this possibility, figure 3 plots students’ scores over the range of the number of words they wrote. The figure shows a generally positive relationship between the total number of words written per exam and the total score. However, this relationship does not seem to be linear; indeed, a quadratic line seems to fit the data better.

Figure 3 Scatterplot with a Quadratic Fitted Line for Student Scores against the Total Number of Words Written
We were not surprised by this result, given that writing longer answers can be a double-edged sword. Although more-comprehensive answers give students a chance to display the depth of their knowledge, they also can make gaps in understanding more transparent.
To further investigate, we conducted additional ANOVA analyses by including the total number of words and its square as covariates in the base ANOVA model. The regression coefficient for the total-number-of-words variable is positive and statistically significant at the 0.05 level, whereas its square is negative and statistically significant as well, confirming the inverted U-shape of the quadratic fitted line in figure 3. Most interesting, controlling for the effect of the total number of words renders the positive treatment effect for computers statistically insignificant. This suggests that test-taking on a computer increases student performance mostly by allowing students to write longer and more comprehensive answers. However, it is likely that the typed answers also were better edited and more polished because they lend themselves more easily to proofreading and correcting spelling and grammar errors than handwritten exams. Although we cannot empirically test for this effect with our data, their presence would further support the use of computer-based assessment.
This suggests that test-taking on a computer increases student performance mostly by allowing students to write longer and more-comprehensive answers.
CONCLUSION
Our main motivation for this study was to investigate whether student performance differs between handwritten and computer-based exams. This is a practical concern that we and other colleagues share about the role of technology in the classroom in general and the effect of computer test-taking on performance in particular.
Our findings suggest that students tended to perform better when they took their exams on a computer rather than on paper. This effect was due to the more comprehensive answers that they provided when given the opportunity to type rather than write. Computer-based assessment also offers benefits to instructors. It allows for quicker grading because (1) it is easier to read typed answers than handwritten answers, and (2) it takes less mental effort to grade by question than by exam, which learning-management software like Moodle often makes easy to do. We estimate that it takes half the time to grade the same answers on a computer than on paper. Moreover, in-class computer-based exams can be administered easily in any classroom as long as students have access to a laptop and can bring it to class. Coupled with the elimination of the halo effect that accompanies grading student exams anonymously by question (Kahneman Reference Kahneman2013, 83–84), we believe that computer-based tests offer clear advantages to both students and instructors.
Our study undoubtedly has potential limitations. The first is the relatively small number of students involved in the study. Although the crossover design alleviated this, a larger sample size would provide enough statistical power to detect even smaller effects. Second, the exams were administered as part of a required methods course; therefore, future research could investigate whether the results hold for other types of courses in different subjects and disciplines and using other course-management platforms. Third, the exams were timed and relied on short-answer/essay questions; therefore, it remains to be seen whether our findings apply to other types of questions and time limits.
A secondary motivation for conducting our study was that we wanted to design a built-in field experiment in a methods course that made the various steps of research design and analysis more tangible to students. Our hope was that working with data that they helped generate would increase student interest in and engagement with material that often is outside of “students’ sphere of interest” (Adriaensen, Kerremans, and Slootmaeckers Reference Adriaensen, Kerremans and Slootmaeckers2015, 4) and causes unusually high student anxiety (Bernstein and Allen Reference Bernstein and Allen2013).
Various approaches have been proposed to pique student interest, including flipping classrooms (Touchton Reference Touchton2015), assigning relevant practical examples from existing research, and even using examples from popular culture (Burkley and Burkley Reference Burkley and Burkley2009). We provide an additional solution to this problem by using student-generated data to address a substantive issue of direct interest to students (Rosen Reference Rosen2018). In our example, the subject of academic performance and the setting of a required methods course provided an ideal opportunity to engage students with a research question that was of immediate relevance to them. The experiment was a built-in example that we were able to thread throughout all aspects of the semester-long course: from developing research questions to operationalizing concepts to designing experiments to analyzing and reporting data (see the online appendix).
In summary, evaluating whether test-taking modes affect student performance is highly valuable in an age when technology is changing the way students and instructors interact in almost every aspect of higher education. Systematically conducting this evaluation within the confines of a research methods course provides an excellent pedagogical tool to engage students with the material and to bring it closer to their “sphere of interest.”
The question we chose to investigate and the method we used represent only one possibility. Other researchers could implement the same principle—that is, enhancing student engagement with research methods through the collection and analysis of student-generated data—by using different questions of interests and other methods commonly used in political science.
SUPPLEMENTARY MATERIAL
To view supplementary material for this article, please visit https://doi.org/10.1017/S104909651900091X.
ACKNOWLEDGMENTS
We thank Shelley Rigger and Silvana Toska for the initial fruitful discussion from which the idea for this article originated, and Jess Good and Laura Sockol for helpful suggestions on research design. We also thank members of the Experimental Methods Group at the European University Institute in Florence, Italy, and especially Klarita Gërxhani, Eva Zschirnt, and Marc Helbling for their helpful suggestions. We are grateful to Bilyana Petrova and Melody Crowder-Meyer for their incisive comments on an earlier draft. Finally, we thank Victoria Frost, Daphne Asteriadis, and Cole Riggan for their research assistance; the students who participated in the experiment; and three anonymous reviewers for their helpful feedback.


