Most political science departments are concerned with their enrollments (Sedowski Reference Sedowski2007). In addition to lost prestige, smaller enrollments can have painful financial consequences as the relative number of students frequently determines the internal allocation of university resources across departments. What attracts students to enroll in political science courses?
Previous work examined the effect of specific teaching methods on the likelihood of enrollment (Baumgartner and Morris Reference Baumgartner and Morris2015). In contrast, I analyzed students’ substantive motivations by conducting an experiment at a mid-sized public university in the United States. Specifically, I tested the relative importance of three possible motivations. First, students might enroll in political science courses to develop specific skills, such as policy analysis or cost-benefit calculations. Second, students might take political science courses to better understand current events, such as presidential campaigns. Third, students might enroll because they hope to learn about long-standing, fundamental issues in politics to better understand their place in the world.
I found that students do not respond to the promise of developing new skills. Instead, framing the course in terms of long-standing political topics had a positive and statistically significant effect on students’ likelihood of enrollment. Emphasizing the possibility of learning about current events also increased the probability of enrollment, although this effect was smaller and not consistently present across models. The findings have implications for departmental recruitment efforts.
I found that students do not respond to the promise of developing new skills. Instead, framing the course in terms of long-standing political topics had a positive and statistically significant effect on students’ likelihood of enrollment.
SET UP AND PROCESS OF THE EXPERIMENT
The experiment examined how framing a single course differently might affect the likelihood of individual students enrolling in it. I visited seven sections of an Introduction to American Government course at the University of Texas at Dallas. These sections provided an ideal setting, for several reasons. First, the course was required for every student who intends to graduate from this university, irrespective of the degree pursued. Therefore, students’ motivation to enroll in this course was comparatively constant. Second, the composition of students included a broad range of majors and years: the sample included students majoring in social sciences (27.4%), business and management (21.5%), natural sciences (19.6%), and engineering (31.5%). Furthermore, it featured freshmen (38.3%), sophomores (31.0%), juniors (19.8%), and seniors (10.9%). Third, the composition of the individual sections did not deviate significantly from these overall patterns, resulting in comparable student bodies across sections.Footnote 1 Fourth, each section met in the same classroom, thereby controlling for differences in the physical environment.
The course advertised was an upper-level elective course to be taught the following semester. This course was not a requirement for any degree, not even political science majors. Furthermore, it did not have any prerequisites, so that the course was potentially open to all majors across the university. The experiment was conducted one week before the beginning of the enrollment period, allowing all interested students the same chance to register. The size of the classroom assigned to this course was sufficiently large so that no student was unable to register due to an enrollment cap. The course content focused on comparing the institutions, politics, and policies of three industrialized economies: The United States, Sweden, and Germany.
I made certain that the process of providing information to students was as identical as possible across sections. I visited each section on two consecutive days with identical weather conditions to avoid differences in attendance rates. None of the sections expected external speakers, and none had an exam scheduled within the following three weeks. I even wore the same clothes to each class.
For each section, I arrived before the start of class and set up a short PowerPoint presentation with an identical title slide displayed as students entered the room. In each section, I started speaking precisely one minute after the official start of class, speaking for about three minutes and showing a total of four slides. I memorized scripted remarks to ensure that the wording was as similar as possible in each section. After delivering the information, the regular instructors were advised to not make any remarks about my pitch, my qualities as a teacher, or the course advertised to prevent biasing their students’ perceptions.
The instructors, however, took attendance so that I could verify which students received treatments. Students were not exposed to a treatment if they happened to not attend class on the day that I visited. Of the 1,467 students enrolled in these sections, 627 attended and 840 did not. Importantly, students did not know that I was visiting their class that day. Thus, absences should not be a conscious choice by students to not participate in the experiment. More generally, poor attendance is not unusual in these types of courses (Gray and Bunte Reference Gray and Bunte2018). Introduction to American Government is mandatory for every student, irrespective of their interest in the topic and their major. Furthermore, classes are large (i.e., an average of 214 students per section), limiting the possibility of personal interactions with every student, which might have motivated students to attend more regularly.
Lastly, the large class size combined with short but frequent classes (i.e., 50 minutes, three times a week) made taking attendance a challenge. In summary, these factors contribute to poor attendance. It is possible that the patterns of absences were not random and thus introduced bias. For example, students who are interested in politics might be more likely to attend class and more likely to enroll in subsequent political science courses. Section 3 of the online appendix examines this possibility in detail. The data suggest that student absences in this mandatory course were not related to their interest in politics.
DEFINING TREATMENTS
Each treatment consisted of four PowerPoint slides and a three-minute monologue at the beginning of class. Of these four slides, the first two and the fourth were identical across treatments. The two opening slides, shown in figure 1, were designed to grab students’ attention. For this reason, slides 1 and 2 provide concrete examples contrasting how things “work” in Germany and in Sweden versus the United States. Similarly, the fourth slide was identical across treatments; as shown in figure 2, it merely states the name of the course, course number, day and time, and instructor’s name. In short, both the front and the back ends of the information provided to students were identical across all sections. The third slide, however, differed across treatments. I developed three versions of this slide.
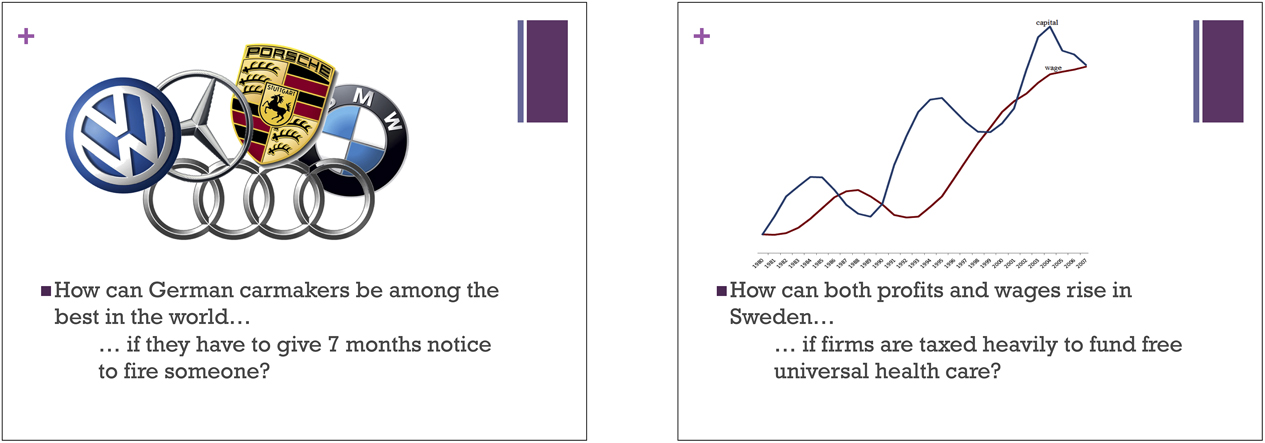
Figure 1 Introductory Slides

Figure 2 Concluding Slide
Political Science and Skill Development
The first version of the third slide, shown in figure 3, emphasized skills that might be of interest to students pursuing different majors. Business students with the desire to work abroad might be interested in case studies that offer insights into how corporate-governance rules differ across countries; engineering students might be interested in learning how to register patents or organize production processes in countries with different regulations; and students interested in pursuing a career in the public sector were promised opportunities to master cost-benefit calculations and policy analyses.Footnote 2

Figure 3 Treatment Emphasizing Skills
This treatment was inspired by the ongoing debate regarding whether political science degrees prepare graduates for the workplace. Some scholars argue that we do not provide the skills required for “employability” (Bobic Reference Bobic2005); others disagree with this claim and point out that political science majors are doing fairly well in the job market (Lewis Reference Lewis2017; Robinson Reference Robinson2013). The profession provides meaningful advice for designing curricula (Breuning, Parker, and Ishiyama Reference Breuning, Parker and Ishiyama2001), individual classes (Olsen and Statham Reference Olsen and Statham2005), group projects (Clark Reference Clark2011), and assignments (Alex-Assensoh Reference Alex-Assensoh2008; Çavdar and Doe 2012; Trueb Reference Trueb2013) that foster students’ skills. My experiment analyzed whether students are attracted to these prospects.
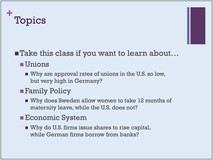
Political Science and Political Topics
The second version of the third slide focused on long-term political topics, such as structural issues that might differ across countries. Specifically, I presented information on how the configuration of democracy and capitalism differ across Germany, Sweden, and the United States (figure 4). For several reasons, I chose the examples involving the perception of unions, maternity leave, and corporate finance. First, these issues are slowly changing, reflecting a long-term perspective in sharp contrast to a focus on fleeting current events. Second, these issues are general enough to be easily comprehensible to non-political science students. Third, students cannot expect an immediate payoff with respect to their employability because these issues do not have a direct application to specific careers. In other words, this frame is likely to attract those interested in learning for the sake of learning.Footnote 3
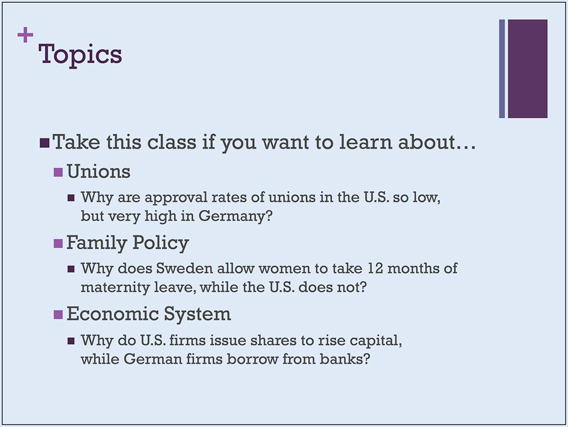
Figure 4 Treatment Emphasizing Topics
This treatment was inspired by the possibility that students might “perceive a broad education as something good in itself” (Johansson et al. Reference Johansson, Segerstad, Hult, Dahlgren and Dahlgren2007, 628). Students might understand that broad knowledge about how the world works—as opposed to narrowly defined employment skills—contributes to their personal development. Bowden and Marton (Reference Bowden and Marton2004) argued that teaching specific skills might be pointless considering the unknown future in which graduates will find themselves. Instead, a focus on developing students’ ability to consider the diverse nature of phenomena in the surrounding world would mentally prepare them to take on new learning tasks and be ready to reconsider their prior notions of phenomena. Along these lines, Brooks (Reference Brooks2005) argued that comparative politics courses have a positive impact on the level of students’ intercultural sensitivity. By examining the ways in which other countries respond to problems similar to ours, “we broaden our knowledge of political alternatives and possibilities” (Kopstein, Lichbach, and Hanson Reference Kopstein, Lichbach and Hanson2014, 13). Magstadt (Reference Magstadt2016) noted the need for reference points to properly evaluate the strengths and weaknesses of our own political system, practices, and policies. A broad understanding of the diversity in political practices, institutions, traditions, and cultures fosters moral and intellectual growth (Magstadt Reference Magstadt2016) and helps students to develop their civic literacy (Milner Reference Milner2002). Therefore, learning for the sake of learning might contribute to the moral development of students by enabling them to better evaluate the world they live in, resulting in more civic engagement.
Students might understand that broad knowledge about how the world works—as opposed to narrowly defined employment skills—contributes to their personal development.
Political Science and Current Events
The third version of the treatment slide emphasized current events. This pitch focused on short-term policies rather than slowly changing differences across countries. The slide made use of the 2016 presidential campaign, which was ongoing during the experiment. At the time, Donald Trump was the presumptive nominee of the Republican Party, whereas the runoff between Hillary Clinton and Bernie Sanders of the Democratic Party was not yet decided. Consequently, the treatment slide displays the three candidates’ names. In addition, a shortened quote illustrating one prominent campaign promise was shown, contrasted with policies from Germany and Sweden that already implement these promises.
This treatment was inspired by the possibility that political science might help us to “understand the manner in which complex current events are relevant to our own lives due to increasing levels of social, economic, and political interdependence” (Hauss Reference Hauss1995). Champney and Edleman (Reference Champney and Edleman2010) provided evidence that students’ knowledge about current events increases with political science courses. As a result, scholars have offered advice on how to incorporate current events in courses. In line with the treatment definition, political scientists have suggested strategies to teach students about presidential campaigns (Abramson and Kraitzman Reference Abramson and Kraitzman2014; Journell Reference Journell2009). Furthermore, Burgos (Reference Burgos2008) offered advice on how to design a course on the Iraq war, and Koehler-Derrick (Reference Koehler-Derrick2013) and Paczynska (Reference Paczynska2013) discussed their courses on the Arab Spring. My experiment tested whether these efforts attract students to political science courses.
TREATMENT ASSIGNMENT
I assigned different treatments across the various sections. This procedure resulted in the following five experimental groups:
Group A - Skills: Slides 1, 2, and 4, plus Slide 3a (figure 3).
Group B - Topics: Slides 1, 2, and 4, plus Slide 3b (figure 4).
Group C - Current Events: Slides 1, 2, and 4, plus Slide 3c (figure 5).
Group D - Course Information Only: Slides 1, 2, and 4 only
Group E - Control: No visit
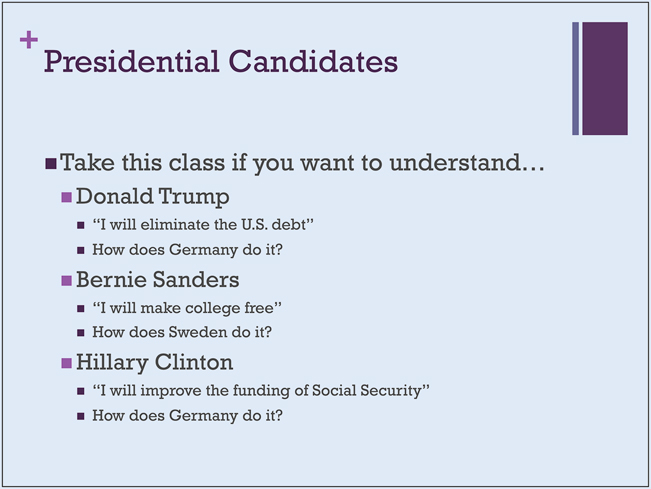
Figure 5 Treatment Emphasizing Current Events
ANALYSIS
The resulting sample includes all students enrolled in the required lower-level courses. The dependent variable is a binary indicator recording whether a student also enrolled in the upper-level course the next semester. I recorded the treatment that every student received.
Although I randomly assigned treatments to each section, individual students—the unit of analysis—self-selected into the respective sections. This implies that treatments were not randomly assigned to individual students. For this reason, estimating the causal effect of a treatment on an outcome based on observational data is challenging. Consequently, I utilized a matching approach designed for estimating the average treatment effect (ATE) from observational data. Specifically, I used propensity-score matching to identify student pairs that were as similar as possible across observable characteristics but that received different treatments.
I used three covariates for matching. First, data on students’ declared major allowed matching individuals by their field of study. Here, I differentiated among social science, business and management, natural sciences, and engineering. Second, information on students’ year of study accounted for differences among freshmen, sophomores, juniors, and seniors. Third, I matched on students’ gender. The matching process ensured that I compared only similar students. For example, I compared the likelihood of enrollment of a male sophomore engineering student who received the skills treatment to another male sophomore engineering student who did not receive this treatment. Similarly, I compared the likelihood of enrollment of a female business junior who received the topics treatment to a female business junior who did not. The average difference between the outcomes of these student pairs constitutes the ATE.Footnote 4
Analysis 1: Comparison to Students Not Exposed to Treatment
Estimating the ATE thus involved the difference in the likelihood of enrolling between students in the treatment and control groups. The design of the experiment allowed me to use different definitions of the control group. In the first instance, I used students that I did not talk to (i.e., group E) as counterfactuals. I calculated the ATE for group A versus group E, B versus E, C versus E, and D versus E.
Figure 6 displays the findings. Providing students with only the course information did not increase the likelihood of enrollment. Similarly, framing the course as an opportunity to develop skills or a chance to learn about current events did not increase the likelihood of enrollment. In contrast, describing the course in terms of long-standing topics had a positive and statistically significant effect on increasing enrollment. In substantive terms, advertising the course using frame B—that is, emphasizing topics—increased the likelihood of a student enrolling by 3%.

Figure 6 Comparison between Treatment and Control Group
Note: The figure displays the Average Treatment Effects (ATE) after matching. The control group consists of those students I did not visit. The analysis matches students from group A to students from group E (N=257) to estimate the effect of the skill treatment; group B is matched with group E (N=355) to examine the topics treatment; group C is matched to group E (N=408) for the current-events treatment; and group D is matched again with group E (N=208) to analyze the effect of providing course information only.
Analysis 2: Comparison to Students Who Did Not Attend Class
The previous analysis compared students across sections, which might be problematic if students’ motivation for enrolling differed across sections. For example, students might have a preference for a specific instructor. To address this concern, I used a second definition of the control group: students who were absent the day I visited their class. Comparing otherwise similar students who attended class in a specific section to those who missed that class allowed identifying the treatment effect for individuals enrolled in the same section and avoided the comparison across sections. However, it introduced a possible selection bias because students attending class might differ from those skipping it. To address this possibility, I again matched on individuals’ covariates. Using this approach, I calculated the ATE by comparing students attending A to those skipping A, those attending B to those skipping B, and so forth.
Figure 7 shows that the findings were consistent with previous results. Frames that emphasized skills and those that merely provided class information did not increase the likelihood of enrollment. In contrast, emphasizing fundamental political topics had a positive and significant effect. In addition, framing the class in terms of current events now also displayed a statistically significant and positive effect on the likelihood of enrollment. However, its point estimate was smaller than that of the topics frame.
Figure 7 Comparison between Attending and Non-Attending Students
Note: The figure displays the ATE after matching attending to non-attending students. Matching attending students from group A to non-attending students from group A results in a sample size of 247 observations. The same comparison within group B results in 424, within group C results in 477, and within group D results in 65 observations.
Analysis 3: Comparison to Students Who Received Class Information Only
The previous two analyses provided consistent evidence both across and within sections. However, they did not allow differentiating between the effect of specific frames and the effect of me simply talking to students. To distinguish between these possibilities, I defined the control group as those students who were provided with information only about the name and date of the course. I then compared students in this control group to those who received an explicit frame focusing on skills, topics, or current events. In other words, I compared groups A, B, and C to group D. I again matched on gender, field of study, and year of study to account for possible differences across students in these sections. Figure 8 shows that topics and current-events frames still have a positive and statistically significant effect on the likelihood of enrollment, whereas the skills frame did not.

Figure 8 Comparison between Treatments and Providing Information Only
Note: The figure displays the ATE after matching. The control group is the set of students that received only basic course information, such as course number, date, and time. To estimate the effect of the skills treatment, the analysis matches students from group A to students from group D (N=101); for the topics treatment, group B is matched with group D (N=199); and for the current-events treatment, group C is again matched to group D (N=252).
In summary, the three analyses differed with respect to the control group used. However, the results were robust across these specifications, which inspire confidence in these findings. Framing a future course in terms of substantive topics increases the likelihood of students’ enrollment. In contrast, enrollment does not increase if the course is framed as an opportunity to develop specific skills.
FOLLOW-UP SURVEY
These findings suggest that political science departments can attract students by advertising courses as an opportunity to learn “how the world works and how it relates to students.” This framing has a positive and significant effect on the likelihood of students enrolling.
To confirm the insights of the experiment, I conducted a survey among the students enrolled in the upper-level course on the first day of class. I asked them to indicate how strongly they felt about different learning objectives. The top panel in table 1 displays their preference intensity. The distribution of responses suggests that most students felt strongly about topics, followed by presidential campaigns, whereas developing skills received less interest.
Table 1 Preference Order and Intensity of Students Enrolled in Subsequent Course (N=46)
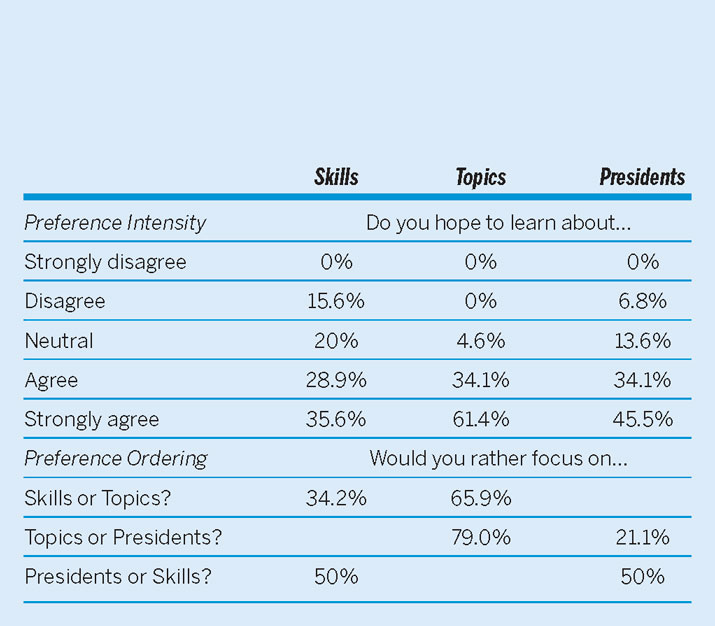
However, measuring students’ preference intensity separately for each objective might not be ideal because it allows them to strongly prefer all three objectives. For this reason, this survey also compelled students to reveal their preference ordering. The bottom panel in table 1 displays results of three pair-wise comparisons in which students had to choose one of the two objectives but could not select both. The data indicate that students, if forced to choose, prefer that the course focus on topics to skills or current events.
The survey also posed an open-ended question to get a better sense of students’ hopes for this course. I asked them to write down their primary learning goal. I classified their responses to this open-ended question: 7.3% of statements centered on presidential campaigns, 24.4% focused on skills, and 68.3% identified topics as their most important objective.
Among those students hoping to learn about presidential campaigns, one identified her primary learning objective as “learning about elections and politics.” Of the students interested in developing skills, learning objectives included “deepen writing skills and explain issues efficiently” and “develop skills to use in courtroom.” Within the group of students interested in topics, three different types of motivations were apparent. The first type emphasized their desire for facts, such as “hoping [the] course sheds light on policy differences across countries” and “gaining knowledge of policies in foreign countries.” A second type of statement went beyond a mere wish for information and instead focused on the policy relevance of topics. Examples included students requesting a “deeper understanding of how policies impact a country” and a “better understanding of options when advising officials.” Most frequent was the third type of comment concerning personal development, such as “broaden knowledge base,” “widen my thinking,” “become more well-rounded,” and “develop an analytical framework for information.”
In summary, the follow-up survey confirmed the findings of the experiment: most students hoped to learn about fundamental topics and were less interested in skills and current events. The qualitative evidence suggests that students often hope such courses will contribute to their personal development.
CONCLUSION
These findings suggest that political science departments can attract students by advertising courses as an opportunity to learn “how the world works and how it relates to students.” This framing has a positive and significant effect on the likelihood of students enrolling. Emphasizing how political science classes shed light on current events also might increase enrollments, although the findings were less robust and the effect was smaller in magnitude. Importantly, framing political science courses as opportunities to develop skills did not appear to increase enrollment. However, at no point does this article argue that skills are unimportant for political science courses; I merely found that students were not attracted to courses emphasizing these learning opportunities. Instead, the findings indicated that we might lure students with content and, once enrolled in our courses, train them in the skills that political science can offer.
Several limitations of the study should be noted. First, using covariates for matching purposes limits inference because it precludes possible subgroup analyses. For example, it is not possible to examine whether the treatment effect varies across students’ field of study. Second, the topics treatment focused on comparative politics. It is an open question, however, whether topics drawn from other political science subfields would have similar effects. A possible avenue for future research therefore might involve comparing the effect of topics from political theory, international relations, and American politics on subsequent enrollment. Third, the effect sizes were fairly small. However, increasing the likelihood of enrollment by a statistically significant 3% should not be trivialized, considering that the treatment effectively consisted of a single PowerPoint slide and the summer break between the spring and fall semesters. A “back-of-the-envelope” calculation suggests that enrollment in the future course would have increased by 19 students if I had exposed all 627 students attending the introductory classes to the frame that emphasized topics.
My study provides guidance for departmental recruitment efforts. More broadly, the findings provide insights into student perceptions of departments’ relative strength. We likely will be unsuccessful when competing with natural sciences and management degrees that, in the minds of students, offer a specific set of skills applicable to an easily identified career path. Instead, our comparative advantage may be providing opportunities for personal development. Students apparently value becoming well-rounded individuals capable of understanding the world in which they live. For this reason, framing classes as “generalist courses” might appeal to students beyond the usual constituency from which political science typically draws its students. In my case, a third of students enrolled in the advertised course were majoring in natural sciences, engineering, and business—despite the fact that it was listed as a political science course. Furthermore, the in-class survey I conducted on the first day of the semester included a question about students’ plans for their future careers: about 50% enrolled in the course were hoping for employment in technical, medical, and corporate sectors—careers that are not directly related to politics. These data illustrate that political science offers value to future engineers, doctors, and CEOs.
The findings also speak to the reorganization of higher-education systems. Busemeyer and Trampusch (2011, 420) noted that “study structures have been reformed with the aim of improving the ‘employability’ of students.” The Bologna process set in motion by the European Union is one example, as are efforts by the British Higher Education Academy to make international relations departments in the United Kingdom more skill oriented (Lee, Foster, and Snaith Reference Lee, Foster and Snaith2014). In contrast to these efforts, my findings suggest that it might be worth considering the critical difference between ‘obtaining specific skills’ and ‘learning how to apply such skills in a complicated, ever-changing, and inherently uncertain world.’ Successfully transferring skills from one situation to a substantially different situation requires a frame of reference. Political science might offer opportunities to individuals to develop such a framework, thereby enabling them to make use of their skills.
SUPPLEMENTARY MATERIAL
To view supplementary material for this article, please visit https://doi.org/10.1017/S1049096518002056
ACKNOWLEDGMENTS
I thank Patrick Brandt, Iliyan Iliev, and Brian Bearry for allowing me to speak to their students. I thank Paul Diehl, Vito D’Orazio, Jennifer Holmes, Karen Huxtable-Jester, Banks Miller, Geoff Sheagley, and participants in the APSA conference for helpful comments and suggestions. Les Stanaland, Anh Pham Thi Cam, and John Taden provided excellent research assistance. Any errors are my own.