


1 Introduction
Using computers as assessment delivery platforms allowed the collection of process data, which is computer log data that documents an examinee’s sequence of actions (e.g., clicks, keystrokes, and revisits) while solving a task (Bergner & von Davier, Reference Bergner and von Davier2019). Typically, the sequence of actions of an examinee on a particular item is stored as a tuple of nominal elements, each representing a specific action. For example, an action sequence on a constructed response item might be: (Enter_Item, Open_Scratchwork, Draw, Clear, Zoom_In, Type_7.35, Exit_Item, Enter_Item, Type_73.5, Exit_Item). It shows us what tools the examinee utilized, what answers the examinee typed in before submitting the final response, and how many times the examinee visited this item page on the computer. Such data can preserve valuable information on how examinees arrived at their outcome, thus providing information beyond response data (i.e., correct/incorrect). A rich body of literature demonstrated the utility of process data for common measurement and educational tasks, for instance, to build measurement models characterizing examinee and item characteristics (e.g., Chen, Reference Chen2020; Fang & Ying, Reference Fang and Ying2020; LaMar, Reference LaMar2018; Xiao & Liu, Reference Xiao and Liu2024; Zhan & Qiao, Reference Zhan and Qiao2022) and improve proficiency scoring (e.g., He et al., Reference He, Shi and Tighe2023; Zhang et al., Reference Zhang, Wang, Qi, Liu and Ying2022), to identify behavioral prototypes or stages of problem-solving (e.g., Eichmann et al., Reference Eichmann, Greiff, Naumann, Brandhuber and Goldhammer2020; Hao & Mislevy, Reference Hao and Mislevy2019; He et al., Reference He, von Davier, Han, Jiao, Lissitz and Wie2019, Reference He, Borgonovi and Suárez-Álvarez2022; Tang, Reference Tang2023; Ulitzsch et al., Reference Ulitzsch, He and Pohl2022; Wang et al., Reference Wang, Tang, Liu and Ying2020), and to identify behavioral characteristics that predict final performance (e.g., Greiff et al., Reference Greiff, Wüstenberg and Avvisati2015; He & von Davier, Reference He and von Davier2016; Qiao & Jiao, Reference Qiao and Jiao2018; Ulitzsch et al., Reference Ulitzsch, He, Ulitzsch, Molter, Nichterlein, Niedermeier and Pohl2021, Reference Ulitzsch, He and Pohl2022).
The current article focuses on using process data to understand problem-solving patterns that account for group differences in test scores. Test scores play a vital role in many key decisions, both for individual candidates (e.g., in college admissions, licensing, and recruitment) and for educators and policymakers using formative and large-scale assessment data to guide instruction and policy development. Understanding demographic subgroup differences in test-taking behavior and performance is critical for mitigating potential test biases and closing achievement gaps. An example is the achievement gap in mathematics between U.S. students from underrepresented groups, such as racial minority groups and students with disabilities, and their peers, which has been persistently reported based on the National Assessment of Educational Progress (NAEP) over the years (U.S. Department of Education. Institute of Education Sciences, National Center for Education Statistics, 2022). While the NAEP assessments are designed to measure student performance instead of to explain the differences, there is growing interest in the potential utility of test-taking process data, coupled with student background and proficiency information, to provide additional insights into how problem-solving behavior (e.g., test-taking strategies, misconceptions, use of accommodation/universal design tools) explains performance differences across demographic groups. This is exemplified by the release of the restricted-use process data from select blocks of the NAEP 2017 Grade 8 and Grade 4 math assessments (NCES, 2020), as well as recent Institute of Education Sciences (IES) calls for proposals on the use of NAEP process data to understand the link between test-taking behavior and mathematics performance for learners with disabilities, the goal being to gather evidence that ultimately contributes to the improvement of learning of these students from special populations.
Indeed, many previous studies have shown that analyzing process data can aid in understanding subgroup differences (e.g., He & von Davier, Reference He and von Davier2016; Liao et al., Reference Liao, He and Jiao2019) and explaining differences in sequential patterns in correct/incorrect problem-solving (e.g., Greiff et al., Reference Greiff, Wüstenberg and Avvisati2015; He & von Davier, Reference He and von Davier2016; Ulitzsch et al., Reference Ulitzsch, Ulitzsch, He and Lüdtke2022). While these findings provide supporting evidence on the potential use of process data to understand subgroup differences in item performance, the limitation of prior approaches for investigating the process data is that the relationship between action sequence patterns and demographic backgrounds (e.g., Eichmann et al., Reference Eichmann, Greiff, Naumann, Brandhuber and Goldhammer2020), and similarly the relationship between action sequence patterns and final response (e.g., Eichmann et al., Reference Eichmann, Goldhammer, Greiff, Brandhuber and Naumann2020; Gao et al., Reference Gao, Cui, Bulut, Zhai and Chen2022; He et al., Reference He, Borgonovi and Suárez-Álvarez2023) are studied separately. This does not directly address the question of what types of sequential patterns contributed to group differences. Addressing this requires modeling problem-solving patterns as a potential mediator that explains group differences in the final response. To date, no model-based approach directly addresses this need. We propose a latent class mediation analysis (LCMA) procedure to address this question. Using continuous process features extracted from action sequence data (e.g., features extracted using multidimensional scaling [MDS]) as indicators, latent classes underlying the test-taking behavior are identified in a latent class mediation model, where an examinee’s nominal latent class membership enters as the mediator between the observed grouping and outcome variables.
In the traditional latent variable mediation analysis, the mediator is a continuous latent construct that mediates the predictor’s effect on the outcome in a linear fashion. Two methods can be used to estimate the mediation effect: the difference in coefficients method and the product of coefficients method. In the difference in coefficients method, an outcome is regressed on the predictor and then on both the predictor and mediator, and the indirect effect is the difference in the coefficient of the predictor. In the product of coefficients method, the mediator is regressed on the predictor, and the outcome is regressed on the predictor and mediator, and the indirect effect is the product of the coefficients associated with the predictor–mediator and mediator–outcome relationships. By contrast, in LCMA, the mediator is a discrete grouping variable whose membership probabilities change with the predictor and generate stepwise changes in the outcome. When both the mediator and outcome are continuous, the total effect of the predictor can be additively decomposed into direct and indirect effects. However, this additive decomposition is not straightforward when the mediator is discrete, and traditional methods for identifying indirect effects are no longer applicable (Sint et al., Reference Sint, Rosenheck and Lin2021). A counterfactual framework (Pearl, Reference Pearl2010; Robins & Greenland, Reference Robins and Greenland1992) resolves these issues by defining direct effect (DE) and total indirect effect (TIE) for discrete mediators. The TIE summarizes the mediation effect of a latent class mediator as the expected outcome difference in a focal group when class membership changes from what it would be under the focal group to what it would be under a reference group.
One difficulty in analyzing process data arises from the nonstandard format of response processes. That is, the length of action sequences varies across examinees and is coded as nominal elements, making traditional analyses inapplicable to process data such as generalized linear models. Addressing the issue of unstructured data format, we work with features extracted from process data. One example of a process feature extraction method is MDS (Borg & Groenen, Reference Borg and Groenen2005; Tang et al., Reference Tang, Wang, He, Liu and Ying2020). The extracted MDS features are in a rectangular data format and scaled on a continuum while containing the information of the original action sequences, making it suitable for the proposed LCMA procedure.
Another challenge in process data analysis is that the features extracted from the process data are often high-dimensional. To address this issue, we further perform dimension reduction of the process features via model-based clustering on the process features, that is, latent class analysis. Latent class analysis (Banfield & Raftery, Reference Banfield and Raftery1993; Lazarsfeld, Reference Lazarsfeld1950; Lazarsfeld, Reference Lazarsfeld1968; Oberski, Reference Oberski2016; Vermunt & Magidson, Reference Vermunt and Magidson2002) can be used to identify latent nominal variables through a set of observed indicators. Clustering is often used to explore common sequential patterns and to link them to variables of interest, such as final performance and demographics (e.g., Gao et al., Reference Gao, Zhai, Bulut, Cui and Sun2022; Hao & Mislevy, Reference Hao and Mislevy2019; He et al., Reference He, Borgonovi and Suárez-Álvarez2023). Here, we use the term latent class to refer to the latent profile or the Gaussian mixture component underlying continuous indicators. Identifying latent classes in process data can classify examinees into subgroups based on their test-taking behavior and reveal individual differences in sequential patterns (e.g., Bergner & von Davier, Reference Bergner and von Davier2019; Welling et al., Reference Welling, Gnambs and Carstensen2024).
These latent classes may also help explain performance gaps, such as those observed on the NAEP Math Assessment between students with learning disabilities (LD) and their peers (Judge & Watson, Reference Judge and Watson2011). This can be achieved by considering the latent class variable as a mediator explaining the effect of a predictor on the outcome (e.g., Muthén, Reference Muthén2011; Sint et al., Reference Sint, Rosenheck and Lin2021). Literature discussing latent classes as potential mediators has primarily focused on latent class mediators with discrete indicators (e.g., Hsiao et al., Reference Hsiao, Kruger, Lee Van Horn, Tofighi, MacKinnon and Witkiewitz2021; Muthén, Reference Muthén2011). However, there is a lack of methodological investigation in LCMA with continuous indicators (Hsiao et al., Reference Hsiao, Kruger, Lee Van Horn, Tofighi, MacKinnon and Witkiewitz2021). Literature considering the extension of latent class analysis with continuous indicators is limited to the latent class model with either covariates (Murphy & Murphy, Reference Murphy and Murphy2020; Vermunt & Magidson, Reference Vermunt and Magidson2002), or the latent class model with distal outcomes (Dziak et al., Reference Dziak, Bray, Zhang, Zhang and Lanza2016; Vermunt, Reference Vermunt2010). In this study, we extend the latent class analysis with continuous indicators (e.g., process features) to explain the effect of a binary predictor on a binary outcome through the nominal latent class mediator. An Expectation-Maximization (EM) algorithm is implemented for parameter estimation.
Extracted process features may contain noise or irrelevant information, which can weaken the generalizability of results in latent class mediation models. Removing noisy indicators can enhance classification accuracy and parameter precision in latent class analysis (Dean & Raftery, Reference Dean and Raftery2010). To address this, variable selection methods, such as the headlong search algorithm, have been proposed to identify the optimal set of indicators. In this study, a headlong search algorithm, which is generally used to explore the model space and select clustering variables, was used to select process features that maximize the TIE of the latent class mediator in explaining group differences in outcomes.
In summary, we propose a LCMA procedure for 1) identifying the latent class underlying the distribution of process features, 2) finding the set of process features that can best explain the effect of observed group membership on the outcome, and 3) assessing the indirect effect of the group membership on the outcome through the nominal latent class mediator. A headlong search algorithm is used to find the set of process features that best explains the group difference in performance. This is achieved by finding the optimal subset of process features that maximizes the TIE. The proposed framework is intended primarily as an exploratory tool for hypothesis generation from the complex process data, rather than a confirmatory tool for drawing causal conclusions about test-taking behaviors.
The rest of the article is structured as follows. The next section begins with a motivating example based on one item from the NAEP 2017 Grade 8 Math Assessment. Then, the latent class mediation model and the parameter estimation algorithms are introduced. It is followed by the headlong search algorithm for selecting the optimal set of process features. In a simulation study, the performance of the proposed analysis procedure is evaluated in terms of classification accuracy and parameter estimation accuracy. This is followed by an empirical application of the procedure on the NAEP Math Assessment item from the motivating example. Lastly, the significance and limitations of the current study are discussed.
2 LCMA
2.1 Motivating example
As a motivating example, we consider one item available from the restricted-use response and process data in the digital version of the 2017 NAEP Grade 8 Math Assessment. NAEP adopts a probabilistic sampling approach to select schools and students to represent the diverse student population in the United States. The data set consisted of $28,194$
nationally sampled students who were administered a 15-item block (block 1717MA2N03CLID30EX) on the eNAEP, which was administered with a Surface tablet and a stylus. The eNAEP was also embedded with a set of universal design tools, including scratchwork (where students could draw and erase), zooming, color theme change, equation editor, text-to-speech (TOS), and highlighting. Students were allowed to revisit an item multiple times during the test, and each enter/exit of the item page was recorded. For this block, students were not allowed to use a calculator. The data set consisted of students’ ordinal scores to the 15 math items, as well as their log data on the math block, which contained student interactions with the eNAEP platform, such as item visits, tool usage, and response entries to the 15 multiple choice, constructed response, or drag-and-drop items. Students, teachers, and schools also completed a series of survey questionnaires, which contained information on students’ disability status and accommodation on the test.
$28,194$
nationally sampled students who were administered a 15-item block (block 1717MA2N03CLID30EX) on the eNAEP, which was administered with a Surface tablet and a stylus. The eNAEP was also embedded with a set of universal design tools, including scratchwork (where students could draw and erase), zooming, color theme change, equation editor, text-to-speech (TOS), and highlighting. Students were allowed to revisit an item multiple times during the test, and each enter/exit of the item page was recorded. For this block, students were not allowed to use a calculator. The data set consisted of students’ ordinal scores to the 15 math items, as well as their log data on the math block, which contained student interactions with the eNAEP platform, such as item visits, tool usage, and response entries to the 15 multiple choice, constructed response, or drag-and-drop items. Students, teachers, and schools also completed a series of survey questionnaires, which contained information on students’ disability status and accommodation on the test.
In the NAEP Math Assessment, students with LD consistently underperformed compared to their typically developing (TD) peers (Judge & Watson, Reference Judge and Watson2011). For the current example, we aim to identify test-taking process patterns that can explain this performance gap between LD and TD learners, by focusing on one item on the multiplication of decimals (VH336968) from this block (Figure 1). The item asked students to find the solution to $1.5 \times 4.9$
without using a calculator, and the correct response was
$1.5 \times 4.9$
without using a calculator, and the correct response was $7.35$
. This item was chosen because it was a constructed response item allowing various responses, and it was a relatively computationally involving task, where students use a certain tool (i.e., scratchwork) to facilitate computation.
$7.35$
. This item was chosen because it was a constructed response item allowing various responses, and it was a relatively computationally involving task, where students use a certain tool (i.e., scratchwork) to facilitate computation.
Item VH336968 from the 2017 NAEP Grade 8 Math Assessment.

The NAEP restricted-use log data recorded each response entry to a constructed response item, from putting the cursor in the textbox to leaving the textbox, as one event. The log data thus contained the sequence of interactions of a student on the item, including various constructed response entries (a student can have multiple entries if they made answer changes throughout the test), tool usage, and item revisits (Exit_Item, Enter_Item in the middle of the action sequence). In the data preprocessing stage, we removed system events from the log data and recoded repeated actions, such as consecutive draws/erases for each stroke using the scratchwork tool, into a single action. The first and the last actions (Enter_Item, Exit_Item) were discarded as these were the common elements in all students’ action sequences. We masked the final responses to ensure the action sequence does not directly predict the final outcome, and the answer entries were recoded into two categories. The “735” category includes answers containing the number sequence 7, 3, and 5, with the decimal place masked. The “non-735” category includes responses that do not include the numbers 7, 3, or 5. A preliminary analysis revealed a common error, where many test takers placed the decimal point incorrectly, leading to errors of 735 and 73.5. Recoding the answers in this way masked the final responses while retaining information about the types of mathematical concepts the test takers struggled to demonstrate. Students with disabilities other than LD (e.g., Autism) and those who received extended time accommodation (90-minute version) were excluded from the analysis. The sample size of the LD group was $590$
. Two thousand five hundred students from the TD group were randomly selected to balance the sample size between the two groups and reduce computational demand. The sample size of the final data set used in the analysis was thus
$590$
. Two thousand five hundred students from the TD group were randomly selected to balance the sample size between the two groups and reduce computational demand. The sample size of the final data set used in the analysis was thus $N = 3090$
. Descriptive statistics of the sample are given in Table 1. The marginal proportion of correct responses was
$N = 3090$
. Descriptive statistics of the sample are given in Table 1. The marginal proportion of correct responses was $0.49$
for the TD group and
$0.49$
for the TD group and $0.21$
for the LD group.
$0.21$
for the LD group.
Descriptive statistics of the NAEP Math Assessment Item VH336968

Note: ELL is the English language learners. The number of LD students was $590$
and the number of TD students was
$590$
and the number of TD students was $2500$
. The sample sizes are rounded to the closest 10.
$2500$
. The sample sizes are rounded to the closest 10.
Source: U.S. Department of Education, National Center for Education Statistics, “Response Process Data from the NAEP 2017 Grade 8 Mathematics Assessment.”
To transform the process data into continuous features suitable for the subsequent analysis while preserving the original sequential pattern information, MDS was applied for feature extraction. MDS is a dimension reduction method that extracts latent features based on the pairwise dissimilarity measure between two observations. The technical details of extracting MDS features from the action sequence process data are summarized in Appendix A. The proposed LCMA procedure has a multivariate normal distributional assumption on the indicators of the latent class variable. The process features extracted from MDS are scaled on a continuum and are suitable for the proposed analysis. However, note that our proposed method is not limited to process features from MDS. Any feature extraction method that transforms the original action sequence data to a rectangular and continuous data format while preserving the information of examinees’ problem-solving behavior could serve as a viable alternative to MDS. Based on a five-fold cross-validation, $K = 15$
total features were extracted. The cross-validation was run on the dissimilarity matrix of the action sequence data using the ProcData R package (Tang et al., Reference Tang, Zhang, Wang, Liu and Ying2021). The dissimilarity matrix of the action sequence data was obtained as described in Appendix A. Then, the
$K = 15$
total features were extracted. The cross-validation was run on the dissimilarity matrix of the action sequence data using the ProcData R package (Tang et al., Reference Tang, Zhang, Wang, Liu and Ying2021). The dissimilarity matrix of the action sequence data was obtained as described in Appendix A. Then, the $15$
process features
$15$
process features $M_k ~(k = 1, \ldots , K)$
extracted using MDS were used as the potential candidates of continuous indicators in the LCMA.
$M_k ~(k = 1, \ldots , K)$
extracted using MDS were used as the potential candidates of continuous indicators in the LCMA.
The LCMA aims to find the latent classes underlying the process features that can explain the correct response probability gap between the LD and TD students. In the latent class mediation model, the predictor G was the binary disability membership variable, where $G = 0$
if the student belongs to the TD group and
$G = 0$
if the student belongs to the TD group and $G = 1$
if the student belongs to the learning disability group, the outcome Y was the binary score on the multiplication item, with
$G = 1$
if the student belongs to the learning disability group, the outcome Y was the binary score on the multiplication item, with $Y = 0$
indicating an incorrect response, and
$Y = 0$
indicating an incorrect response, and $Y = 1$
indicating a correct response (i.e., answers equivalent to
$Y = 1$
indicating a correct response (i.e., answers equivalent to $7.35$
). The English language learner (ELL) variable was included as a covariate X to control for potential confounding effects between the predictor and mediator, as well as between the mediator and outcome. Here,
$7.35$
). The English language learner (ELL) variable was included as a covariate X to control for potential confounding effects between the predictor and mediator, as well as between the mediator and outcome. Here, $X = 1$
indicates an ELL, and
$X = 1$
indicates an ELL, and $X = 0$
indicates otherwise. The
$X = 0$
indicates otherwise. The $K = 15$
process features,
$K = 15$
process features, $\mathbf {M}$
, were the candidate indicators of the latent class membership variable (
$\mathbf {M}$
, were the candidate indicators of the latent class membership variable ( $\Omega $
) that mediates the relationship between G and Y. The proposed LCMA procedure can be applied to find the optimal subset of process features maximizing the TIE of the latent class mediator between the predictor and the outcome. We next articulate the model formulation as well as the technical details.
$\Omega $
) that mediates the relationship between G and Y. The proposed LCMA procedure can be applied to find the optimal subset of process features maximizing the TIE of the latent class mediator between the predictor and the outcome. We next articulate the model formulation as well as the technical details.
2.2 Latent class mediation model
The latent class part of the model assumes a nominal latent class variable $\Omega _i ~ (i = 1, \ldots , N)$
for N observations exists underlying the distribution of relevant process features
$\Omega _i ~ (i = 1, \ldots , N)$
for N observations exists underlying the distribution of relevant process features $\mathbf {M}_{\kappa , i}$
. The set of relevant features
$\mathbf {M}_{\kappa , i}$
. The set of relevant features $\mathbf {M}_{\kappa , i}$
is assumed to follow a mixture of multivariate normal distributions with class-specific mean
$\mathbf {M}_{\kappa , i}$
is assumed to follow a mixture of multivariate normal distributions with class-specific mean ${\boldsymbol{\mu}}_{\omega }$
and covariance
${\boldsymbol{\mu}}_{\omega }$
and covariance ${\boldsymbol {\Sigma }}_{\omega }$
.
${\boldsymbol {\Sigma }}_{\omega }$
.
 $$ \begin{align} \mathbf{M}_{\kappa, i} \mid \Omega_i = \omega \sim \text{MVN}({\boldsymbol{\mu}}_{\omega}, {\boldsymbol{\Sigma}}_{\omega}). \end{align} $$
Equation (1) implies that the distribution of an examinee’s process features, which contain information on their sequential patterns in pursuit of solving the item, differs across the latent classes. For a randomly sampled examinee, the probability density function of $\mathbf {M}_{\kappa , i}$
given
$\mathbf {M}_{\kappa , i}$
given ![]() , and
, and $\boldsymbol {\pi } = \{\pi _1,\ldots ,\pi _L\}$
is
$\boldsymbol {\pi } = \{\pi _1,\ldots ,\pi _L\}$
is

where L is the number of latent classes and $\pi _l$
is the probability of belonging to latent class l. Here,
$\pi _l$
is the probability of belonging to latent class l. Here, $f_l(\mathbf {M}_{\kappa , i} | {\boldsymbol{\mu}}_{l}, {\boldsymbol {\Sigma }}_{l})$
denotes the class-specific multivariate normal density.
$f_l(\mathbf {M}_{\kappa , i} | {\boldsymbol{\mu}}_{l}, {\boldsymbol {\Sigma }}_{l})$
denotes the class-specific multivariate normal density.
The effect of the binary group membership variable $G_i$
on the latent class
$G_i$
on the latent class $\Omega _i$
, controlling for covariate
$\Omega _i$
, controlling for covariate $X_i$
(
$X_i$
( $i = 1, \ldots , N$
), can be described by a multinomial logistic regression model in Equation 3.
$i = 1, \ldots , N$
), can be described by a multinomial logistic regression model in Equation 3.
 $$ \begin{align} P(\Omega_i = \omega \mid G_i = g, X_i = x) = \frac{e^{\beta_{0 \omega} + \beta_{1 \omega} g + \xi_\omega x}}{\sum_{l=1}^{L}e^{\beta_{0l} + \beta_{1l} g + \xi_l x}}. \end{align} $$
The regression coefficients $\beta _{0 \omega }$
,
$\beta _{0 \omega }$
, $\beta _{1 \omega }$
and
$\beta _{1 \omega }$
and $\xi _\omega $
are the class-specific intercept and slopes for class
$\xi _\omega $
are the class-specific intercept and slopes for class $\omega $
. For model identification, we set the intercept and slope of the first class to
$\omega $
. For model identification, we set the intercept and slope of the first class to $\beta _{01} = \beta _{11} = \xi _{1} = 0$
. Equation (3) implies that for an examinee i, the membership probability associated with the problem-solving latent class,
$\beta _{01} = \beta _{11} = \xi _{1} = 0$
. Equation (3) implies that for an examinee i, the membership probability associated with the problem-solving latent class, $\Omega _i$
, depends on the observed group membership
$\Omega _i$
, depends on the observed group membership $G_i$
, controlling for the covariate
$G_i$
, controlling for the covariate $X_i$
. When the predictor G does not represent a randomized intervention, associations among variables may be influenced by confounding factors. In such cases, it is common practice to adjust for potential confounders of the predictor–mediator (
$X_i$
. When the predictor G does not represent a randomized intervention, associations among variables may be influenced by confounding factors. In such cases, it is common practice to adjust for potential confounders of the predictor–mediator ( $G \rightarrow \Omega $
) and mediator–outcome (
$G \rightarrow \Omega $
) and mediator–outcome ( $\Omega \rightarrow Y$
) associations by including relevant covariates in the model (Muthén, Reference Muthén2011; Preacher, Reference Preacher2015; Valente et al., Reference Valente, Pelham, Smyth and MacKinnon2017; Witkiewitz et al., Reference Witkiewitz, Roos, Tofighi and Van Horn2018). This approach helps to reduce bias in the estimated associations.
$\Omega \rightarrow Y$
) associations by including relevant covariates in the model (Muthén, Reference Muthén2011; Preacher, Reference Preacher2015; Valente et al., Reference Valente, Pelham, Smyth and MacKinnon2017; Witkiewitz et al., Reference Witkiewitz, Roos, Tofighi and Van Horn2018). This approach helps to reduce bias in the estimated associations.
Given the group membership $G_i$
and the latent class membership
$G_i$
and the latent class membership $\Omega _i$
, examinee i’s outcome
$\Omega _i$
, examinee i’s outcome $Y_i$
is modeled via a logistic model, controlling for the covariate
$Y_i$
is modeled via a logistic model, controlling for the covariate $X_i$
,
$X_i$
,
 $$ \begin{align} P(Y_i = 1 \mid G_i = g, \Omega_i = \omega, X_i = x) = \frac{e^{\gamma g + \alpha_\omega + \zeta x}}{1 + e^{\gamma g + \alpha_\omega + \zeta x}}. \end{align} $$
Each latent class of the problem-solving process is associated with a class-specific intercept ( $\alpha _\omega $
). The coefficient vector
$\alpha _\omega $
). The coefficient vector $\boldsymbol {\alpha } = (\alpha _1,\ldots ,\alpha _L)'$
, together with
$\boldsymbol {\alpha } = (\alpha _1,\ldots ,\alpha _L)'$
, together with $\boldsymbol {\beta }_0 = (\beta _{01},\ldots ,\beta _{0L})'$
and
$\boldsymbol {\beta }_0 = (\beta _{01},\ldots ,\beta _{0L})'$
and $\boldsymbol {\beta }_1 = (\beta _{11},\ldots ,\beta _{1L})'$
, are associated with the indirect effect of the group membership G on the outcome Y, mediated by the nominal latent class
$\boldsymbol {\beta }_1 = (\beta _{11},\ldots ,\beta _{1L})'$
, are associated with the indirect effect of the group membership G on the outcome Y, mediated by the nominal latent class $\Omega $
. The coefficient
$\Omega $
. The coefficient $\gamma $
is associated with the direct effect of G on Y, after controlling for
$\gamma $
is associated with the direct effect of G on Y, after controlling for $\Omega $
and covariate X. Figure 2 shows the structure of the latent class mediation model using process data.
$\Omega $
and covariate X. Figure 2 shows the structure of the latent class mediation model using process data.
Latent class mediation model.
Note: $M_k$
represents a process feature,
$M_k$
represents a process feature, $\Omega $
is a latent class variable, G is a binary group membership (e.g., LD = 1 versus TD = 0), Y is a binary outcome (e.g., correct = 1 versus incorrect = 0)., and X is a covariate. Solid arrows indicate predictive relationships: G and X predict
$\Omega $
is a latent class variable, G is a binary group membership (e.g., LD = 1 versus TD = 0), Y is a binary outcome (e.g., correct = 1 versus incorrect = 0)., and X is a covariate. Solid arrows indicate predictive relationships: G and X predict $\Omega $
, while
$\Omega $
, while $\Omega $
and X predict Y. The dashed arrows indicate that the
$\Omega $
and X predict Y. The dashed arrows indicate that the $M_k$
s serve as measurement indicators of
$M_k$
s serve as measurement indicators of $\Omega $
.
$\Omega $
.

The likelihood of the model parameters given the observed group memberships $\mathbf G = (G_1, \ldots , G_N)^\prime $
, the final outcome
$\mathbf G = (G_1, \ldots , G_N)^\prime $
, the final outcome $\mathbf {Y} = (Y_1, \ldots , Y_N)^\prime $
, the process features
$\mathbf {Y} = (Y_1, \ldots , Y_N)^\prime $
, the process features $\mathbf {M}_{\kappa } = (\mathbf {M}_{\kappa , 1}, \ldots , \mathbf {M}_{\kappa , N})'$
, and the covariate
$\mathbf {M}_{\kappa } = (\mathbf {M}_{\kappa , 1}, \ldots , \mathbf {M}_{\kappa , N})'$
, and the covariate $\mathbf {X} = (X_1, \ldots , X_N)^\prime $
is
$\mathbf {X} = (X_1, \ldots , X_N)^\prime $
is

Note that the process features are assumed to be independent of the final outcome given the latent class membership. That is, the latent class is assumed to fully capture the relationship between the process features and the outcome, given the covariates.
The number of latent classes (L) is determined by fitting the latent class model only using the process features and comparing the Bayesian information criterion (BIC).
 $$ \begin{align} BIC = 2 \times loglikelihood - p \times log(N), \end{align} $$
where p is the number of parameters, and N is the sample size. BIC is known to be consistent in choosing the number of classes in a mixture model (Keribin, Reference Keribin1998).
The class-specific covariance matrix of process features for class l, ${\boldsymbol {\Sigma }}_l$
, is parameterized through an eigenvalue decomposition of the following form:
${\boldsymbol {\Sigma }}_l$
, is parameterized through an eigenvalue decomposition of the following form:
 $$ \begin{align} {\boldsymbol{\Sigma}}_l = \lambda_l \mathbf{D}_l \mathbf{A}_l \mathbf{D}_l^T, \end{align} $$
where $\lambda _l$
is a scalar controlling the volume of the ellipsoid,
$\lambda _l$
is a scalar controlling the volume of the ellipsoid, $\mathbf {A}_l$
is a diagonal matrix specifying the shape with
$\mathbf {A}_l$
is a diagonal matrix specifying the shape with $|\mathbf {A}_l| = 1$
, and
$|\mathbf {A}_l| = 1$
, and $\mathbf {D}_l$
is an orthogonal matrix determining the orientation of the ellipsoid (Banfield & Raftery, Reference Banfield and Raftery1993; Celeux & Govaert, Reference Celeux and Govaert1995; Fraley & Raftery, Reference Fraley and Raftery2002). Various equality constraints can be assumed between and within group covariance structures. In their works, Banfield & Raftery (Reference Banfield and Raftery1993) and Celeux & Govaert (Reference Celeux and Govaert1995) present models tailored to various clustering scenarios. These models are implemented in the mclust R package (Scrucca et al., Reference Scrucca, Fraley, Murphy and Raftery2023). Celeux & Govaert (Reference Celeux and Govaert1995) recommended using the model allowing different volumes and more parsimonious models, such as a diagonal covariance matrix for high-dimensional data. Here, we adopted the model that assumes varying volumes but equal shapes between classes and orientations aligned with the coordinate axes. In this parsimonious model, the class-specific covariance matrix becomes,
$\mathbf {D}_l$
is an orthogonal matrix determining the orientation of the ellipsoid (Banfield & Raftery, Reference Banfield and Raftery1993; Celeux & Govaert, Reference Celeux and Govaert1995; Fraley & Raftery, Reference Fraley and Raftery2002). Various equality constraints can be assumed between and within group covariance structures. In their works, Banfield & Raftery (Reference Banfield and Raftery1993) and Celeux & Govaert (Reference Celeux and Govaert1995) present models tailored to various clustering scenarios. These models are implemented in the mclust R package (Scrucca et al., Reference Scrucca, Fraley, Murphy and Raftery2023). Celeux & Govaert (Reference Celeux and Govaert1995) recommended using the model allowing different volumes and more parsimonious models, such as a diagonal covariance matrix for high-dimensional data. Here, we adopted the model that assumes varying volumes but equal shapes between classes and orientations aligned with the coordinate axes. In this parsimonious model, the class-specific covariance matrix becomes,
 $$ \begin{align} {\boldsymbol{\Sigma}}_l = \lambda_l \mathbf{B}, \end{align} $$
where $\mathbf {B}$
is a diagonal matrix with
$\mathbf {B}$
is a diagonal matrix with $|\mathbf {B}| = 1$
.
$|\mathbf {B}| = 1$
.
2.3 Parameter estimation
An EM algorithm (Dempster et al., Reference Dempster, Laird and Rubin1977) is implemented to find the marginal maximum likelihood estimates of the latent class mediation model by maximizing the observed data log-likelihood. Similar to the EM algorithm for the Gaussian mixture model in Fraley & Raftery (Reference Fraley and Raftery2002), the class membership variable $\mathbf {Z}_i = (Z_{i1}, \ldots , Z_{iL})$
is introduced as the unobserved portion of the data, where,
$\mathbf {Z}_i = (Z_{i1}, \ldots , Z_{iL})$
is introduced as the unobserved portion of the data, where,
 $$ \begin{align} Z_{il} = \begin{cases} 1, & \text{if}\ \Omega_i = l, \\ 0, & \text{otherwise}. \end{cases} \end{align} $$
The conditional distribution of ( $Y_i, \mathbf {M}_{\kappa , i}, X_i$
) given
$Y_i, \mathbf {M}_{\kappa , i}, X_i$
) given $\mathbf {Z}_i$
is
$\mathbf {Z}_i$
is
 $$ \begin{align} \prod_{l = 1}^{L} [ P(\Omega_i = l \mid g_i, x_i, \beta_{0l}, \beta_{1l}, \xi_l) P(Y_i \mid g_i, x_i, \gamma, \alpha_l, \zeta) P(\mathbf{M}_{\kappa, i} \mid {\boldsymbol{\mu}}_l, {\boldsymbol{\Sigma}}_l) ] ^{Z_{il}}. \end{align} $$
The log-likelihood of the parameters given the complete data ![]() is,
is,

The initial class memberships in the EM algorithm are obtained by fitting the hierarchical agglomeration clustering analysis (Murtagh & Legendre, Reference Murtagh and Legendre2014). The algorithm iterates the E-step and the M-step described below until a convergence criterion has been reached.
2.3.1 E-step
In the E-step, class membership probabilities, $\hat {Z}_{il}$
s, are estimated for
$\hat {Z}_{il}$
s, are estimated for $i = 1, \ldots , N$
and
$i = 1, \ldots , N$
and $l = 1, \ldots , L$
in the rth iteration by
$l = 1, \ldots , L$
in the rth iteration by
 $$ \begin{align} \hat{Z}_{il, r} = \frac {P(\Omega_i = l \mid g_i, x_i, \beta_{0l, r - 1}, \beta_{1l, r - 1}, \xi_{l, r - 1}) P(Y_i, \mathbf{M}_{\kappa, i} \mid g_i, x_i, {\boldsymbol{\mu}}_{l, r - 1}, {\boldsymbol{\Sigma}}_{l, r - 1}, \gamma_{r - 1}, \alpha_{l, r - 1}, \zeta_{l, r - 1})} {\sum_{d = 1}^{L} P(\Omega_i = d \mid g_i, x_i, \beta_{0d, r - 1}, \beta_{1d, r - 1}, \xi_{d, r - 1}) P(Y_i, \mathbf{M}_{\kappa, i} \mid g_i, x_i, {\boldsymbol{\mu}}_{d, r - 1}, {\boldsymbol{\Sigma}}_{d, r - 1}, \gamma_{r - 1}, \alpha_{d, r - 1}, \zeta_{r - 1})}. \end{align} $$
2.3.2 M-step
In the M-step, we update the parameters, ![]() , and
, and $\boldsymbol {\xi }$
by maximizing the expected complete data log-likelihood computed with the estimates
$\boldsymbol {\xi }$
by maximizing the expected complete data log-likelihood computed with the estimates $\hat {\mathbf {Z}}_{1, r},\ldots , \hat {\mathbf {Z}}_{n, r}$
. For updating
$\hat {\mathbf {Z}}_{1, r},\ldots , \hat {\mathbf {Z}}_{n, r}$
. For updating $\boldsymbol {\beta }$
and
$\boldsymbol {\beta }$
and $\boldsymbol {\xi }$
, we set the first latent class as the baseline reference level for identifiability, and
$\boldsymbol {\xi }$
, we set the first latent class as the baseline reference level for identifiability, and
 $$ \begin{align} \text{log}\ \frac{P(\Omega_i = l)}{P(\Omega_i = 1)} = \beta_{0l} + g_i \beta_{1l} + x_i \xi_{l} \;\;\;\; \forall \ l \in \{2,\ldots, L\}, \end{align} $$
where $\beta _{11} = \xi _1 = 0$
. The
$\beta _{11} = \xi _1 = 0$
. The $\boldsymbol {\beta }$
and the
$\boldsymbol {\beta }$
and the $\boldsymbol {\xi }$
are updated with the estimates from the multinomial logistic regression model by maximizing
$\boldsymbol {\xi }$
are updated with the estimates from the multinomial logistic regression model by maximizing
 $$ \begin{align} \sum_{i = 1}^{N} \sum_{l = 1}^{L} {\hat{Z}_{il} [ \text{log}\ P(\Omega_i = l \mid g_i, x_i, \beta_{0l}, \beta_{1l}, \xi_l) ] }. \end{align} $$
Similarly, $\boldsymbol {\alpha }$
,
$\boldsymbol {\alpha }$
, $\gamma $
, and
$\gamma $
, and $\zeta $
are updated by maximizing the following term
$\zeta $
are updated by maximizing the following term
 $$ \begin{align} \sum_{i = 1}^{N} \sum_{l = 1}^{L} {\hat{Z}_{il} [\text{log}\ P(Y_i, \mathbf{M}_{\kappa, i} \mid g_i, {\boldsymbol{\mu}}_l, {\boldsymbol{\Sigma}}_l, \gamma, \alpha_l) ]. } \end{align} $$
The closed-form solutions to Equations (14) and (15) are unavailable, so a quasi-Newton method (BFGS; Broyden, Reference Broyden1970; Fletcher, Reference Fletcher1970; Goldfarb, Reference Goldfarb1970; Shanno, Reference Shanno1970) was used to update $\boldsymbol {\beta }, \boldsymbol {\xi }, \boldsymbol {\alpha }, \gamma $
, and
$\boldsymbol {\beta }, \boldsymbol {\xi }, \boldsymbol {\alpha }, \gamma $
, and $\zeta $
.
$\zeta $
.
The class-specific means on the process features, $\boldsymbol \mu _l$
s, have closed-form expressions from the E-step as
$\boldsymbol \mu _l$
s, have closed-form expressions from the E-step as
 $$ \begin{align} {\boldsymbol{\mu}}_l = \frac{\sum_{i=1}^{n} \hat{Z}_{il} \mathbf{M}_{\kappa, i}}{n_l}, \end{align} $$
where $n_l = \sum _{i=1}^{n} \hat {Z}_{il}$
. For updating the covariance matrix
$n_l = \sum _{i=1}^{n} \hat {Z}_{il}$
. For updating the covariance matrix ${\boldsymbol {\Sigma }}_{l} = \lambda _l \mathbf {B}$
, we use the approach described in Celeux & Govaert (Reference Celeux and Govaert1995). The scattering matrix
${\boldsymbol {\Sigma }}_{l} = \lambda _l \mathbf {B}$
, we use the approach described in Celeux & Govaert (Reference Celeux and Govaert1995). The scattering matrix $\mathbf {W}_l$
of a class is
$\mathbf {W}_l$
of a class is
 $$ \begin{align} \mathbf{W}_l = \sum_{i = 1}^{n} \hat{Z}_{il} (\mathbf{M}_{\kappa, i} - \overline{\mathbf{M}}_{\kappa}) (\mathbf{M}_{\kappa, i} - \overline{\mathbf{M}}_{\kappa})^T. \end{align} $$
We update $\lambda _l$
and
$\lambda _l$
and $\mathbf {B}$
by minimizing
$\mathbf {B}$
by minimizing
 $$ \begin{align} \sum_{l = 1}^{L} \frac{1}{\lambda_l} tr(\mathbf{W}_l \mathbf{B}^{-1}) + d \sum_{l = 1}^{L} n_l \text{ln} (\lambda_l). \end{align} $$
The minimization of (18) requires an iterative procedure.
 $$ \begin{align} \lambda_l &= \frac{tr(\mathbf{W}_l \mathbf{B}^{-1})}{d n_l}, \nonumber\\ \mathbf{B} &= \frac{\text{diag} (\sum_{l=1}^{L} \frac{1}{\lambda_l} \mathbf{W}_l)}{\mid \sum_{l=1}^{L} \frac{1}{\lambda_l} \mathbf{W}_l \mid ^{\frac{1}{d}}}, \end{align} $$
where d is the dimension of the relevant process features $\mathbf M_{\kappa }$
. The E-step and the M-step are iterated until a termination criterion has been reached. Parameter estimates from the last iteration are used as the final estimates. For each examinee, the latent class memberships can be estimated via the maximum a posteriori probability (MAP).
$\mathbf M_{\kappa }$
. The E-step and the M-step are iterated until a termination criterion has been reached. Parameter estimates from the last iteration are used as the final estimates. For each examinee, the latent class memberships can be estimated via the maximum a posteriori probability (MAP).
 $$ \begin{align} \hat{\Omega}_i = \operatorname*{\mbox{arg max}}_l{\hat{Z}_{il.}} \end{align} $$
2.4 Assessing direct and indirect effect
To quantify the amount of information in the outcome explained by the group membership through the latent class mediator, we adopt the assessment of direct and indirect effects with a nominal mediator described in Muthén (Reference Muthén2011). Although intended as an exploratory tool, this model assumes no unmeasured confounding among the predictor, mediator, and outcome, as is standard in causal inference frameworks. Let $Y(g, \omega )$
denote the potential outcome that would have been observed if the group membership was g and the latent class membership was
$Y(g, \omega )$
denote the potential outcome that would have been observed if the group membership was g and the latent class membership was $\omega $
for an examinee. The conditional expectation of the outcome Y in group g, when the latent class mediator
$\omega $
for an examinee. The conditional expectation of the outcome Y in group g, when the latent class mediator $\Omega $
is held constant at the value it would obtain for group
$\Omega $
is held constant at the value it would obtain for group $g'$
, controlling for the covariate X, is
$g'$
, controlling for the covariate X, is
 $$ \begin{align} E[Y(g, \Omega(g')) \mid X = 0] = \sum_{l = 1}^L \{E(Y \mid G = g, \Omega = l) \times P(\Omega = l \mid G=g') \mid X = 0\}. \end{align} $$
The DE and the TIE are defined as follows:
 $$ \begin{align} DE &= E[Y(1, \Omega(0)) - Y(0, \Omega(0)) \mid X = 0]; \nonumber\\ TIE &= E[Y(1, \Omega(1)) - Y(1, \Omega(0)) \mid X = 0]. \end{align} $$
The TIE is interpreted as the expectation of the difference between the outcome in the focal group ( $G = 1$
) when the mediator changes from the values it would obtain in the focal group to the values it would obtain in the reference group (
$G = 1$
) when the mediator changes from the values it would obtain in the focal group to the values it would obtain in the reference group ( $G = 0$
). For example, in the context of the NAEP Math Assessment data, the TIE can be interpreted as the expected difference in the probability of a correct response for LD students when their latent class membership shifts from the class it would take in the LD group to the class it would take in the TD group. The TIE and DE can be estimated with the latent class mediation model parameter estimates. The sum of the DE and the total indirect effect is equal to the total effect,
$G = 0$
). For example, in the context of the NAEP Math Assessment data, the TIE can be interpreted as the expected difference in the probability of a correct response for LD students when their latent class membership shifts from the class it would take in the LD group to the class it would take in the TD group. The TIE and DE can be estimated with the latent class mediation model parameter estimates. The sum of the DE and the total indirect effect is equal to the total effect, $TE = E[Y(1, \Omega (1)) - Y(0, \Omega (0)) \mid X = 0]$
.
$TE = E[Y(1, \Omega (1)) - Y(0, \Omega (0)) \mid X = 0]$
.
 $$ \begin{align} DE &= \sum_{l = 1}^L [P(Y = 1 \mid G = 1, \Omega = l)P(\Omega = l \mid G = 0) - P(Y = 1 \mid G = 0, \Omega = l)P(\Omega = l \mid G = 0)] \nonumber\\ &= \sum_{l = 1}^L \Big\{ \big( \frac{e^{\alpha_l + \gamma}}{1 + e^{\alpha_l + \gamma}} - \frac{e^{\alpha_l}}{1 + e^{\alpha_l}} \big) \frac{e^{\beta_{0 \omega}}}{\sum_{d=1}^{L}e^{\beta_{0d}}} \Big\}, \nonumber\\ TIE &= \sum_{l = 1}^L [P(Y = 1 \mid G = 1, \Omega = l)P(\Omega = l \mid G = 1) - P(Y = 1 \mid G = 1, \Omega = l)P(\Omega = l \mid G = 0)] \nonumber\\ &= \sum_{l = 1}^L \Big\{ \frac{e^{\alpha_l + \gamma}}{1 + e^{\alpha_l + \gamma}} \big( \frac{e^{\beta_{0 \omega} + \beta_{1 \omega}}}{\sum_{d=1}^{L}e^{\beta_{0d} + \beta_{1d}}} - \frac{e^{\beta_{0 \omega}}}{\sum_{d=1}^{L}e^{\beta_{0d}}} \big) \Big\}. \end{align} $$
Testing of the TIE is available by constructing confidence intervals using the delta method (Sint et al., Reference Sint, Rosenheck and Lin2021) or bootstrap resampling (Muthén, Reference Muthén2011). The approximation of the standard error of TIE using the delta method is described in Appendix B.
3 Headlong search algorithm for feature selection
The process features are high-dimensional and may contain noisy information irrelevant to the relationship between the observed group and the final outcome. We implement a headlong search algorithm to find the optimal subset of process features that maximizes the TIE. Let $\mathbf {M}$
be the set of all K process features. The algorithm starts with an initial subset of process features and iteratively updates the subset (denoted
$\mathbf {M}$
be the set of all K process features. The algorithm starts with an initial subset of process features and iteratively updates the subset (denoted $\kappa \subseteq \{1,\ldots , K\}$
), to find an optimal subset
$\kappa \subseteq \{1,\ldots , K\}$
), to find an optimal subset $\kappa ^*$
such that the LCMA model with process features
$\kappa ^*$
such that the LCMA model with process features $\mathbf M_{\kappa ^*}$
maximizes the TIE.
$\mathbf M_{\kappa ^*}$
maximizes the TIE.
3.1 Feature subset initialization
We first fit the latent class analysis (LCA) model using all K process features as indicators from Equation (2). The number of latent classes $L_{full}$
is selected using the BIC in Equation (6). Then, we fit a latent class model with a single indicator for each feature in
$L_{full}$
is selected using the BIC in Equation (6). Then, we fit a latent class model with a single indicator for each feature in $\mathbf {M}$
with the fixed
$\mathbf {M}$
with the fixed $L_{full}$
. The average variance of class probability estimates across individuals is calculated, where the class probability estimates
$L_{full}$
. The average variance of class probability estimates across individuals is calculated, where the class probability estimates $\hat {Z}_{il}$
are calculated in the E-step of the EM algorithm from the single indicator LCA model estimates. The larger the average class probability variance, the indicator gives a better separation of the classes. Similar to the approach in Dean & Raftery (Reference Dean and Raftery2010), we select
$\hat {Z}_{il}$
are calculated in the E-step of the EM algorithm from the single indicator LCA model estimates. The larger the average class probability variance, the indicator gives a better separation of the classes. Similar to the approach in Dean & Raftery (Reference Dean and Raftery2010), we select $L_{full} $
-
$L_{full} $
- $ 1$
features with the largest variance of class probabilities as the initial set. Here,
$ 1$
features with the largest variance of class probabilities as the initial set. Here, $L $
-
$L $
- $ 1$
is the maximum number of features needed to identify L latent classes by their locations. With the initial set of features, the latent class mediation model is fit using the current subset,
$ 1$
is the maximum number of features needed to identify L latent classes by their locations. With the initial set of features, the latent class mediation model is fit using the current subset, $\mathbf {M}_{\kappa }$
, the group membership variable, G, and the outcome, Y. After selecting the initial set of features, we proceed with the inclusion and exclusion steps of the headlong search algorithm.
$\mathbf {M}_{\kappa }$
, the group membership variable, G, and the outcome, Y. After selecting the initial set of features, we proceed with the inclusion and exclusion steps of the headlong search algorithm.
3.2 Inclusion step
At any iteration, let $\mathbf {M}_{\kappa }$
be the subcolumns of
$\mathbf {M}_{\kappa }$
be the subcolumns of $\mathbf {M}$
currently included in the model, and let
$\mathbf {M}$
currently included in the model, and let $\mathbf {M}_{-\kappa }$
be the remaining columns of
$\mathbf {M}_{-\kappa }$
be the remaining columns of $\mathbf {M}$
not included in the model. The logic of the inclusion and exclusion steps is that if including a feature in
$\mathbf {M}$
not included in the model. The logic of the inclusion and exclusion steps is that if including a feature in $\mathbf {M}_{-\kappa }$
or excluding a feature from
$\mathbf {M}_{-\kappa }$
or excluding a feature from $\mathbf {M}_{\kappa }$
increases the TIE significantly, then we can add or exclude that feature. In the inclusion step, each process feature in
$\mathbf {M}_{\kappa }$
increases the TIE significantly, then we can add or exclude that feature. In the inclusion step, each process feature in $\mathbf {M}_{-\kappa }$
is a candidate feature. For each candidate feature, the latent class mediation model is fit after adding the feature to
$\mathbf {M}_{-\kappa }$
is a candidate feature. For each candidate feature, the latent class mediation model is fit after adding the feature to $\mathbf {M}_{\kappa }$
. The number of latent classes is determined by selecting the LCA model with the highest BIC. We test if the absolute value of TIE increases significantly after adding the candidate feature by examining whether the
$\mathbf {M}_{\kappa }$
. The number of latent classes is determined by selecting the LCA model with the highest BIC. We test if the absolute value of TIE increases significantly after adding the candidate feature by examining whether the $95$
% confidence interval includes the TIE estimate from the previous subset. The feature that increases the TIE most is added to the current set,
$95$
% confidence interval includes the TIE estimate from the previous subset. The feature that increases the TIE most is added to the current set, $\mathbf {M}_{\kappa }$
, if the increase in TIE is significant. If none of the features increase the TIE significantly when added to the current set, we do not add any feature to
$\mathbf {M}_{\kappa }$
, if the increase in TIE is significant. If none of the features increase the TIE significantly when added to the current set, we do not add any feature to $\mathbf {M}_{\kappa }$
.
$\mathbf {M}_{\kappa }$
.
3.3 Exclusion step
In the exclusion step, the features in $\mathbf {M}_{\kappa }$
are examined. For each feature in
$\mathbf {M}_{\kappa }$
are examined. For each feature in $\mathbf {M}_{\kappa }$
, the latent class mediation model is fit after removing that feature from
$\mathbf {M}_{\kappa }$
, the latent class mediation model is fit after removing that feature from $\mathbf {M}_{\kappa }$
. The number of latent classes is determined by selecting the LCA model with the highest BIC. The feature that leads to the largest increase in TIE when removed is excluded from
$\mathbf {M}_{\kappa }$
. The number of latent classes is determined by selecting the LCA model with the highest BIC. The feature that leads to the largest increase in TIE when removed is excluded from $\mathbf {M}_{\kappa }$
if the
$\mathbf {M}_{\kappa }$
if the $95\%$
confidence interval of the TIE does not contain the TIE estimate from the previous step. If none of the features contribute to a significant increase in TIE when removed from the current set, we do not remove any feature from
$95\%$
confidence interval of the TIE does not contain the TIE estimate from the previous step. If none of the features contribute to a significant increase in TIE when removed from the current set, we do not remove any feature from $\mathbf {M}_{\kappa }$
. If there is no change after a round of inclusion and exclusion steps, the feature set is finalized as
$\mathbf {M}_{\kappa }$
. If there is no change after a round of inclusion and exclusion steps, the feature set is finalized as $\mathbf {M}_{\kappa ^*}$
, and the finalized latent class mediation model is fit.
$\mathbf {M}_{\kappa ^*}$
, and the finalized latent class mediation model is fit.
The proposed LCMA procedure using process data is summarized in Algorithm 1.

4 Simulation study
Simulation studies are conducted to examine whether the proposed procedure selects the signal indicators that effectively explain the mediation effect and accurately estimates the total indirect effect.
4.1 Data generation
Random samples with $N = 500$
sample size,
$N = 500$
sample size, $L = 4$
latent classes,
$L = 4$
latent classes, $K = 10$
indicators, and binary final outcome Y were generated under a latent class mediation model given the binary group membership G generated from a Bernoulli distribution with
$K = 10$
indicators, and binary final outcome Y were generated under a latent class mediation model given the binary group membership G generated from a Bernoulli distribution with $p = 0.5$
. The numbers of signal indicators were
$p = 0.5$
. The numbers of signal indicators were $S = 5, 3, 1$
. The noisy indicators were randomly generated independently of the true latent class membership. Thus, the noisy indicators do not contribute to the classification of subjects into latent classes, and they are irrelevant to the relationship between the predictor G and the outcome Y. Figure 3 presents the true mean structure of the
$S = 5, 3, 1$
. The noisy indicators were randomly generated independently of the true latent class membership. Thus, the noisy indicators do not contribute to the classification of subjects into latent classes, and they are irrelevant to the relationship between the predictor G and the outcome Y. Figure 3 presents the true mean structure of the $10$
indicators conditioned on the four latent classes, where each column represents a latent class. The first S rows are the mean vectors of the signal indicators. In Figure 4, the distributions of latent classes from one of the simulated data sets are presented on a two-dimensional space using the first two indicators to summarise the simulation conditions. In the
$10$
indicators conditioned on the four latent classes, where each column represents a latent class. The first S rows are the mean vectors of the signal indicators. In Figure 4, the distributions of latent classes from one of the simulated data sets are presented on a two-dimensional space using the first two indicators to summarise the simulation conditions. In the $S = 5$
condition, at least three of the signal variables need to be selected to identify the four latent classes by location. In the
$S = 5$
condition, at least three of the signal variables need to be selected to identify the four latent classes by location. In the $S = 3$
condition, all the signal variables must be selected to identify the four latent classes correctly. In the
$S = 3$
condition, all the signal variables must be selected to identify the four latent classes correctly. In the $S = 1$
condition, the first variable (
$S = 1$
condition, the first variable ( $M1$
) is the only indicator we need to identify the four true latent classes. Two levels of class-specific variances were considered,
$M1$
) is the only indicator we need to identify the four true latent classes. Two levels of class-specific variances were considered, $VAR = 1$
and
$VAR = 1$
and $VAR = 3$
, to control the level of overlap, that is, how much the latent classes can intersect. Overlapping true latent classes can lead to the misclassification of individuals. In the
$VAR = 3$
, to control the level of overlap, that is, how much the latent classes can intersect. Overlapping true latent classes can lead to the misclassification of individuals. In the $VAR = 1$
condition, the latent classes do not overlap, whereas in the
$VAR = 1$
condition, the latent classes do not overlap, whereas in the $VAR = 3$
condition, the latent classes do overlap, allowing the misclassification of individuals. The true TIE and DE were set to
$VAR = 3$
condition, the latent classes do overlap, allowing the misclassification of individuals. The true TIE and DE were set to $-$
0.125 and
$-$
0.125 and $0$
. The true model parameter values are described in Appendix C. The number of replications in each condition was
$0$
. The true model parameter values are described in Appendix C. The number of replications in each condition was $R = 100$
. The R codes used for the simulation can be found on the Open Science Framework (OSF) at https://osf.io/a5zem/?view_only=983859876f2547bb977e02e5dfef6a3d.
$R = 100$
. The R codes used for the simulation can be found on the Open Science Framework (OSF) at https://osf.io/a5zem/?view_only=983859876f2547bb977e02e5dfef6a3d.
True mean structures in the simulation study.
Note: The columns represent the four latent classes, and the rows represent the ten indicators. The first S rows are the signal indicators, and the rest are the noisy indicators.

Scatter plots of simulated indicators from the simulation conditions.

4.2 Simulation results
The bias, RMSE, and the $95$
% coverage rate of the TIE are given in Table 2. The bias and RMSE of TIE were calculated as follows:
$95$
% coverage rate of the TIE are given in Table 2. The bias and RMSE of TIE were calculated as follows:
 $$ \begin{align} Bias &= \sum_{r = 1}^{R} \frac{\widehat{TIE}_{r} - TIE}{R}; \nonumber\\ RMSE &= \sqrt{\sum_{r = 1}^R\frac{(\widehat{TIE}_r - TIE)^2}{R}}. \end{align} $$ $\widehat {TIE}_{r}$
is the TIE estimate calculated based on the model parameter estimates in the rth replication, and TIE is the true TIE. The proposed LCMA procedure recovered the TIE of the latent class mediator well, although the TIE was slightly overestimated. The magnitude of the bias slightly increased in the
$\widehat {TIE}_{r}$
is the TIE estimate calculated based on the model parameter estimates in the rth replication, and TIE is the true TIE. The proposed LCMA procedure recovered the TIE of the latent class mediator well, although the TIE was slightly overestimated. The magnitude of the bias slightly increased in the $VAR = 3$
conditions, where the latent classes were allowed to overlap. However, the bias of TIE is negligible as the relative biases were less than
$VAR = 3$
conditions, where the latent classes were allowed to overlap. However, the bias of TIE is negligible as the relative biases were less than $0.1$
except for conditions 4 and 5. Further, we found that the bias of model parameter estimates decreased as the sample size increased in an additional simulation (Table D1). The
$0.1$
except for conditions 4 and 5. Further, we found that the bias of model parameter estimates decreased as the sample size increased in an additional simulation (Table D1). The $95$
% coverage rate was computed using
$95$
% coverage rate was computed using $95$
% confidence intervals constructed from standard error estimates derived via the delta method.
$95$
% confidence intervals constructed from standard error estimates derived via the delta method.
 $$ \begin{align} 95\% ~ C.R. (TIE) = \sum_{r = 1}^{R} \frac{I_{TIE \in (\widehat{TIE}_{L, r}, \widehat{TIE}_{U, r})}}{R}. \end{align} $$ $\widehat {TIE}_{L, r}$
and
$\widehat {TIE}_{L, r}$
and $\widehat {TIE}_{U, r}$
are the lower bound and the upper bound of the
$\widehat {TIE}_{U, r}$
are the lower bound and the upper bound of the $95\%$
confidence interval, and I is the indicator function. The coverage rates of TIE were acceptable, ranging from
$95\%$
confidence interval, and I is the indicator function. The coverage rates of TIE were acceptable, ranging from $0.90$
to
$0.90$
to $0.94$
in the non-overlapping classes conditions and from
$0.94$
in the non-overlapping classes conditions and from $0.74$
to
$0.74$
to $0.93$
in the overlapping classes conditions.
$0.93$
in the overlapping classes conditions.
Simulation study results

Note: 95% C.R. is the 95% coverage rate.
Throughout the simulation conditions, the selected number of classes was close to the true number of classes, $L = 4$
, ranging from
$L = 4$
, ranging from $3.50$
to
$3.50$
to $4.32$
(Table 2). The classification accuracy of the proposed analysis was evaluated using the average adjusted Rand index (ARI; Hubert & Arabie, Reference Hubert and Arabie1985) between the estimated class and the true class. ARI measures the agreement of the two classifications when the number of classes does not necessarily match. ARI close to
$4.32$
(Table 2). The classification accuracy of the proposed analysis was evaluated using the average adjusted Rand index (ARI; Hubert & Arabie, Reference Hubert and Arabie1985) between the estimated class and the true class. ARI measures the agreement of the two classifications when the number of classes does not necessarily match. ARI close to $1$
indicates perfect agreement with the true classification, and ARI close to
$1$
indicates perfect agreement with the true classification, and ARI close to $0$
indicates random classification. The formula of the ARI is given as follows. Let
$0$
indicates random classification. The formula of the ARI is given as follows. Let $n_{ij}$
be the number of individuals in class i classified into the jth class.
$n_{ij}$
be the number of individuals in class i classified into the jth class. $L = 4$
is the number of true classes, and
$L = 4$
is the number of true classes, and $\hat {L}$
is the number of classes in the latent class mediation model. Then,
$\hat {L}$
is the number of classes in the latent class mediation model. Then,
 $$ \begin{align} ARI = \frac{\sum_{i = 1}^{L} \sum_{j = 1}^{\hat{L}} {n_{ij} \choose 2} - [\sum_i {n_{i.} \choose 2} \sum_j {n_{.j} \choose 2}] / {n \choose 2}}{ \frac{1}{2} [\sum_i {n_{i.} \choose 2} \sum_j {n_{.j} \choose 2}] - [\sum_i {n_{i.} \choose 2} \sum_j {n_{.j} \choose 2}] / {n \choose 2}}, \end{align} $$
where $n_{i.} = \sum _{j}^{\hat {L}} n_{ij}$
,
$n_{i.} = \sum _{j}^{\hat {L}} n_{ij}$
, $n_{.j} = \sum _{i}^{L} n_{ij}$
, and
$n_{.j} = \sum _{i}^{L} n_{ij}$
, and $n = \sum _{i}^{L} \sum _{j}^{\hat {L}} n_{ij}$
. In the simulation conditions, the average ARI values were greater than
$n = \sum _{i}^{L} \sum _{j}^{\hat {L}} n_{ij}$
. In the simulation conditions, the average ARI values were greater than $0.8$
, indicating an accurate classification of the proposed analysis. The ARI values were greater in the non-overlapping (
$0.8$
, indicating an accurate classification of the proposed analysis. The ARI values were greater in the non-overlapping ( $VAR = 1$
) condition (
$VAR = 1$
) condition ( $0.91 \sim 0.96$
) than the overlapping (
$0.91 \sim 0.96$
) than the overlapping ( $VAR = 3$
) condition (
$VAR = 3$
) condition ( $0.80 \sim 0.88$
).
$0.80 \sim 0.88$
).
The variable selection algorithm performed well under the simulation conditions. In Table 2, the sixth column shows the average number of indicators selected in each condition. When three signal indicators were needed to identify the four true latent classes (i.e., conditions 1, 2, 4, and 5), slightly more than three variables were selected. When the first indicator was the only signal indicator (i.e., conditions 3 and 6), $2.37$
and
$2.37$
and $1.89$
indicators were selected on average in the final model. The seventh and eighth columns in Table 2 show the false positive (FP) rate and the true positive (TP) rate of selecting the indicator. The false positive rate is calculated as the probability of selecting a noisy indicator, and the true positive rate is calculated as the probability of selecting a signal indicator.
$1.89$
indicators were selected on average in the final model. The seventh and eighth columns in Table 2 show the false positive (FP) rate and the true positive (TP) rate of selecting the indicator. The false positive rate is calculated as the probability of selecting a noisy indicator, and the true positive rate is calculated as the probability of selecting a signal indicator.
 $$ \begin{align} FP &= \sum_{r = 1}^{R} \sum_{j = S + 1}^{K} \frac{I_{ M_{j} \in \mathbf{M}^{r}_{\kappa^*} }}{R (K - S)}. \nonumber\\ TP &= \sum_{r = 1}^{R} \sum_{j = 1}^S \frac{I_{ M_{j} \in \mathbf{M}^{r}_{\kappa^*} }}{R S}. \end{align} $$ $\mathbf {M}^{r}_{\kappa ^*}$
is the set of indicators selected in the final model in the rth replication. The variable selection algorithm controlled the false positive rate reasonably, ranging from
$\mathbf {M}^{r}_{\kappa ^*}$
is the set of indicators selected in the final model in the rth replication. The variable selection algorithm controlled the false positive rate reasonably, ranging from $0.06$
to
$0.06$
to $0.15$
. In the
$0.15$
. In the $S = 5$
conditions, the true positive rate was
$S = 5$
conditions, the true positive rate was $0.58$
and
$0.58$
and $0.60$
, which means about 60% of the first five signal variables were selected, which suffices to identify the four true latent classes. In the
$0.60$
, which means about 60% of the first five signal variables were selected, which suffices to identify the four true latent classes. In the $S = 3$
conditions, most of the three signal indicators were selected with the true positive rates of
$S = 3$
conditions, most of the three signal indicators were selected with the true positive rates of $0.91$
and
$0.91$
and $0.86$
. In the
$0.86$
. In the $S = 1$
condition, the sole signal indicator was always selected in the final model with
$S = 1$
condition, the sole signal indicator was always selected in the final model with $1.00$
true positive rate.
$1.00$
true positive rate.
We conducted additional simulations to evaluate the accuracy of parameter estimates given the true number of latent classes, L. The EM algorithm for the LCMA model performed well, exhibiting low bias and RMSE in the parameter estimates. Additionally, we assessed the proposed algorithm’s performance under alternative data-generating models. The algorithm showed robust performance across various scenarios in terms of both variable selection and parameter estimation. Further details about the simulation methods and results are provided in Appendices D and E.
5 NAEP Math Assessment data analysis results
The LCMA was applied to the empirical data from the motivating example. To start, we fit a simple logistic regression predicting the final outcome $Y \in \{0,1\}$
with the disability group membership G, without any mediator. The log odds of correct response were
$Y \in \{0,1\}$
with the disability group membership G, without any mediator. The log odds of correct response were $1.25$
lower in the LD group than in the TD group,
$1.25$
lower in the LD group than in the TD group,
 $$ \begin{align} logit P(Y = 1 | G) = -0.05 - 1.25 G. \end{align} $$
Without any mediators, the total effect of the group membership on the final outcome was $-$
0.273, calculated as follows:
$-$
0.273, calculated as follows:
 $$ \begin{align} TE = E(Y|G = 1) - E(Y|G = 0). \end{align} $$
Then, the proposed LCMA procedure is applied to the empirical data. Specifically, in the current context, the LCMA aims to address the following research questions (RQs):
-
RQ1 What are the latent classes ( $\Omega $
) of action sequence patterns that explain the relationship between disability group (G) and outcome (Y)? In other words, we search for
$\Omega $
underlying M in Equations 3–4.
$\Omega $
) of action sequence patterns that explain the relationship between disability group (G) and outcome (Y)? In other words, we search for
$\Omega $
underlying M in Equations 3–4. -
RQ2 What subset of action sequence features (
$\mathbf M_\kappa , \kappa \subseteq \{1,\ldots , K\}$
) can best account for the effect of disability group on the outcome? In other words, we search for
$\kappa ^* = \operatorname *{\mbox {arg max}}_\kappa {TIE}$
in Equations 22–23. -
RQ3 How much of the group difference in final outcome can be explained by the latent class mediator (
$\Omega $
) underlying problem-solving process features? In other words, we estimate and evaluate TIE in Equations 22–23.


The headlong search algorithm described previously was implemented to find the subset of indicators maximizing the TIE of the disability group membership on the final score through the process features. Out of the $K = 15$
MDS process features, the variable selection algorithm selected
$K = 15$
MDS process features, the variable selection algorithm selected $14$
indicators in the final model. The data analysis required approximately 31 hours with a sample size of
$14$
indicators in the final model. The data analysis required approximately 31 hours with a sample size of $N = 3090$
,
$N = 3090$
, $K = 15$
candidate features, and the maximum number of latent classes set to
$K = 15$
candidate features, and the maximum number of latent classes set to $L = 20$
. The selected number of latent classes was
$L = 20$
. The selected number of latent classes was $L = 18$
. After incorporating the latent class mediator, the TIE estimate was
$L = 18$
. After incorporating the latent class mediator, the TIE estimate was $\widehat {TIE} = -0.154$
, controlling for the ELL variable, with a 95% confidence interval of (
$\widehat {TIE} = -0.154$
, controlling for the ELL variable, with a 95% confidence interval of ( $-$
0.183,
$-$
0.183, $-$
0.125). This shows that the latent class variable underlying the selected process features could substantially explain the final score difference between LD and TD students, controlling for the ELL status to 0. To evaluate the reproducibility of our results, we randomly sampled 80% of the data four times and applied the proposed LCMA procedure to each subsample, examining the stability of both the TIE estimates and classification of students across the subsamples. Each subsample consisted of 470 LD students and 2000 TD students. The TIE estimates varied only slightly, from
$-$
0.125). This shows that the latent class variable underlying the selected process features could substantially explain the final score difference between LD and TD students, controlling for the ELL status to 0. To evaluate the reproducibility of our results, we randomly sampled 80% of the data four times and applied the proposed LCMA procedure to each subsample, examining the stability of both the TIE estimates and classification of students across the subsamples. Each subsample consisted of 470 LD students and 2000 TD students. The TIE estimates varied only slightly, from $-$
0.119 to
$-$
0.119 to $-$
0.157, across the four subsamples. While the optimal number of classes was 20 in these subsamples, the ARIs comparing classification from the total sample to those from the subsamples ranged from
$-$
0.157, across the four subsamples. While the optimal number of classes was 20 in these subsamples, the ARIs comparing classification from the total sample to those from the subsamples ranged from $0.963$
to
$0.963$
to $0.979$
indicating high consistency in the classification of students.
$0.979$
indicating high consistency in the classification of students.
To interpret and label the identified latent classes, we propose inspecting common patterns in the original action sequences of test takers within each class. Although a common approach involves describing classes based on their indicators (Spurk et al., Reference Spurk, Hirschi, Wang, Valero and Kauffeld2020), this can be challenging with MDS features, as the extracted feature values are often difficult to interpret. Analyzing the action sequence offers a clearer and more practical approach to understanding and labeling the latent classes underlying the process data. Table 3 presents a descriptive summary of common patterns in the original sequences for each class, along with their corresponding class labels. Marked in (h) are homogeneous classes with identical action sequences. For instance, the common action sequence for Class 2, labeled “Revisit for review, 735”, was (Part_1_735, Exit_Item, Enter_Item). This indicates that every student in this class entered an answer with the numbers 7, 3, and 5 and revisited the item page once. On the other hand, the common action sequence for Class 5, labeled “Omission of the first try,” was (Exit_Item, Enter_Item, Part_1_735). This indicates that every student in this class initially omitted the item and then submitted an answer with the numbers 7, 3, and 5 during their second visit to the item page. To interpret the non-homogeneous classes, we examined both the common actions within each class and the summary statistics provided in Table 3. For example, Class 1 was labeled as “Multiple revisits, no tools, 735”, and every student in this class revisited the item page multiple times while submitting an answer with the numbers 7, 3, and 5.
Tool usage rates of latent classes from the NAEP math assessment from the NAEP math assessment item VH336968

Note: No.: Number of students classified into each class (rounded to the nearest ten); Len.M: Average action sequence length; Len.SD: Standard deviation of action sequence length; Rev. Revisit; Avg.Rev.: Average number of revisits; Dra.: Draw; Era.: Erase; Cle.: Clear; E $\mid $
C: Erase or Clear; Hig.: Highlight; Zoo.: Zooming in/out; The.: Theme editor; TOS.: text-to-speech; Source: U.S. Department of Education, National Center for Education Statistics, “Response Process Data from the NAEP 2017 Grade 8 Mathematics Assessment.”
$\mid $
C: Erase or Clear; Hig.: Highlight; Zoo.: Zooming in/out; The.: Theme editor; TOS.: text-to-speech; Source: U.S. Department of Education, National Center for Education Statistics, “Response Process Data from the NAEP 2017 Grade 8 Mathematics Assessment.”
Table 4 shows the model-implied correct response probabilities, $P(Y = 1)$
, and class probabilities,
$P(Y = 1)$
, and class probabilities, $P(\Omega = l)$
, for LD and TD students, along with their (log) odds ratios and the raw differences in class probabilities. These probabilities are calculated based on the model parameter estimates related to the logistic regression in Equation 4,
$P(\Omega = l)$
, for LD and TD students, along with their (log) odds ratios and the raw differences in class probabilities. These probabilities are calculated based on the model parameter estimates related to the logistic regression in Equation 4, $\gamma $
and
$\gamma $
and $\boldsymbol {\alpha }$
, and the multinomial logistic regression in Equation 3,
$\boldsymbol {\alpha }$
, and the multinomial logistic regression in Equation 3, $\boldsymbol {\beta _0}$
and
$\boldsymbol {\beta _0}$
and $\boldsymbol {\beta _1}$
, controlling for the covariate. Note that after classifying students into the latent classes, the difference in the correct response probabilities within each class between LD and TD students has decreased. This also shows that the latent class variable can explain the performance gap between the two groups. Behaviors observed in classes 1 to 9 are associated with higher correct response probabilities compared to the marginal correct response probability, while behaviors common in classes 10 to 18 are associated with lower correct response probabilities.
$\boldsymbol {\beta _1}$
, controlling for the covariate. Note that after classifying students into the latent classes, the difference in the correct response probabilities within each class between LD and TD students has decreased. This also shows that the latent class variable can explain the performance gap between the two groups. Behaviors observed in classes 1 to 9 are associated with higher correct response probabilities compared to the marginal correct response probability, while behaviors common in classes 10 to 18 are associated with lower correct response probabilities.
Model implied response probabilities and class probabilities from the NAEP math assessment item VH336968

Note: $P(Y = 1)$
is the model implied correct response probability.
$P(Y = 1)$
is the model implied correct response probability. $P(\Omega = l)$
is the model implied probability of belonging to the l-th class. (h) indicates a homogeneous class with the same action sequence. OR: Model implied odds ratio of class probabilities for LD against TD; LOR: Log odds ratio; DIFF: Difference in class probabilities. Source: U.S. Department of Education, National Center for Education Statistics, “Response Process Data from the NAEP 2017 Grade 8 Mathematics Assessment.”
$P(\Omega = l)$
is the model implied probability of belonging to the l-th class. (h) indicates a homogeneous class with the same action sequence. OR: Model implied odds ratio of class probabilities for LD against TD; LOR: Log odds ratio; DIFF: Difference in class probabilities. Source: U.S. Department of Education, National Center for Education Statistics, “Response Process Data from the NAEP 2017 Grade 8 Mathematics Assessment.”
From Table 4, we identify the test-taking behaviors that contribute to the performance gaps between LD and TD students by focusing on the latent classes with substantial class probability $P(\Omega = l)$
differences in both the odds ratio and absolute difference scales. Since most class probabilities are small except for Classes 6 and 16, some absolute proportion differences are also small. The classes with higher correct response probabilities were Class 2 “Revisit for review, 735”, Class 4 “Draw_Clear”, Class 6 “No tools, 735”, and Class 7 “Single draw”. The class probability odds ratios for these classes were
$P(\Omega = l)$
differences in both the odds ratio and absolute difference scales. Since most class probabilities are small except for Classes 6 and 16, some absolute proportion differences are also small. The classes with higher correct response probabilities were Class 2 “Revisit for review, 735”, Class 4 “Draw_Clear”, Class 6 “No tools, 735”, and Class 7 “Single draw”. The class probability odds ratios for these classes were $0.33, 0.29, 0.44$
, and
$0.33, 0.29, 0.44$
, and $0.69$
, indicating that LD students were less likely to belong to these classes. Specifically, LD students were less likely to revisit the item for review and submit an answer with numbers 7, 3, and 5. Additionally, behaviors such as using scratchwork with a single draw stroke or clearing the scratchwork immediately after drawing led to higher correct response probabilities, yet LD students were less likely to display these behaviors. When using no tools, LD students were less likely to submit an answer containing 7, 3, and 5, suggesting they were more likely to make non-decimal point errors and demonstrate misconceptions in their responses. On the other hand, LD students were more likely to belong to the low-performing classes, Class 13 “Multiple revisits or reentries”, Class 15 “Draw_Erase or Draw_Clear, non-735”, and Class 16 “No tools, non-735”. The class probability odds ratios were
$0.69$
, indicating that LD students were less likely to belong to these classes. Specifically, LD students were less likely to revisit the item for review and submit an answer with numbers 7, 3, and 5. Additionally, behaviors such as using scratchwork with a single draw stroke or clearing the scratchwork immediately after drawing led to higher correct response probabilities, yet LD students were less likely to display these behaviors. When using no tools, LD students were less likely to submit an answer containing 7, 3, and 5, suggesting they were more likely to make non-decimal point errors and demonstrate misconceptions in their responses. On the other hand, LD students were more likely to belong to the low-performing classes, Class 13 “Multiple revisits or reentries”, Class 15 “Draw_Erase or Draw_Clear, non-735”, and Class 16 “No tools, non-735”. The class probability odds ratios were $2.46, 5.31$
, and
$2.46, 5.31$
, and $2.20$
, respectively. These results suggest that the behaviors associated with worse performance, and more commonly observed among LD students, include multiple revisits, a sequence of Draw and Erase or Clear with non-735 responses, and using no tools with non-735 responses.
$2.20$
, respectively. These results suggest that the behaviors associated with worse performance, and more commonly observed among LD students, include multiple revisits, a sequence of Draw and Erase or Clear with non-735 responses, and using no tools with non-735 responses.
These results show key differences in test-taking behaviors between LD and TD students, particularly in their use of scratchwork, item review, and response patterns for non-735 answers. TD students were more likely to engage in effective scratchwork strategies, such as making a single draw stroke, which were associated with higher correct response probabilities. In contrast, LD students tended to engage in unproductive behaviors like repeatedly revisiting or re-entering answers, which are associated with lower performance. Additionally, for students who submitted a non-735 answer, common incorrect responses such as $4.45, 8.5$
, and
$4.45, 8.5$
, and $29.4$
suggest deeper misconceptions about decimal multiplication. These answers could be derived by the following computations:
$29.4$
suggest deeper misconceptions about decimal multiplication. These answers could be derived by the following computations: $(4 \times 1) + (0.9 \times 0.5) = 4.45$
;
$(4 \times 1) + (0.9 \times 0.5) = 4.45$
; $(4 \times 1) + (9 \times 0.5) = 8.5$
; and
$(4 \times 1) + (9 \times 0.5) = 8.5$
; and $(4.9 \times 1) + (4.9 \times 5) = 29.4$
. Each of these errors goes beyond simple misplacement of the decimal point and indicates fundamental misunderstandings about multiplication rules in the context of decimals.
$(4.9 \times 1) + (4.9 \times 5) = 29.4$
. Each of these errors goes beyond simple misplacement of the decimal point and indicates fundamental misunderstandings about multiplication rules in the context of decimals.
In Figure 5, the global structure of the selected process features is displayed on a two-dimensional plot using the t-distributed stochastic neighborhood embedding (t-SNE; Van der Maaten & Hinton, Reference Van der Maaten and Hinton2008). The t-SNE is a popular dimension-reduction method for visualization that preserves the similarity between observations by considering the observation’s nearest neighbors. While Figure 5 displays a grouping of the 18 classes into distinct areas, some classes are less clearly separated. The homogeneous classes are displayed as single points, as these classes had identical feature values. Classes 11 and 10 were the most dispersed classes in the plot because students in these classes were randomly browsing the available tools and submitted various responses.
t-SNE plot of the selected process features from the NAEP math assessment item VH336968.
Source: U.S. Department of Education, National Center for Education Statistics, “Response Process Data from the NAEP 2017 Grade 8 Mathematics Assessment.”

6 Discussion
Process data collected in computerized testing preserves valuable information beyond the traditional response data. However, analyzing process data is challenging because of its unstructured format and noise, which hinders the use of traditional approaches developed for rectangular data. This study provides an approach to a traditionally challenging task with new but noisy process data. The proposed LCMA analysis procedure is a general statistical method that can be applied when the latent class variable underlying action sequences is assumed as the mediator between an observed predictor and an outcome. The latent class mediation model and the headlong search algorithm allow dimension reduction and noise elimination from the process features, enhancing the interpretability of the results.
The latent class analysis with continuous indicators, often called latent profile analysis or Gaussian mixture clustering, is extended to a LCMA. To the best of our knowledge, the current study is the first attempt to extend the latent class analysis assuming multivariate normality of the indicators into a latent class mediation model including both a covariate and a distill outcome to assess the mediation effect via nominal latent class variable. There are a few studies using a latent class mediator with continuous indicators. For example, Sint et al. (Reference Sint, Rosenheck and Lin2021) proposed a LCMA where the observed continuous indicator was specified as a generalized linear model, given the latent class. The limitation of such an approach is that the covariance structure of the indicators was not considered.
Process data from large-scale assessments can help understand why certain students are struggling, serving as a seminal guide to efforts on evidence-based strategies to improve educational equity. The proposed analysis can help educators design targeted treatments for specific subgroups. With the NAEP Math Assessment data, we showed that the proposed LCMA can identify the latent class variable that explains the performance gap on a multiplication item between the students with learning disability and the TD students. Each class was interpreted and labeled based on summary statistics, such as the tool usage rates of the students classified into each class. Then, calculating the model-implied correct response probabilities and class probabilities using the parameter estimates from the proposed model allowed us to attribute the performance gap between the two groups to the difference in test-taking behaviors. The key point is that identifying the latent classes underlying the features and examining how the two groups differ in their probabilities of belonging to each latent class allows us to explain the performance gap between the two groups.
Practical implications of the NAEP Math Assessment data analysis demonstrate the importance of identifying specific test-taking behaviors that led to performance gaps between LD and TD students. By focusing on behaviors such as revisiting questions and employing effective problem-solving strategies, educators can design targeted interventions to help LD students develop more effective test-taking habits and improve their overall performance. Additionally, grouping students based on their specific test-taking behaviors can allow teachers to provide more focused support and instruction to meet individual needs, and such strategies can help bridge the gap in academic performance between LD and TD students.
The current study implemented a simultaneous estimation method for the latent class mediation model using an EM algorithm. The proposed estimation method is justified by the simulation results as the model parameters were accurately estimated when the data was generated from the true model. In addition, Bolck et al. (Reference Bolck, Croon and Hagenaars2004) suggested that simultaneous estimation is viable in latent class analysis with continuous indicators when a distal outcome is predicted by the latent class variable. However, in the mediation analysis with a latent variable, variations of two-step and three-step estimation approaches with adjustments for classification errors may be available. In the context of LCMA with categorical indicators, Hsiao et al. (Reference Hsiao, Kruger, Lee Van Horn, Tofighi, MacKinnon and Witkiewitz2021) compared six different estimation methods, including variations of one-step, two-step, and three-step approaches. There is a demand for an investigation of the estimation in the LCMA with continuous indicators in various conditions.
A headlong search algorithm for feature selection is proposed. The objective of the feature selection algorithm is to find the subset of process features that maximizes the TIE. In the simulation, the proposed feature selection algorithm performed well in selecting the signal features while excluding the noisy features irrelevant to the true clustering. This approach aligns with the idea of the exploratory mediation analysis (van Kesteren & Oberski, Reference van Kesteren and Oberski2019) where a mediation filter was used to find the subset of many potential mediators to explain the effect of the predictor on the outcome. There is one caveat to the proposed feature selection algorithm. Each inclusion and exclusion step requires significance testing. As the number of iterations in the search algorithm increases, the family-wise type-1 error can be hard to control at a desired significance level. Therefore, family-wise type-1 error control methods proposed in step-wise variable selection, such as Bonferroni correction, may be considered. Or, considering different criteria, such as a decrease in the DE for selecting the initial set of features, may improve the reliability of the search algorithm. Another alternative could be implementing a search algorithm that does not rely on step-wise decisions.
We adopted the counterfactual approach (Pearl, Reference Pearl2010; Robins & Greenland, Reference Robins and Greenland1992) and the formal definitions of effects involving a latent class mediator described in Muthén (Reference Muthén2011) to assess the TIE of the nominal latent class mediator. The indirect effects defined in the counterfactual framework rely on several strict assumptions and are described in Imai et al. (Reference Imai, Keele and Tingley2010), Valeri & Vander Weele (Reference Valeri and Vander Weele2013), and Vander Weele & Vansteelandt (Reference Vander Weele and Vansteelandt2009). A part of the assumptions can be satisfied when the predictor is a randomized treatment. Other assumptions require that there is no unmeasured confounding variable of the predictor-outcome relationship and the mediator-outcome relationship. The effects of unmeasured confounding variables can be controlled by including them as covariates, as described previously. In observational research, however, including demographic variables such as learning disability status may still violate the randomized treatment assumption. The indirect effect estimates are biased when some of the assumptions are violated.
Importantly, we emphasize that the proposed framework is intended as an exploratory tool for generating hypotheses about causal relationships in complex process data, rather than for drawing causal claims about test-taking behavior. To advance from hypothesis generation to more robust causal statements, future work could integrate formal sensitivity analyses. For example, future studies could adopt bias-adjustment formulas for unmeasured confounding (Vander Weele & Arah, Reference Vander Weele and Arah2011), sensitivity analysis for causal mediation effects (Imai et al., Reference Imai, Keele and Yamamoto2010), or statistical methods for examining and adjusting for assumption violations (MacKinnon & Pirlott, Reference MacKinnon and Pirlott2015).
Complex latent-class models are susceptible to convergence at local optima, which can in turn affect BIC-based model selection. We initialize the EM algorithm via hierarchical agglomeration clustering, as implemented in the mclust R package (Scrucca et al., Reference Scrucca, Fraley, Murphy and Raftery2023), to optimize the chance of arriving at an accurate model solution. Nonetheless, future extensions could consider incorporating multiple-start EM runs, as implemented in Mplus (Muthén & Muthén, Reference Muthén and Muthén2017). It should also be noted that uncertainty in the BIC-based model selection could propagate to mediation effect estimates. Such unaddressed model selection variability may lead to underestimation of posterior uncertainty for indirect effect parameters. To address this, one can adopt fully Bayesian model approaches treating the number of latent classes as a random variable (see e.g., Chen et al., Reference Chen, Liu, Culpepper and Chen2021; Richardson & Green, Reference Richardson and Green1997; Stephens, Reference Stephens2000) or apply Bayesian model averaging over candidate models (see e.g., Hoeting et al., Reference Hoeting, Madigan, Raftery and Volinsky1999; Russell et al., Reference Russell, Murphy and Raftery2015; Wasserman, Reference Wasserman2000).
Other machine learning techniques can be used to extract process features from the unstructured action sequence data while preserving the information of the original data. The type of information kept in the process features will depend on the feature extraction method. For example, N-gram-based techniques could extract the frequencies of a sequence of actions (e.g., He & von Davier, Reference He and von Davier2016). One potential advantage of using N-gram-based features in latent class mediation modeling is that the selected features can be more interpretable. Each feature is related to the frequency of a certain action sequence. Therefore, the selected features can directly show the test-taking behavior that explains performance gaps between groups. However, the N-gram features are discrete variables, and the multivariate normality assumption of the proposed analysis may not hold. A future extension of this study could involve incorporating discrete features, such as count or binary data, into the proposed analysis framework. Another possible direction is extending the model to accommodate a multi-categorical group membership predictor by introducing $C - 1$
dummy variables with their corresponding regression coefficients, where C is the number of categories.
$C - 1$
dummy variables with their corresponding regression coefficients, where C is the number of categories.
Data availability statement
The data that support the findings of this study are available from the U. S. Department of Education, National Center for Education Statistics. Restrictions apply to the availability of these data, which were used under license for this study. The codes are available in the Open Science Framework (OSF) repository at https://osf.io/a5zem/?view_only=983859876f2547bb977e02e5dfef6a3d.
Funding statement
The research reported here was supported by the Institute of Education Sciences, U.S. Department of Education, through Grant R324P230002 to Digital Promise and the University of Illinois Urbana-Champaign. The opinions expressed are those of the authors and do not represent the views of the Institute or the U.S. Department of Education.
Appendix A MDS for action sequence data
MDS (Borg & Groenen, Reference Borg and Groenen2005) is a dimension reduction method that extracts latent features based on the pairwise dissimilarity measure between two observations. MDS is widely used for data visualization and in many areas of psychometrics (Takane, Reference Takane2006). The goal of MDS is to locate observations within a vector space based on their pairwise dissimilarities, ensuring that similar observations are located closely. In contrast, less similar ones are located farther apart. Tang et al. (Reference Tang, Wang, He, Liu and Ying2020) proposed using MDS for extracting process features from the problem-solving process data. In process data analysis, if dissimilarities effectively capture differences between two processes, the coordinates derived from MDS can serve as features containing information about the original processes (Tang et al., Reference Tang, Wang, He, Liu and Ying2020).
The dissimilarity measure between two action sequences takes into account the number of unique actions and the order of common actions (Gómez-Alonso & Valls, Reference Gómez-Alonso and Valls2008). Let $\mathbf {s}_i = (s_{i1}, \ldots , s_{iL_i})$
and
$\mathbf {s}_i = (s_{i1}, \ldots , s_{iL_i})$
and $\mathbf {s}_j = (s_{j1}, \ldots , s_{jL_j})$
be two action sequences of examinee i and j.
$\mathbf {s}_j = (s_{j1}, \ldots , s_{jL_j})$
be two action sequences of examinee i and j. $L_i$
and
$L_i$
and $L_j$
are the lengths of each action sequence.
$L_j$
are the lengths of each action sequence. $C_{ij}$
denotes the set of common actions that appear in both
$C_{ij}$
denotes the set of common actions that appear in both $\mathbf {s}_i$
and
$\mathbf {s}_i$
and $\mathbf {s}_j$
.
$\mathbf {s}_j$
. $U_{ij}$
denotes the set of actions that appear in
$U_{ij}$
denotes the set of actions that appear in $\mathbf {s}_i$
but not in
$\mathbf {s}_i$
but not in $\mathbf {s}_j$
. Let
$\mathbf {s}_j$
. Let $\mathbf {s}^a$
be the number of times that an action a appears in
$\mathbf {s}^a$
be the number of times that an action a appears in $\mathbf {s}$
.
$\mathbf {s}$
. $\mathbf {s}^a(k)$
denotes the kth element of
$\mathbf {s}^a(k)$
denotes the kth element of $\mathbf {s}^a$
that is, the position of the kth appearance of a in
$\mathbf {s}^a$
that is, the position of the kth appearance of a in $\mathbf {s}$
. Then, the dissimilarity among the common actions in
$\mathbf {s}$
. Then, the dissimilarity among the common actions in $\mathbf {s}_i$
and
$\mathbf {s}_i$
and $\mathbf {s}_j$
is quantified as
$\mathbf {s}_j$
is quantified as
 $$ \begin{align} f(\mathbf{s}_i, \mathbf{s}_j) = \frac{\sum_{a \in C_{ij}} \sum_{k = 1}^{K_{ij}^a} |\mathbf{s}_i^{a}(k) - \mathbf{s}_j^{a}(k)| }{\text{max}\{L_i, L_j\}}, \end{align} $$
where $K_{ij}^a = \text {min}(L_i^a, L_j^a)$
. The count of unique actions appearing in only one of
$K_{ij}^a = \text {min}(L_i^a, L_j^a)$
. The count of unique actions appearing in only one of $\mathbf {s}_i$
and
$\mathbf {s}_i$
and $\mathbf {s}_j$
is quantified as
$\mathbf {s}_j$
is quantified as
 $$ \begin{align} g(\mathbf{s}_i, \mathbf{s}_j) = \sum_{a \in U_{ij}} L_{i}^a + \sum_{a \in U_{ji}} L_j^a. \end{align} $$
Then, the dissimilarity between two action sequences is defined by
 $$ \begin{align} d(\mathbf{s}_i, \mathbf{s}_j) = \frac{f(\mathbf{s}_i, \mathbf{s}_j) + g(\mathbf{s}_i, \mathbf{s}_j)}{L_i + L_j}. \end{align} $$
Let $D = (d_{ij})$
be the
$D = (d_{ij})$
be the $N \times N$
symmetric dissimilarity matrix, where
$N \times N$
symmetric dissimilarity matrix, where $d_{ij}$
measures the dissimilarity between
$d_{ij}$
measures the dissimilarity between $\mathbf {s}_i$
and
$\mathbf {s}_i$
and $\mathbf {s}_j$
. Higher dissimilarities indicate greater disparities, and the dissimilarity between identical action sequences is zero. MDS assigns each action sequence to a latent vector
$\mathbf {s}_j$
. Higher dissimilarities indicate greater disparities, and the dissimilarity between identical action sequences is zero. MDS assigns each action sequence to a latent vector $\mathbf {m}$
in the K-dimensional Euclidean space such that these vectors dictate the dissimilarities. The application of MDS to the dissimilarity matrix D minimizes
$\mathbf {m}$
in the K-dimensional Euclidean space such that these vectors dictate the dissimilarities. The application of MDS to the dissimilarity matrix D minimizes
 $$ \begin{align} \sum_{i < j} (d_{ij} - ||\mathbf{m}_i - \mathbf{m}_j||)^2. \end{align} $$
The stochastic gradient descent (Robbins & Monro, Reference Robbins and Monro1951) can be used to solve the optimization problem. Let $\mathbf {M} = (\mathbf {m}_1, \ldots , \mathbf {m}_N)^T$
be the set of all process features extracted from the nation sequence process data. Then,
$\mathbf {M} = (\mathbf {m}_1, \ldots , \mathbf {m}_N)^T$
be the set of all process features extracted from the nation sequence process data. Then, $\mathbf {M}$
has a standard form with homogeneous dimension while preserving the information of the original sequences. Hence, it can serve as a substitute for action sequences in traditional statistical models like generalized linear models (Tang et al., Reference Tang, Wang, He, Liu and Ying2020). The number of process features K can be chosen by cross-validation and minimizing the loss function in Equation A.4.
$\mathbf {M}$
has a standard form with homogeneous dimension while preserving the information of the original sequences. Hence, it can serve as a substitute for action sequences in traditional statistical models like generalized linear models (Tang et al., Reference Tang, Wang, He, Liu and Ying2020). The number of process features K can be chosen by cross-validation and minimizing the loss function in Equation A.4.
Appendix B Approximation of the standard error of TIE by delta method
The TIE for the LCMA can be expressed as:
 $$ \begin{align} TIE &= E[Y(1, \Omega(1)) - Y(1, \Omega(0))] \nonumber\\ &= \sum_{l = 1}^{L} P(Y = 1 \mid G = 1, \Omega = l) \big[ P(\Omega = l \mid G = 1) - P(\Omega = l \mid G = 0) \big] \\ &= \sum_{l = 1}^L h(\alpha_l + \gamma) \big[ P(\Omega = l \mid G = 1) - P(\Omega = l \mid G = 0) \big],\nonumber \end{align} $$
where
 $$ \begin{align} h(x) = \frac{e^{x}}{1 + e^{x}}. \end{align} $$
Let’s denote $P_{\omega \mid g}$
as,
$P_{\omega \mid g}$
as,
 $$ \begin{align} P_{\omega \mid g} = P(\Omega = \omega \mid G = g) = \frac{exp(\beta_{0\omega} + \beta_{1\omega} g)}{\sum_{l = 1}^L exp(\beta_{0l} + \beta_{1l} g)}. \end{align} $$
Then, the partial derivative of $P_{\omega \mid g}$
with respect to
$P_{\omega \mid g}$
with respect to $\beta _{0l}$
and
$\beta _{0l}$
and $\beta _{1l}$
are
$\beta _{1l}$
are
 $$ \begin{align} \frac{\partial P_{\omega \mid g}}{\partial \beta_{0l}} = D_l ~\text{and}~ \frac{\partial P_{\omega \mid g}}{\partial \beta_{1l}} = g D_l, ~~~~\text{for}~\omega = l, \end{align} $$
with
 $$ \begin{align} D_l = \frac{exp(\beta_{0l} + \beta_{1l} g) \left( \sum_{d = 1, d \neq l}^L exp(\beta_{0d} + \beta_{1d} g) \right)}{\left( \sum_{d = 1}^L exp(\beta_{0d} + \beta_{1d} g) \right)^2 }, \end{align} $$
and
 $$ \begin{align} \frac{\partial P_{\omega \mid g}}{\partial \beta_{0l}} = -P_{\omega \mid g} P_{l \mid g} ~\text{and}~ \frac{\partial P_{\omega \mid g}}{\partial \beta_{1l}} = -gP_{\omega \mid g} P_{l \mid g}, ~~~~\text{for}~\omega \neq l. \end{align} $$
The partial derivatives of the TIE with respect to the parameters are:
 $$ \begin{align} \frac{\partial TIE}{\partial \beta_{il}} &= \sum_{d = 1}^L h(\alpha_d + \gamma) \left( \frac{\partial P_{d \mid 1}}{\partial \beta_{il}} - \frac{\partial P_{d \mid 0}}{\partial \beta_{il}} \right). \end{align} $$
 $$ \begin{align} \frac{\partial TIE}{\partial \alpha_l} &= h'(\alpha_l + \gamma) \big[ P_{l \mid 1} - P_{l \mid 0} \big], \end{align} $$
where
 $$ \begin{align} h'(x) &= \frac{e^x}{(1 + e^x)^2}. \end{align} $$
 $$ \begin{align} \frac{\partial TIE}{\partial \gamma} &= \sum_{d = 1}^L h'(\alpha_d + \gamma) \big[ P_{d \mid 1} - P_{d \mid 0} \big]. \end{align} $$
The gradient of the TIE with respect to the parameters is:
 $$ \begin{align} \Gamma = \left(\frac{\partial TIE}{\partial \beta_{02}}, \ldots, \frac{\partial TIE}{\partial \beta_{0L}}, \frac{\partial TIE}{\partial \beta_{12}}, \ldots, \frac{\partial TIE}{\partial \beta_{1L}}, \frac{\partial TIE}{\partial \gamma}, \frac{\partial TIE}{\partial \alpha_1}, \ldots, \frac{\partial TIE}{\partial \alpha_L} \right). \end{align} $$
The approximation for the SE of the $\widehat {TIE}$
is then
$\widehat {TIE}$
is then $\sqrt {\Gamma \Sigma \Gamma '}$
, where
$\sqrt {\Gamma \Sigma \Gamma '}$
, where $\Sigma $
is the covariance matrix of the parameters. The
$\Sigma $
is the covariance matrix of the parameters. The $(1 - \alpha )\%$
confidence interval of TIE is constructed as
$(1 - \alpha )\%$
confidence interval of TIE is constructed as $\widehat {TIE} \pm z_{\alpha / 2} \times SE$
, where
$\widehat {TIE} \pm z_{\alpha / 2} \times SE$
, where $z_{\alpha / 2}$
is the critical value from the standard normal distribution.
$z_{\alpha / 2}$
is the critical value from the standard normal distribution.
Appendix C True model parameter values in the simulation study
In the simulation study, the true model parameter values are set as follows. The true $\gamma $
,
$\gamma $
, $\boldsymbol {\alpha }$
,
$\boldsymbol {\alpha }$
, $\boldsymbol {\beta _1}$
, and
$\boldsymbol {\beta _1}$
, and $\boldsymbol {\beta _0}$
values were fixed in all simulation conditions.
$\boldsymbol {\beta _0}$
values were fixed in all simulation conditions.
 $$ \begin{align} \gamma &= 0, \nonumber\\ \boldsymbol{\alpha} &= (-1, -1/3, 1/3, 1), \nonumber\\ \boldsymbol{\beta_1} &= (0, -2/3, -4/3, -2), \nonumber\\ \boldsymbol{\beta_0} &= (0, 1/3, 2/3, 1). \end{align} $$
The true class-specific mean structure, ![]() is given in Figure 3. The true class-specific covariance matrix is composed of
is given in Figure 3. The true class-specific covariance matrix is composed of $\boldsymbol {\lambda } = (\lambda _1, \ldots , \lambda _L)$
that controls the volume and a diagonal matrix
$\boldsymbol {\lambda } = (\lambda _1, \ldots , \lambda _L)$
that controls the volume and a diagonal matrix $B,$
where the class-specific covariance matrix is
$B,$
where the class-specific covariance matrix is $\Sigma _l = \lambda _l B$
. In
$\Sigma _l = \lambda _l B$
. In $Var = 1$
conditions,
$Var = 1$
conditions, $\boldsymbol {\lambda }$
was set as
$\boldsymbol {\lambda }$
was set as
 $$ \begin{align} \boldsymbol{\lambda} = (1, 1, 1, 1), \end{align} $$
so that the volume of the four classes is equal, and small enough to yield no between-class overlap. In $Var = 3$
conditions,
$Var = 3$
conditions, $\boldsymbol {\lambda }$
was set as
$\boldsymbol {\lambda }$
was set as
 $$ \begin{align} \boldsymbol{\lambda} = (3, 5, 7, 9). \end{align} $$
The classes were allowed to vary in their volumes and have overlapping observations between classes as demonstrated in Figure 4. The diagonal elements of B, $diag(B) = (B_{1,1}, \ldots , B_{K, K})$
were generated as follows. Let
$diag(B) = (B_{1,1}, \ldots , B_{K, K})$
were generated as follows. Let $B^* = (B^*_{1}, B^*_{2}, \ldots , B^*_{K})$
, where K is the number of items.
$B^* = (B^*_{1}, B^*_{2}, \ldots , B^*_{K})$
, where K is the number of items.
 $$ \begin{align} B^*_{i} = 1 + \frac{i - 1}{45}, ~~~~ i = 1, \ldots, K. \end{align} $$
The variance of the $10$
th item is 1.2 times the variance of the first item within a class. Then,
$10$
th item is 1.2 times the variance of the first item within a class. Then, $B^*$
was normalized by the geometric mean to satisfy
$B^*$
was normalized by the geometric mean to satisfy $|B| = 1$
.
$|B| = 1$
.
 $$ \begin{align} B_{i, i} = \frac{B^*_i}{(\prod_{j = 1}^K B^*_i)^{1 / K}}, ~~~ i = 1, \ldots, K. \end{align} $$
Parameter recovery with fixed L and $\mathbf {M}_\kappa $

Appendix D Model parameter recovery check
In this section, we evaluate the accuracy of parameter estimates of the LCMA model. The LCMA model was fitted using all indicators $\mathbf {M}_\kappa $
, with the number of latent classes L fixed at its true value, to assess the parameter estimation accuracy of the EM algorithm. Random samples were generated under a latent class mediation model with
$\mathbf {M}_\kappa $
, with the number of latent classes L fixed at its true value, to assess the parameter estimation accuracy of the EM algorithm. Random samples were generated under a latent class mediation model with $L = 4$
latent classes and
$L = 4$
latent classes and $K = 10$
signal indicators. The sample sizes considered were
$K = 10$
signal indicators. The sample sizes considered were $N = 500$
and
$N = 500$
and $N = 1000$
. The true parameter values are specified as Equations C.1–C.2 and C.4–C.5. The additional parameters related to the covariate
$N = 1000$
. The true parameter values are specified as Equations C.1–C.2 and C.4–C.5. The additional parameters related to the covariate $\mathbf {X}$
were set as follows:
$\mathbf {X}$
were set as follows:
 $$ \begin{align} \boldsymbol{\xi} &= (0, -2/3, -4/3, -2); \nonumber\\ \zeta &= 0.5. \end{align} $$
The true mean structure was specified as in Equation D.2. Simulation results based on 100 replications are summarized in Table D1. The bias ranged from $-0.058$
to
$-0.058$
to $0.033$
in the
$0.033$
in the $N = 500$
condition, and it decreased as the sample size increased to
$N = 500$
condition, and it decreased as the sample size increased to $N = 1000$
, ranging from
$N = 1000$
, ranging from $-$
0.026 to
$-$
0.026 to $0.032$
. The RMSE also decreased from (0.187, 0.332) to (0.127, 0.223) as the sample size increased.
$0.032$
. The RMSE also decreased from (0.187, 0.332) to (0.127, 0.223) as the sample size increased.
 $$ \begin{align} \boldsymbol{\mu} = \begin{pmatrix} 10 & 20 & 30 & 40 \\ 10 & 20 & 30 & 40 \\ 10 & 20 & 30 & 40 \\ 10 & 20 & 30 & 40 \\ 10 & 20 & 30 & 40 \\ 10 & 20 & 30 & 40 \\ 10 & 20 & 30 & 40 \\ 10 & 20 & 30 & 40 \\ 10 & 20 & 30 & 40 \\ 10 & 20 & 30 & 40 \end{pmatrix}. \end{align} $$
Appendix E Simulation under alternative data generating models
In this section, we evaluate the performance of the LCMA procedure under four alternative data-generating models in terms of the variable selection and the parameter estimation accuracy. The alternative models include the following.
-
Condition 1 Confounder X and a non-zero
$\gamma .$
-
Condition 2 Noisy latent class underlying a noisy feature.
-
Condition 3 Unmeasured mediator
$\theta $
. -
Condition 4 Mixture Poisson distribution.


In each condition, 100 random samples were generated with sample size $N = 500$
and true number of latent classes
$N = 500$
and true number of latent classes $L = 4$
.
$L = 4$
.
In Condition 1, the effect of a predictor–mediator and mediator–outcome confounder X is included in the data-generating model and is estimated. The true parameter values are specified as Equations C.1–C.2 and C.4–C.5. The parameters related to the confounder effect were set as follows:
 $$ \begin{align} \boldsymbol{\xi} &= (0, -2/3, -4/3, -2); \nonumber\\ \zeta &= 0.5. \end{align} $$
The number of signal indicators was $S = 5$
, and the true mean structure was specified as in the
$S = 5$
, and the true mean structure was specified as in the $S = 5$
condition in Figure 3. In addition, we included a non-zero
$S = 5$
condition in Figure 3. In addition, we included a non-zero $\gamma = 0.2$
value, that is, a non-zero DE of the predictor given the latent class mediator and the confounder.
$\gamma = 0.2$
value, that is, a non-zero DE of the predictor given the latent class mediator and the confounder.
In Condition 2, a noisy latent class variable underlying a noisy feature was generated. This noisy latent class variable was unrelated to both the predictor and the outcome in the generating model. In this condition, we evaluated whether the proposed algorithm correctly selects the signal features despite the presence of a clustering structure underlying a noisy feature. More specifically, the signal latent class variable $\Omega $
was generated as a function of the predictor G,
$\Omega $
was generated as a function of the predictor G,
 $$ \begin{align} P(\Omega_i = \omega \mid G_i = g) = \frac{e^{\beta_{0\omega} + \beta_{1\omega}g}}{\sum_{l = 1}^L e^{\beta_{0l} + \beta_{1l} g}}. \end{align} $$
Then, the signal features $M_{k^*}$
were generated as
$M_{k^*}$
were generated as
 $$ \begin{align} M_{k^*} \mid \Omega = \omega \sim MVN (\mu_{\omega}, \Sigma_{\omega}). \end{align} $$
Then, the final outcome Y was generated as a function of the predictor G and the signal latent class variable $\Omega $
, similar to Equation 4. The true parameter values are specified as Equations C.1–C.2 and C.4–C.5. The number of signal indicators was
$\Omega $
, similar to Equation 4. The true parameter values are specified as Equations C.1–C.2 and C.4–C.5. The number of signal indicators was $S = 5$
and the true mean structure was specified as in the
$S = 5$
and the true mean structure was specified as in the $S = 5$
condition in Figure 3. The noisy latent class variable
$S = 5$
condition in Figure 3. The noisy latent class variable $\Omega ^*$
was generated independently from a Bernoulli distribution.
$\Omega ^*$
was generated independently from a Bernoulli distribution.
 $$ \begin{align} \Omega^* \sim \text{Bernoulli}(0.5). \end{align} $$
Then, one of the noisy features was generated given the noisy latent class membership as,
 $$ \begin{align} M_{6} \mid \Omega^* \sim MVN (\mu_{\omega^*}, \Sigma_{\omega^*}). \end{align} $$
In Condition 3, an unmeasured mediator $\theta $
was considered where
$\theta $
was considered where $\theta $
was generated as a function of the predictor G,
$\theta $
was generated as a function of the predictor G,
 $$ \begin{align} \theta \mid G \sim N(\mu_g, \sigma^2_g), \end{align} $$
where $\mu _g = g, \sigma ^2_g = 0.01$
. Then, the outcome variable Y was generated as a function of G,
$\mu _g = g, \sigma ^2_g = 0.01$
. Then, the outcome variable Y was generated as a function of G, $\Omega $
, and
$\Omega $
, and $\theta $
.
$\theta $
.
 $$ \begin{align} P(Y_i = 1 \mid G_i = g, \Omega_i = \omega, \theta_i = \theta) = \frac{e^{\gamma g + \alpha_\omega + \theta}}{1 + e^{\gamma g + \alpha_\omega + \theta}}. \end{align} $$
The true parameter values are specified as Equations C.1–C.2 and C.4–C.5. The number of signal indicators was $S = 5$
, and the true mean structure was specified as in the
$S = 5$
, and the true mean structure was specified as in the $S = 5$
condition in Figure 3.
$S = 5$
condition in Figure 3.
In Condition 4, we evaluate the performance of the proposed algorithm under the non-normality assumption. The features were generated under a mixture Poisson distribution with class-specific rate $\lambda _\omega $
given in Equation E.8. Each column represents a latent class. The first five rows represent the signal indicators, and the last five rows are the noisy indicators. All the other true parameter values were set as Equation C.1.
$\lambda _\omega $
given in Equation E.8. Each column represents a latent class. The first five rows represent the signal indicators, and the last five rows are the noisy indicators. All the other true parameter values were set as Equation C.1.
 $$ \begin{align} \boldsymbol{\Lambda} = \begin{pmatrix} 10 & 2 & 10 & 10 \\ 10 & 10 & 2 & 10 \\ 10 & 10 & 10 & 2 \\ 2 & 10 & 10 & 10 \\ 2 & 10 & 10 & 10 \\ 10 & 10 & 10 & 10 \\ 10 & 10 & 10 & 10 \\ 10 & 10 & 10 & 10 \\ 10 & 10 & 10 & 10 \\ 10 & 10 & 10 & 10 \end{pmatrix}. \end{align} $$
The results from the additional simulation with alternative data-generating models are presented in Table E2. The classification accuracy remained reasonably high, with the ARI ranging from $0.79$
to
$0.79$
to $0.91$
. The false positive rate for selecting noisy indicators ranged from
$0.91$
. The false positive rate for selecting noisy indicators ranged from $0.03$
to
$0.03$
to $0.14$
. The bias in the TIE was small, with relative bias less than
$0.14$
. The bias in the TIE was small, with relative bias less than $0.1$
, except in Condition 3 with an unmeasured mediator. When the unmeasured mediator
$0.1$
, except in Condition 3 with an unmeasured mediator. When the unmeasured mediator $\theta $
was not included in the model, the TIE was overestimated. Similarly, the RMSE of the TIE was highest in Condition 3.
$\theta $
was not included in the model, the TIE was overestimated. Similarly, the RMSE of the TIE was highest in Condition 3.
Results from the additional simulation with alternative data generating models


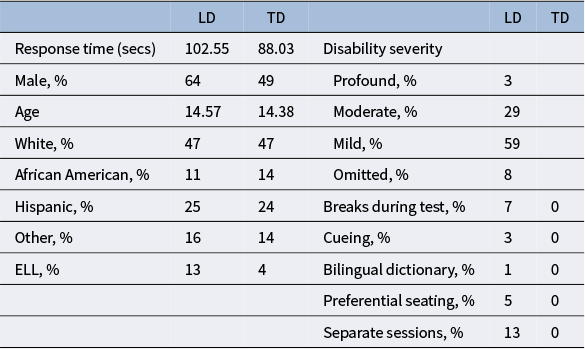
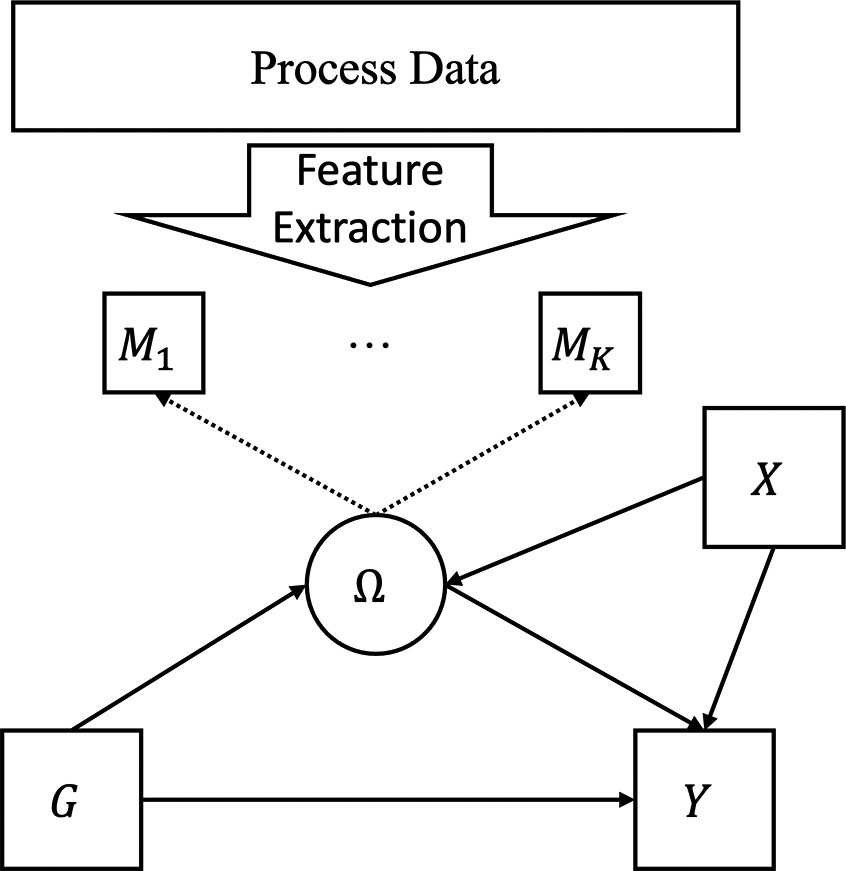


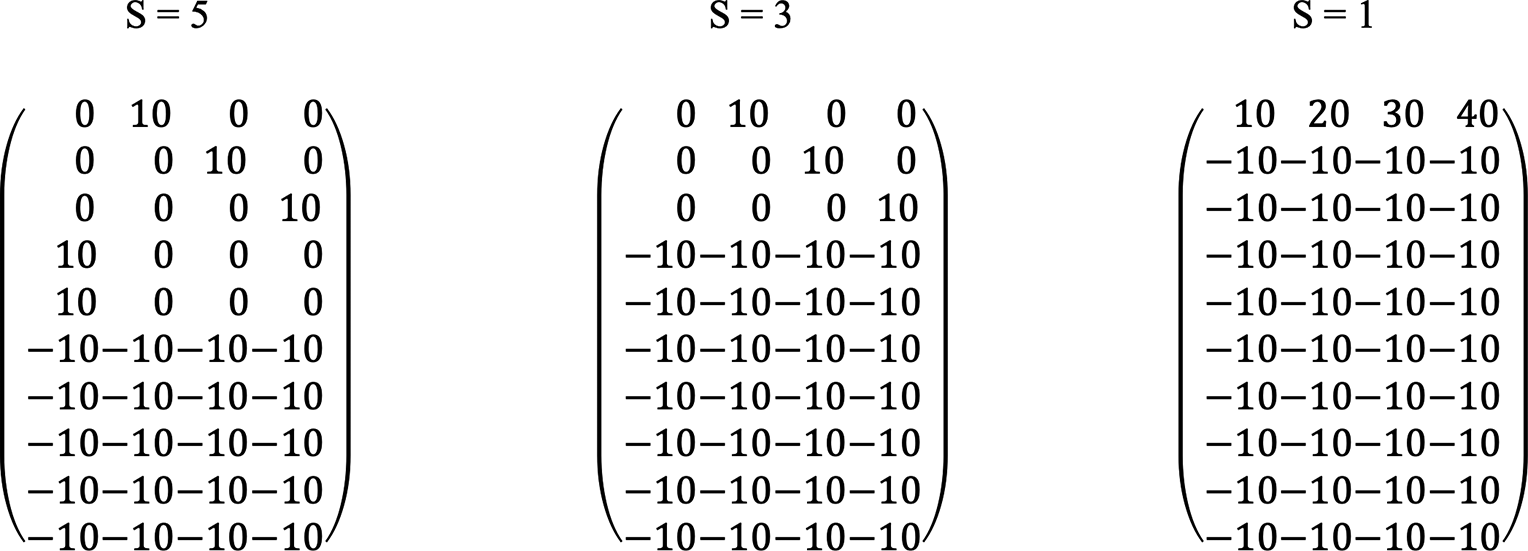

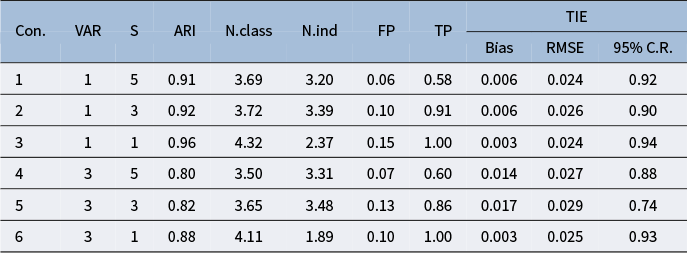
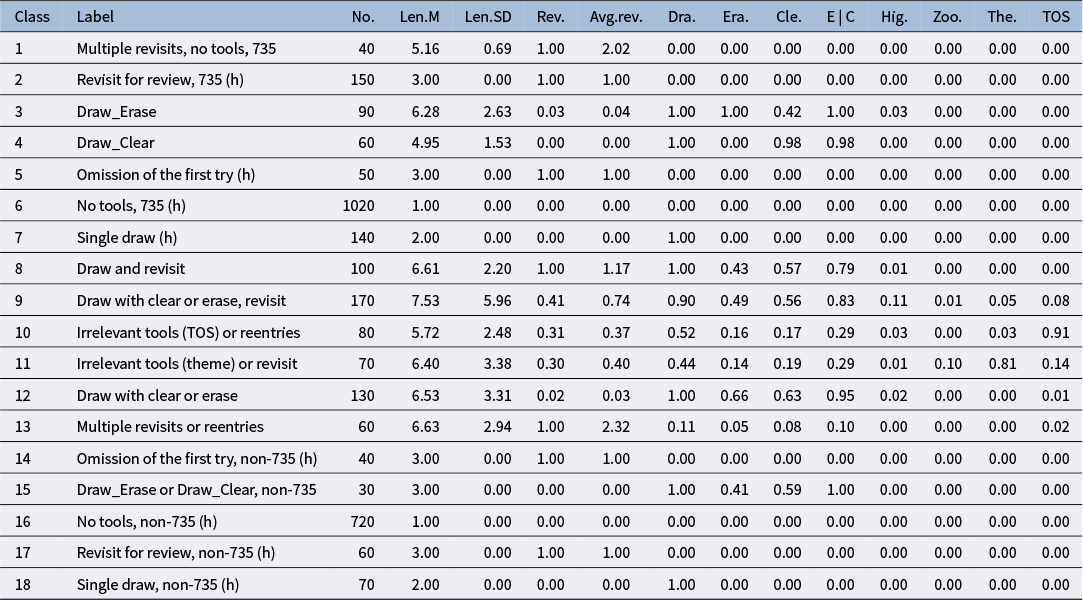
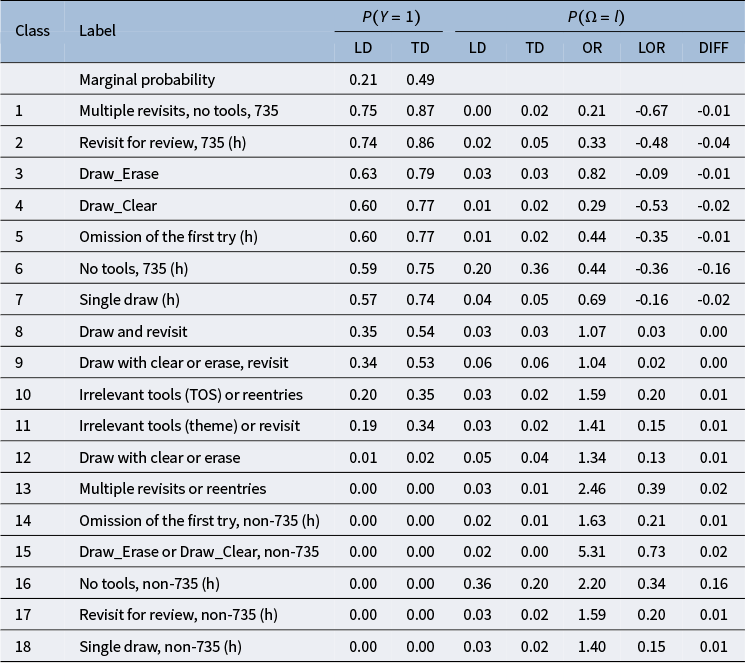
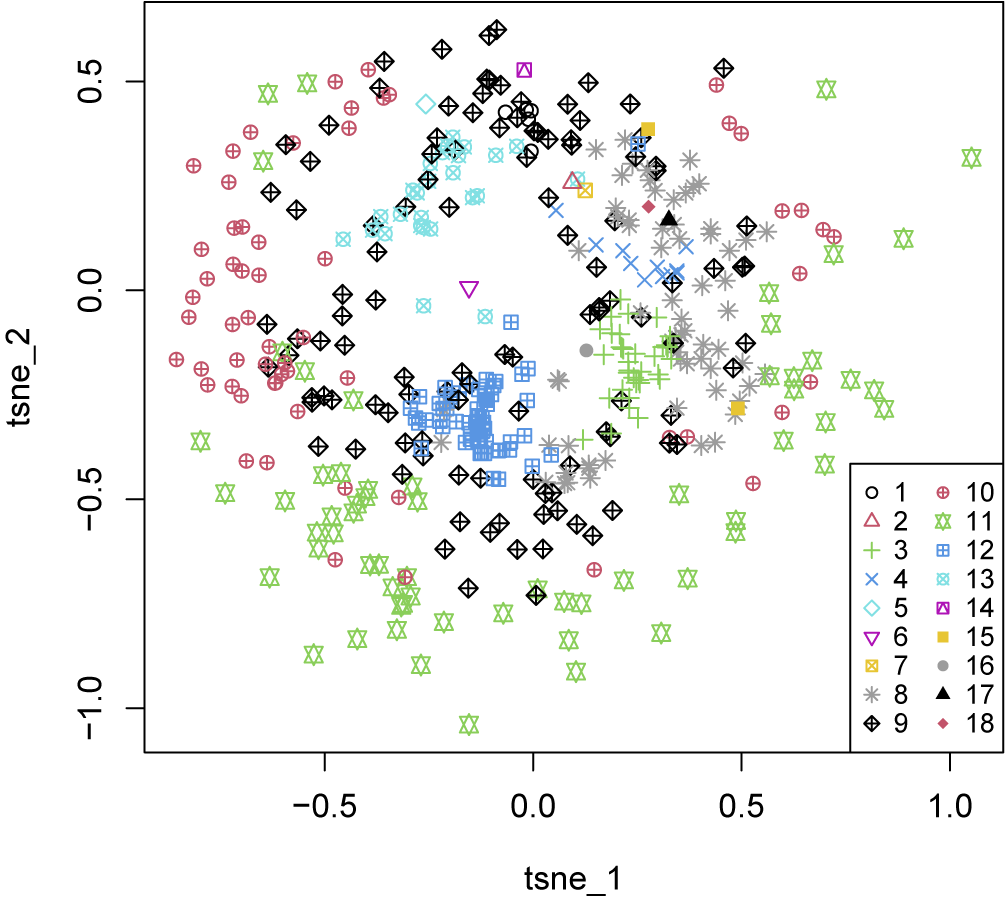
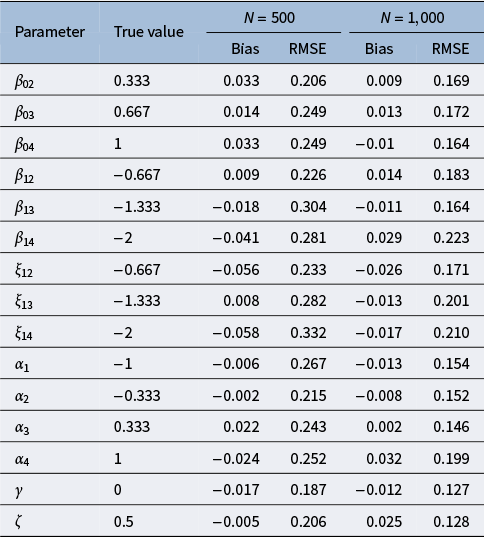

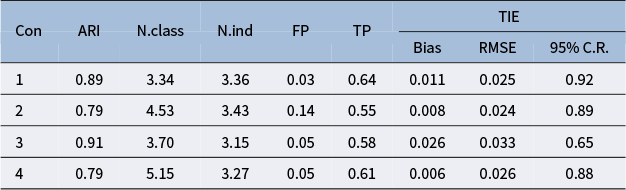

 Open access