


Alcohol consumption is associated with a variety of negative social and health-related outcomes, including an increased risk for cancer(Reference Chick1). A recent review found that alcohol was the seventh leading risk for premature death in 2016 and concluded that no amount of alcohol is safe(Reference Griswold, Fullman and Hawley2). Due to these reasons, the WHO conducts a global strategy to reduce the harmful use of alcohol(Reference Chick1). One proposed strategy to achieve this goal is to reduce the alcoholic strength of beverages.
Literature has shown that health is of increasing interest to consumers, and their food and wine decision-making(Reference Lähteenmäki3–Reference Stockley, Taylor and Montgomerie6). Low-alcoholic beverages are often perceived as a way to reduce the negative health-related consequences caused by alcohol consumption and therefore suit the general trend towards living healthier lifestyles(Reference Saliba, Ovington and Moran7,Reference Bucher, Deroover and Stockley8) . One survey conducted in Australia showed a consumer interest of 6–8 %(Reference Mueller, Lockshin and Louviere9), whereas another Australian survey reported that the relative acceptance of low-alcohol wine was 16 %, but 40 % of the participants would consider the purchase of low-alcohol wine if it would taste the same as standard wine(Reference Saliba, Ovington and Moran7).
Innovations in the production process of low-alcohol wine have resulted in low-alcohol wine with highly acceptable sensory properties and a taste very similar to the standard wine. Only a limited amount of literature looked into the way consumers perceive and rate low-alcohol wine(Reference Bucher, Deroover and Stockley8,Reference Bucher, Deroover, Stockley, Morata and Loira10,Reference Bruwer, Jiranek and Halstead11) . Research has shown that, through mere exposure, the alcohol-related attributes in the sensory profile of a wine can be perceived as that what makes wine taste like wine, resulting in depreciation of wines with reduced alcohol content because of the lack of the alcohol taste(Reference Meillon, Viala and Medel12,Reference Zajonc13) . Some experimental studies found that the expected quality for ‘low-alcohol’-labelled wine was significantly lower as compared with a standard wine(Reference Masson, Aurier and d’hauteville14). However, in the same study, taste ratings of low-alcohol wines (9 % alcohol) did not differ from ratings of standard wines (13 % alcohol), neither under blind condition nor if participants were aware they were consuming low-alcohol wine(Reference Masson, Aurier and d’hauteville14). In the present study, it was hypothesised that the low-alcohol label will result in a lower perceived quality and therefore a lower rating of the wine. Furthermore, it was hypothesised that participants in both low-alcohol conditions will rate the wine lower than those in the standard condition because they are not familiar with the taste.
Previous studies on consumer’s willingness to pay for non-standard wines with health benefits resulted in mixed results. Some found that perceived healthfulness was not one of the main purchase criteria(Reference Wright, Bruhn and Heymann15) and health-related labels, such as ‘no sulphites added’ or ‘organic’, only played a small role compared with price and taste(Reference Higgins and Llanos16). Others found that consumers were willing to pay more for wine made with grapes enriched in resveratrol, a phenolic that has been suggested to have antioxidant, cardioprotective and cancer chemopreventive effects(Reference Barreiro-Hurlé, Colombo and Cantos-Villar17,Reference Soleas, Grass and Josephy18) . In the present study, it was hypothesised that participants would be willing to pay less for the low-alcohol wine than for standard wine, as it is assumed that participants would not be familiar with the product and its (health) benefits, and a perceived lower quality would result in lower willingness to pay.
A main benefit of low-alcohol wine may be that, when replacing standard alcoholic beverages and without increasing the volume of alcoholic beverages consumed, the total intake of alcohol, and the likeliness of its harmful effects, will be reduced. In addition, low-alcohol beverages may also bring social benefits, including less aggressive and more acceptable social behaviour in general. However, overconsumption, that is, an increased intake of lower strength products resulting in an overall increase in alcohol intake, has been discussed in past research as a counter argument against the promotion of lower alcohol beverages(Reference Rehm, Lachenmeier and Llopis19). In a study by Higgs et al. (Reference Higgs, Stafford and Attwood20), in which participants were instructed to consume a target drink ‘at a rate that is comfortable’ for them, participants consumed a beverage with a higher percentage of alcohol at a slower rate. This would indicate that people would consume less of a stronger alcoholic beverage within a fixed time frame. Previous studies in the area of food research showed that labels on food products, such as ‘light’ or ‘low-fat’, could trigger an increase in consumption(Reference Provencher, Polivy and Herman21,Reference Wansink and Chandon22) . A higher consumption of products with health-indicating labels occurred, compared with standard products with no health-indicating label. According to this finding, it is possible that such behaviour could also be observed with low-alcohol-labelled products, as they also suggest positive health effects. It is therefore hypothesised that participants in the low-alcohol condition will consume more wine than those participants who will be offered the standard wine.
In summary, there is some evidence that low-alcohol labelling on wine might influence consumer perception and behaviour; however, more insight from experimental studies is needed. The present study aims to test consumer perception and consumption behaviour related to ‘low-alcohol’ white wine. The purpose of this study is three-fold: to explore participants’ perceptions of low-alcohol wine and the influence of a low-alcohol label on these perceptions, to investigate participants’ willingness to pay for low-alcohol wine and finally, to explore the effect of a low-alcohol label on consumption behaviour, and to investigate whether it results in overconsumption.
Methods
Design
Participants were randomly assigned to one of the experimental conditions: 1) low-alcohol wine, 2) low-alcohol wine (blinded) or to the control condition 3) standard wine.
Data collection was completed at the University of Newcastle City campus between January and February 2018. The study procedure was approved by the Human Research Ethics Committee of the University of Newcastle (H-2017-0419) . The study manager had a valid ‘Responsible Service of Alcohol’ certificate, which allows serving alcohol in Australia.
Participants
Adult participants were recruited through announcements on social media and local media channels, that is, newspaper ‘Newcastle Herald’, the website ‘HUNTER hunter’, and on local radio and TV. Interested potential participants then had to contact the study manager to check their eligibility for participation in this study. Following inclusion criteria were taken into account: (i) aged 18 years or older; (ii) not allergic to white wine and (iii) agreed not to drive within 4 h after the tasting. If all criteria were met, the participants received an email with an information sheet and the consent form. They could then register for a study appointment via an online booking system. Sample size was determined prior to data collection using G*Power 3(Reference Faul, Erdfelder and Lang23). This analysis resulted in a required total sample size of eighty-four participants, which would ensure a power of 0·8 while testing with an alpha-error of 0·05, supposing the size of the effect is medium to large (f = 0·35). However, slightly more participants were recruited in case that some of the participants had to be excluded. Ninety-two men and women attended and participated in this experiment. Two participants were excluded from the analysis because of incomplete data collection. All participants provided written informed consent before participation in the study.
Experimental procedure
The participants were invited to taste a new white wine (Sauvignon Blanc (SB) 2016) and were told that the aim of the study was to evaluate this new wine. Participants did not receive a financial incentive for participation in the current study. They were randomly allocated to one of the three conditions: ‘low-alcohol’, ‘low-alcohol blind’ or ‘standard’ (control). Participants in the low-alcohol condition received low-alcohol wine (8%) and were invited for a tasting of a ‘new low-alcohol white wine’. Participants in the non-blinded experimental condition received an information sheet which included some facts about the grape varieties, region, etc., including the alcoholic strength, that is, 8 %. Participants in the low-alcohol blinded condition received the same low-alcohol wine but were invited for a tasting of a ‘new white wine’ on the market. Hence, they were not aware that they tasted a product that contained less alcohol. Participants in the control condition received a standard wine and were also invited for a tasting of a new white wine on the market. The provided wine was a SB, 2016, that was available in two variations. Variation one was the standard SB wine, with an alcohol content of 12·5 %. This wine was offered to the control condition (‘standard wine’ condition). Variation two was the same wine (SB 2016) but with a reduced content of alcohol (8 %). This wine was offered to participants belonging to the low-alcohol condition and the low-alcohol blind condition.
An individual appointment for each participant was made. For the tasting, the participant was seated at a table. In front of the participant, the following items were placed on the table. On the right, a wine bottle containing 300 ml of SB (either low or standard SB) and a standard bell-shaped wine glass (IKEA SVALKA, 250 ml) were provided. A sheet of paper was taped around the wine bottle in such a way that the amount of wine contained in the bottle was not discernible, and participants would not be influenced by the amount of wine left in the bottle, to minimise an anchoring effect or social desirability bias. Next to the wine bottle, a jug with one litre of tap water and a cup were placed on the table. On their left, participants could find a white plate with five slices of plain white bread. Before they started with the study, participants were advised to read the instructions. The written instructions informed the participants that they were going to taste a new low-alcohol wine (low-alcohol condition) or a new white wine (low-alcohol blind condition and standard condition). They were also informed that they could taste as much wine as they liked and could help themselves to wine, water, and bread during the tasting. Additionally, participants were instructed to stay in the study room for the full 20 min that were provided for the tasting. A timer set to 20 min was visible to all participants. Once participants had read the written instructions, the study manager replaced the sheet with a product sheet of the wine and a tablet with an online survey. The survey was programmed using Qualtrics.
Wine
The wine that was used in the present study was produced at a local winery in the Hunter Valley (Tamburlaine Wines, NSW, Australia) . The low-alcohol variant of the wine was produced for the purpose of this study and is not currently available on the market. The grape of the wine came from Orange (a wine region in NSW, Australia) and was 100 % SB. The standard variant of the SB contains 12·5 % of alcohol. The wine maker used reverse osmosis to produce a low-alcohol wine for the purpose of the current study. Alcohol and water have a lower molecular weight than the other wine components. Consequently, they can be separated from the rest of the wine using a membrane that only allows these low-molecular-weight molecules to pass. The alcohol is then separated from the permeate by column distillation, and the permeate with less ethanol is returned into the wine. This process has the advantage that alcohol is selectively reduced, while flavours, colours and tannins are preserved. This method is often used to balance wines in sunny years when the sugar content of the grapes is higher than usual and the resulting alcohol content is too high(Reference Bui, Dick and Moulin24,Reference Catarino, Mendes and Madeira25) . After the reverse osmosis process, the wine used for the study contained 8 % of alcohol.
Measures
An online questionnaire assessed the participant’s perceptions of the tasted wine through several questions. Six items evaluated the following properties of the wine: dryness, sweetness, smoothness, butteriness, crispness and fruitiness. Answers were given on a seven-point Likert scale from 1 (strongly disagree) to 7 (strongly agree). These items were included in the questionnaire in order to mask the actual purpose of the study. Two questions were used to measure how much participants liked the wine. The first item was: ‘Drinking this wine was pleasant’. Answers were given on a seven-point Likert scale from 1 (strongly disagree) to 7 (strongly agree). The second item was: ‘Please indicate how much you liked the low-alcohol wine/new white wine Sauvignon Blanc that you have tasted’. Answers were given from 1 (dislike a great deal) to 7 (like a great deal). To assess how much participants were willing to pay for the tasted wine, they were asked to give an answer on a five-point Likert scale from 1 = $0AUD, 2 = $0–10AUD, 3 = $10–15AUD, 4 = $15–20AUD, 5 = $20AUD or more.
In addition to that, participants were asked how much wine (red, white) they drink on a weekly basis. Participants were also asked if they were currently trying to reduce their alcohol consumption and reported socio-demographic characteristics such as gender and age.
The participants in the blinded experimental condition received one additional question as they were debriefed at the very end of the survey and then asked if they had noticed any differences between the low-alcohol wine they have just tasted and a standard wine. Answers were given on a Likert scale from 1 (definitely yes) to 4 (definitely not).
The amount of consumed wine was measured with a measuring scale. A density of 1 g/cm3 was assumed (e.g. 100 ml of wine equals 100 g). Each participant had been offered 300 ml of chilled wine, and after the trial, the leftover wine in both the bottle and the glass was measured to determine how much wine the participant consumed. Based on the consumed amount of wine, the consumed amount of alcohol was calculated by multiplying the volume by the relevant alcohol percentage. Water and bread consumption were measured as control variables.
Statistical analysis
Statistical analysis was performed using IBM SPSS Statistics version 24 (SPSS Inc.). Normal distribution of data was tested with the Kolmogorov–Smirnov test, and homogeneity of variance was tested with the Levene’s test. Descriptive statistics were used for the socio-demographic measures, average wine consumption measures, and whether participants were trying to reduce alcohol consumption. Differences between the conditions were measured with χ 2 for the categorical variables and one-way ANOVA for the continuous variables. Normally distributed data were summarised as means (M) and standard deviation (sd). Significance level was set at P < 0·05. One-way ANOVA were conducted to compare the mean consumed amount of wine, alcohol, bread and water, the willingness to pay, liking and pleasantness of the wine between the three experimental conditions. Test values (F), degrees of freedom (df) and significance (P) were reported. To determine which conditions differed significantly from each other, post hoc comparisons (Tukey HSD) were reported.
Results
Ninety participants were included in the analysis. The sample consisted of thirty-eight males and fifty-two females, with a mean age of 41 years (sd = 14·06, Min = 21, Max = 75). Only 7·8 % of the sample was trying to reduce their alcohol consumption to a great extent, and 92·2 % was not trying or trying only a little to reduce their alcohol consumption. Table 1 describes age, gender, the participants’ average wine consumption per week and their aim to reduce their alcohol consumption in total and per condition. No significant differences between conditions were found for these variables.
Table 1 Description of study population (n 90)

* Red and white wine consumption were measured on a scale (1:0 ml; 1:<100 ml; 2:100–200 ml; 3:200–300 ml; 4: 300–400 ml; 5:400–500 ml; 6:500–750 ml; 7: 750–1500 ml; 8: >1500 ml).
Twenty-nine (out of 30) participants of the blinded experimental condition answered the question whether they noticed any differences between the low-alcohol wine and a standard wine. Seven participants said ‘definitely yes’, five participants answered ‘probably yes’, nine answered ‘probably not’ and eight answered ‘definitely not’.
Table 2 shows the results for the comparison analyses for perceptions, willingness to pay and consumption behaviour. The mean amount of wine consumed in the three conditions (M = 161·96, sd = 70·98) was not significantly different (F 2,86 = 0·43, P = 0·65). Consequently, the amount of alcohol consumed (M = 14·96, sd = 7·28) differed significantly (F 2,86 = 6·62, P = 0·002, η 2 = 0·13), and the participants in the low-alcohol conditions drank approximately 30 % less alcohol than those in the control condition. Figure 1 shows the mean wine and alcohol consumption for each group.
Table 2 Summary of the results (n 90)
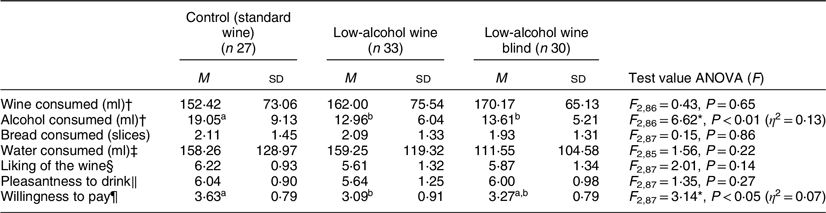
† In the analysis of the consumed amount of wine, a cut-off score of ≥30 ml was used, resulting in the exclusion of one participant for that particular analysis (n 89).
‡ The water consumption of two participants was not recorded (n 88).
§ Liking the wine was measured on a seven-point scale.
‖ Pleasantness to drink the wine was measured on a seven-point scale.
¶ Willingness to pay was measured on a five-point scale (1 = $0AUD; 2 = $0–10AUD; 3 = $10–15AUD; 4 = $15–20AUD; 5 = $20AUD or more).
a,bPost hoc multiple comparisons were performed using Tukey-HSD test, for three comparisons. Different superscript letters indicate significant differences (mean values <0·05) between conditions.
* P < 0·05.

Fig. 1 Total wine and alcohol consumption Mean M and standard deviation (sd) for each group. (a) The mean amount of wine consumed in the three conditions (M = 161·96, sd = 70·98) was not significantly different (F 2,86 = 0·43, P = 0·65). (b) The amount of alcohol consumed (M = 14·96, sd = 7·28) differed significantly (F 2,86 = 6·62, P = 0·002, η 2 = 0·13) between the low-alcohol groups and the control group. ![]() , Control;
, Control; ![]() , low alcohol;
, low alcohol; ![]() , low alcohol blinded
, low alcohol blinded
Neither the amount of bread (slices) consumed (M = 2·04, sd = 1·35, P = 0·86, F 2,87 = 0·15) nor the amount of water (ml) consumed (M = 143·22, sd = 115·6, P = 0·22, F 2,85 = 1·56) differed significantly between groups. However, the willingness to pay was significantly different between groups (F 2,87 = 3·14, P = 0·048, η 2 = 0·07). A post hoc Tukey test showed that the low-alcohol (M = 3·09, sd = 0·91) and the control condition (standard wine) (M = 3·63, sd = 0·79) differed significantly at P < 0·05; the low-alcohol blind condition (M = 3·27, sd = 0·79) was not significantly different from the other two conditions.
Further, ANOVA showed that there was no significant difference between the groups in liking of the wine (F 2,87 = 2·01, P = 0·14), nor in perceived pleasantness to drink the wine (F 2,87 = 1·35, P = 0·27).
Discussion
Acceptance of low-alcohol wine
Within the evaluations ‘liking of the new wine’ and ‘pleasantness to drink the wine’, there were no significant differences in mean values between participants in the low-alcohol condition and the other two conditions, that is, control condition (standard wine) and low-alcohol blind condition. Both wines (low-alcohol wine and standard wine) received high ratings. These positive perceptions of low-alcohol wine support the assumption that production methods have improved within the last years, resulting in low-alcohol wine with good sensory qualities. It should be noted that the acceptance of low-alcohol wine may differ between countries.
A study by d’Hauteville(Reference d’Hauteville26), for example, found that people from the UK (26·7 %) were more willing to accept the concept of low-alcohol wine compared with people from Germany (19·5 %) or France (12·4 %). One possible explanation for this may be that other low-alcohol beverages, such as low-alcohol beer, have been well established yet in countries like the UK(Reference Chrysochou27), whereas lower acceptance for low-alcohol wine in France could be due to the long wine tradition within the French culture. Future studies may wish to compare different countries and investigate how cultural aspects influence the acceptance of low-alcohol wine.
Willingness to pay
A significant difference between the conditions was also found for ‘willingness to pay’. Participants were willing to pay more for standard wine than for low-alcohol wine. This finding is in line with the previous research, suggesting that in wine consumer decision-making, price and taste play a bigger role than health benefits(Reference Wright, Bruhn and Heymann15,Reference Higgins and Llanos16) . As price has been described as an indicator of quality(Reference Chrysochou27), a lower willingness to pay for low-alcohol wine may indicate that it is perceived to be a lower quality product. Also, consumers may assume that pricing should be based on alcoholic strength. Spirits, for example, have a higher alcoholic content and are often more expensive, whereas beer has a lower alcoholic content and is generally cheaper. This may cause the consumer to expect that a wine with a lower alcoholic strength will be cheaper than a standard wine. Furthermore, consumers may not be aware that alcohol reduction involves additional processing steps(Reference Pickering28), which add to the costs. It may be beneficial to inform consumers about the process and the technology used to reduce alcohol. Past research showed that consumers who trust the technological developments in agribusiness were more likely to choose functional wines as compared with consumers with no or little trust in technology improvements(Reference Barreiro-Hurlé, Colombo and Cantos-Villar17). This result suggests that promoting technology improvements could help to establish the market potential for low-alcohol wine.
Furthermore, it may be useful to consider the effect of labelling when investigating consumer’s willingness to pay. The term ‘low’ might be perceived as an indication that there is something lacking or less, which could evoke negative connotations and imply that it is a product with lower quality and hence must be cheaper. Further studies should investigate the use of different terms, such as ‘light wine’ or ‘reduced alcohol wine’. It may also be important to be aware that familiarity with labels could increase consumers’ willingness to pay. Janssen and Hamm(Reference Janssen and Hamm29) investigated consumers’ willingness to pay for wines with different organic labels. They found that consumers were more willing to pay for an organic wine if the organic label was well known. They indicated higher trust in labels that they are familiar with. However, in the present study, we aimed to avoid brand influences and did therefore not provide the name of the wine maker to the participants. However, Tamburlaine Organic Wine is a well-known wine producer in Newcastle and it is possible that the consumers’ willingness to pay would have been different, if they had been aware of the label and its wine producer. Further research on the effect of labelling should therefore be considered.
Risks and benefits of low-alcohol beverages: consumption behaviour
The third aim of the current study was to investigate how the low-alcohol wine label influences participants’ consumption behaviour. A recent study by Vasiljevic et al. (Reference Vasiljevic, Couturier and Frings30) showed that the total amount of drink consumed increased as the indicated alcohol strength on the label decreased. In the present study, however, participants in both low-alcohol wine conditions did not drink more wine as compared with those in the standard condition and no overcompensation was found in the low-alcohol condition. The difference in experimental design may partially explain these contradicting findings: Besides presenting a wine that was ‘low’ in alcohol (8 %), Vasiljevic et al. (Reference Vasiljevic, Couturier and Frings30) also presented a wine label that suggested that the wine was ‘super low’ (4 %) in alcohol, and the results only showed significant differences between those offered drinks labelled as ‘super low’ compared with ‘regular’. The findings of another recent experimental study by Masson and Aurier(Reference Masson and Aurier31), who performed a between-subjects comparison to measure the difference of low-alcohol (9 % alcohol) with standard wine consumption (13·5 % alcohol), and a within-subjects comparison to measure the difference between a blinded and an informed condition, showed that no overcompensation was present in either of the comparisons. The present study confirms these findings and further adds to this by showing the comparison between three conditions (low-alcohol, low-alcohol blinded and control) simultaneously. The present findings are also in line with the self-reported outcomes from a study conducted by Saliba and Moran(Reference Saliba and Moran32) which showed that people who perceived wine as healthy reported higher frequency, but not higher volume, of consumption. Importantly, these findings resulted in a decreased alcohol intake in the present study; participants who drank low-alcohol wine consumed approximately 30 % less alcohol as compared with those who drank the standard wine. When comparing the alcohol intake for the average amount of wine consumed (162 ml), those who drank low-alcohol wine consumed approximately one standard unit, whereas those who drank the standard wine consumed 1·6 standard units. This has important practical implications; the WHO defines a standard drink as one containing 10 g of alcohol. Consequently, for a standard (12·5 %) wine, 100 ml of wine equals one standard drink. However, a standard serve of wine at a restaurant or bar is 150 ml, and therefore much more than one standard drink. Interestingly, when drinking a low-alcohol wine of 8 %, one glass of wine (a standard serve of 150 ml) now equals one standard drink.
Low-alcohol beverages have been discussed to pose a risk for current abstainers, particularly for adolescents, as they might encourage them to consume an alcoholic beverage(Reference Saliba and Moran32,Reference Sornpaisarn, Shield and Cohen33) . Future research is needed to further investigate the effect of low-alcohol labelling on current abstainers and on individuals who are trying to limit alcohol intake or abstain from alcohol. Furthermore, future research may wish to investigate the effect of terminology and labelling on perceived strength and consumption behaviour.
Strengths and limitations
Previously, wines have been classified as de-alcoholised (<0·5 %), low-alcohol (0·5–1·2 %), reduced alcohol (1·2–6·5 %) and lower alcohol wine (5·5–10·5 %)(Reference Pickering28). Therefore, one could argue whether the term low-alcohol wine was correctly used in the current study. However, the classification of wines with reduced alcohol content is not explicit and varies between countries(Reference Saliba, Ovington and Moran7). It was assumed that the term low-alcohol wine may be perceived as a more familiar term. Consequently, in the present study, the term ‘low-alcohol wine’ was used, to refer to a wine with 8 % alcohol content and participants in the study conditions were adequately informed about the percentage of alcohol content. As some have suggested a significant difference in wine liking when the alcoholic content was reduced with 4 % or less v. a reduction with 5·5 % or more(Reference Meillon, Viala and Medel12), further research will need to investigate the effect of different levels of alcohol reduction on consumer’s perception and consumption behaviour.
Power analysis indicates that our sample size was sufficient to detect medium to large effects. Consequently, it is possible that small effects may have remained undetected. However, there is no indication or trend that low-alcohol labelling would have led to overconsumption since the mean values for wine consumed in the low-alcohol and control (standard wine) condition were very similar. The amount of wine provided and the study duration were standardised. However, the amount of time a person has available might be an important factor influencing consumption behaviour. As time and the amount of wine were limited, one cannot exclude that consumption behaviours would have differed between the conditions in other consumption settings, for example, in a bar or at home(Reference Meillon, Urbano and Guillot34). Ceiling effects may have occurred as a consequence of the standardised amount of wine provided. Nine of the participants consumed all of the provided wine (300 ml). However, the interpretation of results remained unchanged, if those participants were excluded from analysis. A sheet of paper was wrapped around the wine bottle in order to avoid a visual anchoring effect. However, since the participants served themselves, the weight of the bottle may still have caused an anchoring effect. Considering that the weight of the glass bottle is high relative to the weight of the wine, this effect is presumably small, however. By reporting empirical evidence on consumption behaviour, this study contributes to the existing literature, which mainly focused on self-reporting measures regarding acceptance and consumer demand for low-alcohol wine. Further research is needed to investigate whether these findings can be replicated in a larger sample and whether they can be confirmed in different settings.
Conclusions
This experimental study on low-alcohol wine perception and consumption showed that participants liked and consumed the low-alcohol wine in a similar fashion as the participants who tasted standard wine. The main reasons for the high ratings may be the recent improvements in the sensory quality and the increased health consciousness among consumers, resulting in an increase in consumer acceptance of wines with a reduced alcohol content. No overcompensation was found, resulting in an important difference in the consumed amount of pure alcohol for those who drank low-alcohol wine as compared with those who drank the standard wine. These findings suggest a potential market for low-alcohol wine. This is particularly of interest due to its important health and social benefits for consumers and the potential for the wine industry to meet consumer demand.
Acknowledgements
Acknowledgements: The authors appreciate all participants in this study for their cooperation. The authors would also like to acknowledge and thank the HMRI for their assistance with the recruitment through their media release. Lastly, the authors would like to acknowledge Tamburlaine Wines, NSW, Australia, who produced and provided the wine for the current study. Financial support: T.B. and K.D. are supported by the Priority Research Centre for Physical Activity and Nutrition and the Faculty of Health and Medicine, the University of Newcastle. The collaboration between the researchers was supported by the Australia–Germany Joint Research Co-operation Scheme, an initiative of Universities Australia and the German Academic Exchange Service (DAAD). No other funding was obtained for this research. Conflict of interest: None. Authorship: T.B., S.D. and E.F. conceptualised the study, developed the statistical analysis plan and conducted the analysis. E.F. drafted the initial manuscript. T.B. and E.F. coordinated and supervised data collection, and T.B., K.D., S.D. and M.W. contributed to the manuscript drafting. T.B., K.D., S.D. and M.W. edited and provided critical review of manuscript. All authors approved the final manuscript as submitted. Ethics of human subject participation: This study was conducted according to the guidelines laid down in the Declaration of Helsinki, and all procedures involving research study participants were approved by the Human Research Ethics Committee of the University of Newcastle (H-2017-0419). Written informed consent was obtained from all subjects. The study manager had a valid ‘Responsible Service of Alcohol’ certificate, which allows serving alcohol in Australia.
Supplementary material
For supplementary material accompanying this paper visit https://doi.org/10.1017/S1368980019005238


