


Excess dietary salt intake causes high blood pressure and is associated with increased risks of stroke and CHD(Reference Strazzullo, D’Elia and Kandala1). The WHO recommends a maximum intake of 5 g salt/d(2). However, dietary salt consumption above the recommended level is the norm for most populations around the world(Reference Liu, Ho and Tang3,Reference Galletti, Agabiti-Rosei and Bernini4) . In South Africa, the median salt intake is 7·2 g/d(Reference Swanepoel, Schutte and Cockeran5), with the major dietary contributors being processed foods, such as bread, sausages, salami, pies, packaged powdered soup, canned soup, French fries and potato crisps(Reference Charlton, Steyn and Levitt6). Furthermore, according to the 2012 South African National Health and Nutrition Examination Survey (SANHANES-1), 31·8 % of the population had hypertension (blood pressure above 140/90 mmHg and/or taking hypertension medication)(Reference Shisana, Labadarios and Rehle7), indicating a need for reductions in population salt consumption.
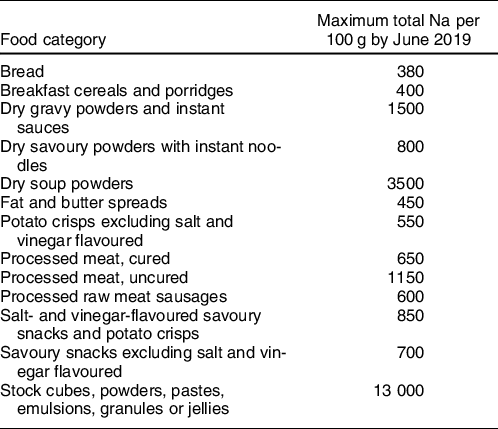
In 2013, South Africa became the first country to implement legislation that sets mandatory limits for the maximum Na content in a wide range of processed foods, as part of strategies to reduce salt intake among its population(8,9) . The legislation contained a stepped approach, with manufacturers given until 30 June 2016 to meet one set of category-based targets, and another 3 years, until 30 June 2019, to meet more stringent requirements. Thirteen food categories which are high in salt and are regularly consumed by South Africans were targeted: bread, breakfast cereals and porridges, fat and butter spreads, savoury snacks, salt- and vinegar-flavoured savoury snacks, flavoured potato crisps, processed meat (cured and uncured), meat sausages, dry soup powders, dry gravy powders, dry instant savoury sauces and powders and stock cubes, powders and pastes(Reference Peters, Dunford and Ware10). A previous study showed that two-thirds of targeted food items already met the 2016 maximum Na limits during early stages of policy implementation(Reference Peters, Dunford and Ware10). However, these analyses did not consider the relative contribution of foods items to food purchasing.
Linking of supermarket purchasing data with nutrient composition information is increasingly used to identify major dietary contributors to energy and nutrients, and changes in purchasing patterns over time(2,Reference Poti, Dunford and Popkin11,Reference Eyles and Mhurchu12) . The aim of the present analysis was to assess the contribution of different packaged food groups to total salt purchases in South Africa, using a large supermarket sales data set linked to product-specific nutrient information between January and December 2018. Then, to evaluate the potential impact of the salt reformulation legislation, we modelled the estimated reduction in salt purchases if all products purchased adhered to the 2019 maximum Na limits specified by South African legislation.
Materials and methods
Study population
This study utilised purchasing data from members of the Vitality programme, run by Discovery, a private health insurer. Data were collected between 1 January 2018 and 31 December 2018. The Vitality programme incentivises its members to eat healthily, engage in regular exercise and have regular health checks(13). The programme rewards its members for purchasing healthy products from Pick n Pay and Woolworths, by providing up to 25 % cashback. These two food retail partners of Vitality represent about 17 % of the retail food market share in South Africa, with more than 1000 stores countrywide(14,15) .
Supermarket purchasing data
Vitality members are provided with one card per household that they scan at Pick n Pay and Woolworths. In addition, the card is linked with the retailer’s loyalty card at Woolworths. Purchasing data, at the household level, were provided by Discovery. Households were excluded from analyses if their annual purchases were <8000 South African Rand (R) (equivalent to US $439 at 30 April 2020) or above R150 000 (equivalent to US $8229 at 30 April 2020), where 50 % or more of annual purchases were from only one food category, and if they had <7 months of purchasing data. These cut-offs were applied by Discovery based on elements such as assessing the histogram of amounts spent whereby an absolute top end could be a relatively wealthy individual spending ∼R3000 per month, buying all of their food at the partner supermarket, thus spending R150k for the year, while at the bottom end someone less well-off spending ∼R700 per month, maybe also shopping elsewhere. Barcodes of products were provided by Discovery and available for linkage to product level nutrition information.
Product nutrition information
Nutrition information for packaged products was obtained from the South African FoodSwitch database. The products did not include processed meats sold at deli and unpackaged fruit and vegetables. This database included data collected between 2015 and 2018 through in-store surveys and crowdsourcing of information reported on food labels(Reference Dunford, Trevena and Goodsell16,Reference Coyle, Ndanuko and Singh17) . In-store surveys were conducted in Johannesburg, in collaboration with Discovery, in their retail partner stores with a large market share of the South African economy: Shoprite Checkers (20 % market share), Pick n Pay (13 %), Spar (9·5 %) and Woolworths (3·7 %)(15). Researchers used The George Institute’s Data Collector smartphone application to capture packaged product information including barcodes, product name, ingredients list and nutritional information(18). Protocols for data entry and quality checks have been described previously(Reference Dunford, Trevena and Goodsell16).
Linking purchasing data to nutrition composition information
Vitality purchasing data were linked to the FoodSwitch data using the product barcode as the identifying variable. We excluded products with zero or negative Na quantities, no pack size information and food categories for which the Nutrition Information Panel (NIP) is not usually displayed, such as alcohol, baking aids and black/herbal teas, as well as foods intended for infants and babies. However, products with missing Na values, and which were eligible for inclusion, were retained, and Na values were imputed as described below.
Food categorisation
Food and beverage products were categorised into food groups and food categories in accordance with the Global Food Monitoring Group categorisation system, a standardised system that classifies foods and beverages into groups (e.g. bread and bakery products), categories (e.g. bread) and subcategories (e.g. flat bread) to enable comparative assessment of nutrient composition of processed foods worldwide(Reference Dunford, Webster and Metzler19).
Statistical analyses
Na content, which was available in mg/100 g, was converted to salt in kg by using the formula: Na (mg) × 2·5/100 000. We imputed missing Na values for 1576 products out of 9562 products using the median Na value for similar products that were in the same food category at the finest level of categorisation. The amount of salt purchased was determined by using the salt content, pack size and number of units purchased and summed across food groups.
To assess the impact of the legislated maximum salt limits on salt purchased, we assumed that products in the FoodSwitch database that exceeded the maximum limits (Table 1) would be reformulated to meet the legislated targets for 2019. For products that were below or equal to the target, we assumed that Na levels remained the same. Projected total and percentage contributions to salt purchase after being assumed complete implementation of legislation in June 2019 were thus determined. Statistical analysis was performed using Stata version 15.1.
Table 1 Maximum sodium levels allowed in specified food categories by 30 June 2019
Results
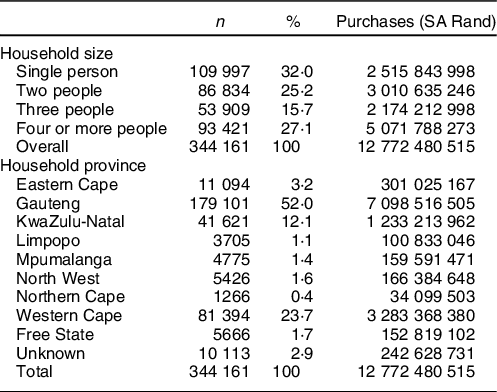
A total of 9562 products with complete purchase and nutrient information were available for analysis. The products represented R12·8 billion worth of purchases made by 344 161 households. The majority of purchases were from households comprising four or more members. Most purchases were made in Gauteng Province (R7·1 billion) followed by Western Cape Province (R3·2 billion), reflecting the large population sizes of these provinces (Table 2). Of the 9562 food and beverage products, 956 (10 %) were in food categories covered by the legislation.
Table 2 Demographics and annual salt purchases of Discovery Vitality members
Contribution of food group and food categories to total salt purchased
A total of 264 583 kg of salt, excluding plain salt, was purchased annually. The highest food group contributors to total annual salt purchases were bread and bakery products (23·3 %); meat and meat products (19 %); dairy (12·2 %); sauces, dressings, spreads and dips (11·8 %); and convenience foods (8·7 %) (Table 3). The highest food category contributors were bread (18·6 %), processed meat (18·6 %), sauces (7·3 %), processed vegetables (7·1 %), cheese (6·6 %), crisps and snacks (3·8 %), and ready meals (3·7 %). The total quantity of salt purchases projected under conditions where the salt legislation was fully complied with was 250 346 kg, a reduction of 14 238 kg (5·4 %). Bread was projected to be responsible for the greatest reduction comprising 15·1 % of the total reduction, followed by soup (11·4 %), crisps and snacks (10·6 %) and breakfast cereals (6·6 %) (Fig. 1).
Table 3 Quantity of salt purchased in different food categories in 2018 and as projected after legislated reformulation
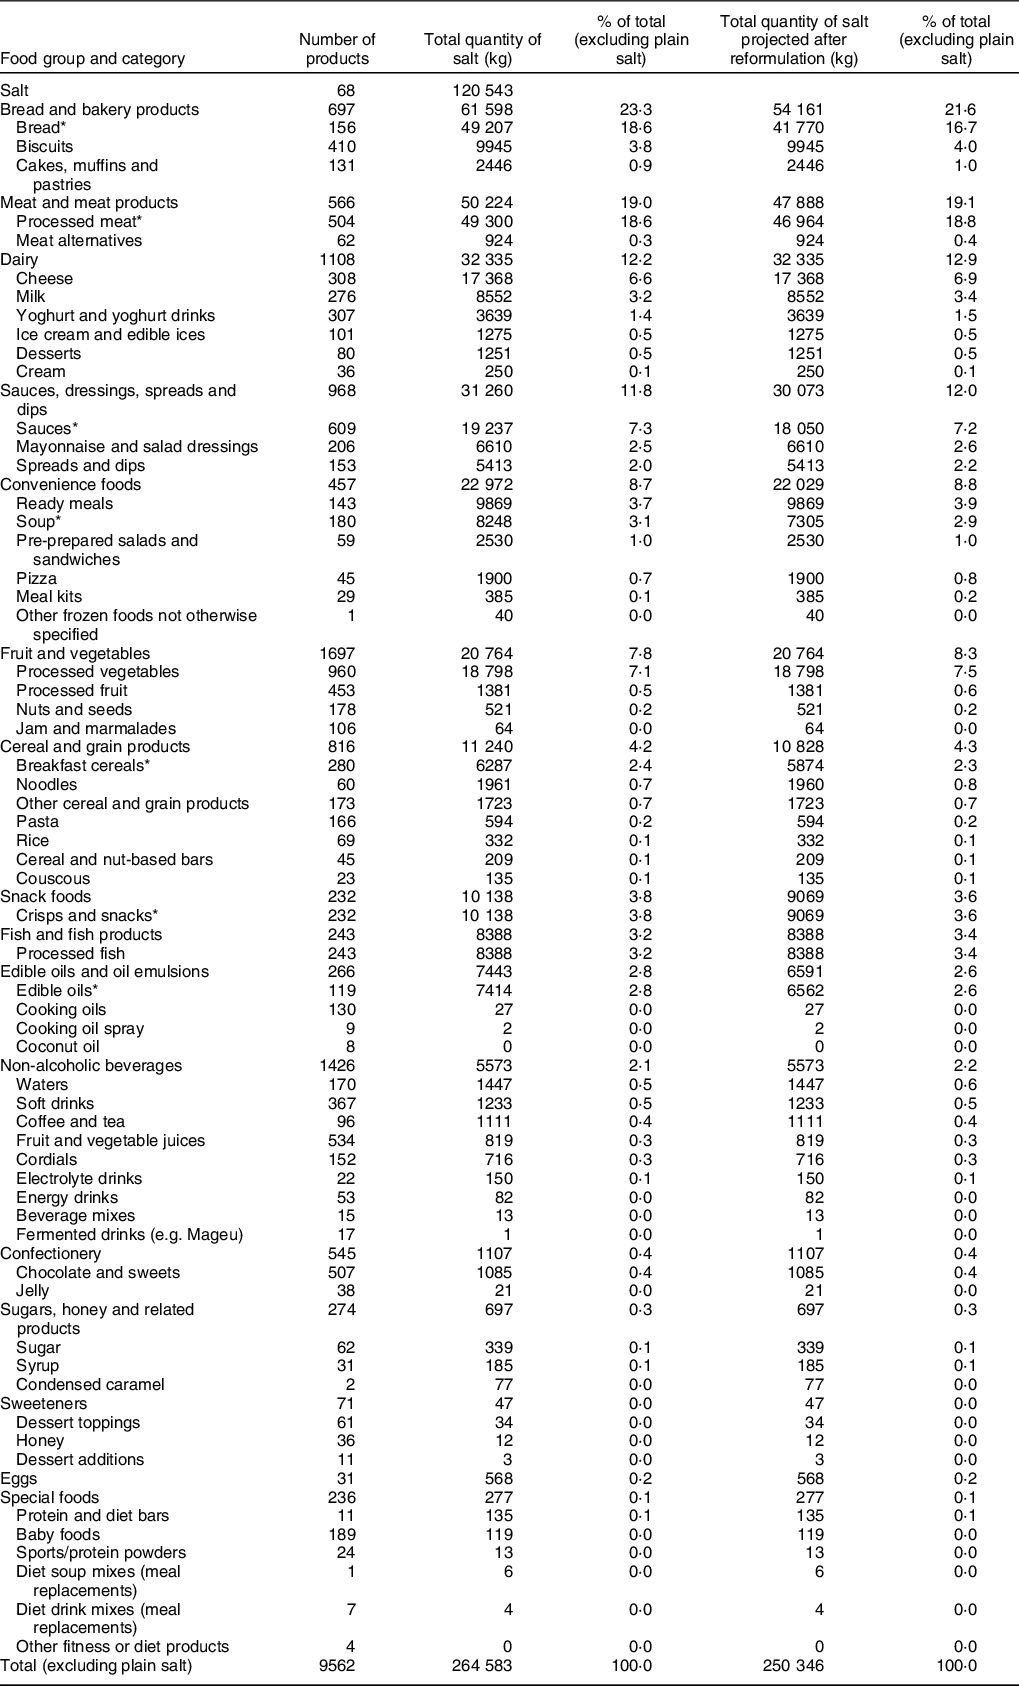
* Food categories with reformulation targets.
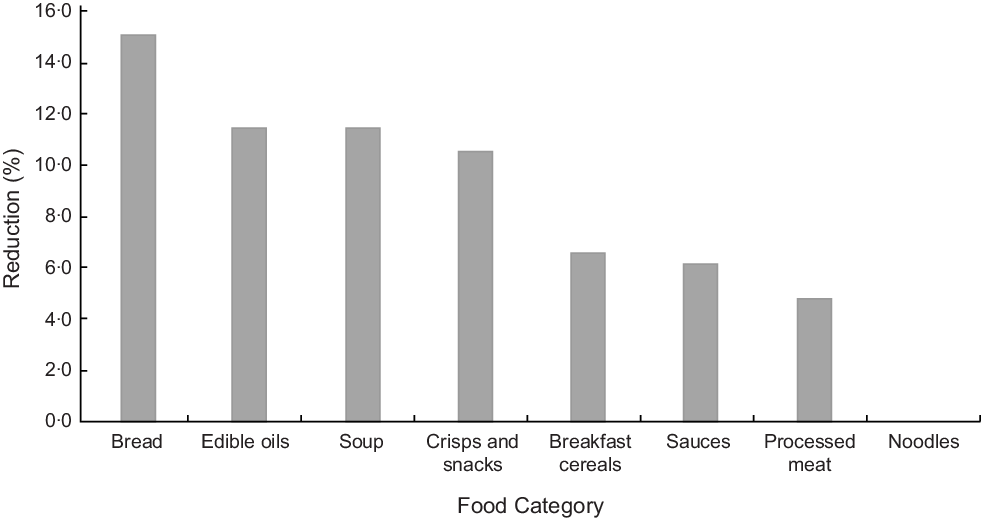
Fig. 1 Percentage reduction in salt projected after reformulation in June 2019 in different food categories
Discussion
Findings from this study indicate that household purchases of Na would reduce by 5·4 % from 2018 levels after complete successful implementation of the mandatory salt legislation. Given that the South African maximum salt legislation only targets reformulation for processed foods, other policy interventions may be needed to achieve the WHO 30 % salt reduction target by 2025(20).
South Africa has been recognised as a world leader in introducing legislation as part of population salt reduction strategies(Reference Trieu, Neal and Hawkes21). Frameworks for analysing and optimising the performance of public health regulation(Reference Jones, Neal and Reeve22) not only identify the value of mandatory over voluntary approaches to achieve industry adherence but also highlight that public health impact will depend on the scope of products included, and the strength of the nutrient thresholds set. Salt reduction has been achieved in the UK through voluntary salt reduction in processed foods, negotiated with the food industry. An estimated 7 % reduction in salt content of processed foods was achieved between 2006 and 2011 after voluntary salt reduction targets were introduced for various food categories(Reference Eyles, Webster and Jebb23). However, it is important to note that in the UK case, the industry salt reduction occurred hand in hand with a social marketing campaign to change consumer behaviour which led to a 10 % reduction in salt intakes(Reference Shankar, Brambila-Macias and Traill24). This implies that the average salt levels in foods purchased were lowered and consumers were encouraged to make healthier food choices through the social marketing campaign.
While the mandatory nature of South Africa’s regulation is important, the effectiveness of regulation is also impacted by other factors. For example, the scope of legislation (i.e. the products covered) must be sufficiently broad to achieve the desired effects. In the present study, the major food category contributors of salt purchases include bread, processed meat, cheese, sauces and canned vegetables. Even though cheese and canned vegetables contribute significant amounts to Na purchases, they are not currently covered by South African legislation. There is a need to cover these and other product categories in order to generate greater reductions. Feasibility of salt reduction in cheese has been demonstrated in different studies(Reference Murtaza, Huma and Sameen25,Reference Gomes, Cruz and Cadena26) , with minimal effects on consumer acceptability. Canned vegetables contain high salt content and have been proposed as a target for salt reduction in Canada(Reference Arcand, Au and Schermel27). Consequently, including canned vegetables and cheese in the salt legislation in South Africa would further enhance reduction in population salt intake.
Dietary sources of salt differ substantially between countries(Reference Bhat, Marklund and Henry28). For instance, in Brazil, China, Costa Rica, Guatemala, India, Japan, Mozambique and Romania, most of the salt consumed is from discretionary sources. On the other hand, bread and bakery products and meat are top contributors of dietary salt in European countries, USA, Australia and New Zealand, while sauces and dressings contribute majority of the salt in Japan. This highlights the importance to conduct country-specific analyses using contemporary purchasing data. In New Zealand, bread, processed meat, savoury sauces and cheese were identified as categories with high contribution to salt purchases in a study comprising 16 800 packaged processed food and beverages(Reference Eyles and Mhurchu12). On the other hand, bread, milk, cheese, bacon and sauces accounted for more than one-third of the salt purchases in a study of 44 372 food products in the UK(Reference Ni Mhurchu, Capelin and Dunford29). It should be noted that our study only looked at projected reductions. For these to be achieved in practice, legislation must also be monitored and enforced, with meaningful sanctions for products that exceed legislated maximums.
In South Africa, in addition to processed foods, salt added during cooking or at the table accounts for a large proportion of salt intake in the population(Reference Menyanu, Charlton and Ware30). In our study, table salt purchases contributed 120 543 kg of salt which was about half the total purchased in processed foods. To reduce discretionary salt consumption among the South African population, various behaviour change programmes through mass media campaigns have been formulated with studies showing that participants were taking steps to control discretionary salt intake(Reference Wentzel-Viljoen, Steyn and Lombard31). Substitution of regular salt for a reduced Na alternative would be another option since this has been shown that it has potential to reduce deaths from CVD(Reference Marklund, Singh and Greer32).
In addition to legislation, other efforts are required from governments and public health bodies to reduce salt consumption. These might include ensuring compliance with salt legislation in practice in order to meet these projected benefits; strengthening and expanding salt legislation to have stronger targets and cover more products and ensuring it is part of a comprehensive strategy as recommended by WHO to achieve population salt reduction in the SHAKE package. These include surveillance through measuring and monitoring salt use; harnessing industry to promote the reformulation of foods and meals to contain less salt; adopting standards for effective labelling and marketing of food; empowering individuals to eat less salt through education and communication and supporting food environment that promotes healthy eating(20).
Ultimately, the impact of salt legislation is best measured through assessment of the reduction in the burden of CVD and other associated health care costs. In a previous modelling study to assess the effect of Na reduction in South Africa, it was estimated that a reduction of 0·85 g of Na intake per person per d would result in prevention of 7400 CVD deaths and 4300 non-fatal strokes annually resulting to cost savings of up to R300 million(Reference Bertram, Steyn and Wentzel-Viljoen33). A longitudinal study using Discovery Vitality members’ purchasing data linked to their health outcomes would provide valuable information on the effect of salt reduction on health.
Major strengths of this study include the use of a large data set of processed food and beverage product purchases linked to nutrition information data. Availability of per capita salt in foods purchases, rather than household purchases, would have enabled a better estimate of salt purchases for population subsets. Because this study utilised data from members of a health insurance company who receive incentives for purchasing healthier products, recorded purchasing behaviour may not be representative of the entire South African population. The representativeness of purchases included in this study may be affected by (1) the inclusion of two retailers representing a minority of the food retail market share and (2) the notion that customers of Pick ‘n Pay and Woolworth may over-represent those in the higher socio-economic population groups. The 5·4 % reduction may be an underestimate of what remains to be achieved nationally because the Vitality members are likely already buying healthier products, and the gains from shifting to products achieving the regulated targets might therefore be smaller. This study included only packaged foods and not unpackaged foods such as deli meats. We thereby omitted some contributors to salt intake, such as processed meats available at deli counters. As our study has shown, processed meats are a key contributor to salt intake, meaning that our projected reductions are a potential underestimate of the effect of the legislated maximum salt limits. Comparison with baseline levels of salt purchases before the introduction in 2013 of the legislated maximum salt limits would better enable a comparison of the overall effects of this legislation to international efforts in this area. Last, the unavailability of longitudinal tracking data for this study means that we cannot quantify any reformulation that may have taken place prior to this analysis.
In conclusion, this study has highlighted the food groups and food categories that are major contributors of salt purchases in South African diets. We have demonstrated that, if South African salt legislation was fully complied with, a further 5·4 % reduction in salt purchases would be achieved from processed foods. This excludes salt contributed by unprocessed foods and discretionary salt. While these data cannot be directly compared with consumption data, the South African maximum salt legislation only targets reformulation for processed foods, suggesting that other policy interventions may also be needed to achieve the WHO 30 % salt reduction target.
Acknowledgements
Acknowledgements: N/A. Financial support: B.N. is supported by a National Health and Medical Research Council of Australia Principal Research Fellowship (APP1106947). S.A.E.P. is supported by a UK Medical Research Council Skills Development Fellowship (MR/P014550/1). M.W. is supported by a National Health and Medical Research Council Program Grant (APP1149987). The funders had no role in the design, analysis or writing of this article. Conflict of interest: M.W. is a consultant to Amgen and Kyowa Hakko Kirin; All other authors: None. Authorship: The authors’ contributions are as follows: B.N., J.H.Y.W., S.A.E.P. and M.W. contributed to the study design; T.H., J.M. and A.W. contributed to data acquisition; R.N. and M.S. conducted data analyses; R.N. drafted the manuscript; all authors revised the manuscript, read and approved the final version. Ethics of human subject participation: N/A.


