Self-reported weight and height are frequently used to calculate BMI to quantify overweight and obesity in epidemiological studies, because of the ease and efficiency in gathering the information through questionnaires or interviews. However, self-reported values are associated with limitations such as social desirability bias, difficulties with recall or limited access to scales for weight assessment. Thus, it remains important to assess the extent of error present in self-reported data before applying these measures in epidemiological studies.
Most previous studies have reported that adults tend to underestimate their body weight( Reference Anai, Ueda and Harada 1 – Reference Spencer, Appleby and Davey 3 ). The discrepancy between self-reported and measured weights has been shown to vary by sociodemographic characteristics of the respondent (e.g. sex, weight, race/ethnicity, age)( Reference Palta, Prineas and Berman 4 – Reference Dijkshoorn, Ujcic-Voortman and Viet 6 ). For example, compared with normal-weight women, obese women were found more likely to under-report their weight and underweight women more likely to over-report their weight( Reference Stommel and Schoenborn 7 – Reference May, Barnes and Forouhi 9 ). Regarding sex and ethnic difference in reporting body weight, results from previous studies have not been consistent( Reference Johnson, Bouchard and Newton 5 , Reference Gillum and Sempos 10 – Reference Griebeler, Levis and Beringer 12 ). Findings have also been conflicting regarding the impact of age on reporting errors. Some studies reported that the difference in actual v. self-reported weight by BMI appeared to increase with age( Reference Grossschadl, Haditsch and Stronegger 13 , Reference Kuczmarski, Kuczmarski and Najjar 14 ). Stommel and Schoenborn reported a U-shaped association which suggested that younger and older respondents were more likely to underestimate their weight than respondents aged 42–55 years( Reference Stommel and Schoenborn 7 ). Other studies reported that age had no influence on the accuracy of predicted v. measured weight( Reference Finardi, Nickel and Koller 15 , Reference Dahl, Hassing and Fransson 16 ). A US study using a nationally representative sample also reported that non-Hispanic Black and Mexican-American women were more likely to overestimate their weight compared with their non-Hispanic White counterparts; and women with higher education level or higher annual income were more likely to underestimate their weight than their counterparts( Reference Villanueva 17 ). To our knowledge, all but one of the previous studies( Reference Dahl, Hassing and Fransson 16 ) used cross-sectional data. A cross-sectional design is unable to distinguish whether age differences in accuracy of self-reporting weight remain stable over time.
In the Women’s Health Initiative Observational Study (WHI-OS), each woman’s weight was measured at enrolment (1993–1998) and collected again at year 1 by self-reported questionnaire. In a subset of women who participated in the WHI Long Life Study (LLS), both measured and self-reported weight were collected about 20 years later between 2013 and 2014. We used the WHI-OS data as a primary data set to assess the extent of error present in the self-reported data among postmenopausal women, examining the relationships of the difference between self-reported and measured weights with BMI and other individual characteristics. We further examined whether correction for self-reported v. clinic measured weight was influenced by sociodemographic characteristics of respondents. We analysed the sub-cohort data (LLS) collected about 20 years later to assess whether the discrepancy between self-reported and measured weight changed over time.
Methods
Women’s Health Initiative
The WHI was designed to address the major causes of morbidity and mortality in postmenopausal women( 18 ). Details of the scientific rationale, eligibility requirements and baseline characteristics of the participants in the WHI have been published elsewhere( Reference Hays, Hunt and Hubbell 19 – Reference Stefanick, Cochrane and Hsia 23 ). Briefly, a total of 161 808 women aged 50–79 years were recruited from forty clinical centres throughout the USA between 1 September 1993 and 31 December 1998. The WHI includes both clinical trial (CT) and observational study (OS) components. Participants in the OS included 93 676 women who were screened for the CT but were ineligible or unwilling to participate, or who were recruited through a direct invitation for the OS. The study was approved by institutional review boards at all forty clinical centres and at the coordinating centre. All participants in WHI gave written informed consent.
All participants (93 676 women) in the WHI-OS were considered as a primary data set for these analyses. We excluded women with missing values for measured or self-reported weight (n 7749) and women with prevalent cancer other than non-melanoma skin cancer at baseline (n 10 194) because cancer diagnosis is commonly associated with weight loss which may occur many years after diagnosis, if cancer recurs. Since there is a one-year gap between self-reported and measured weight for the WHI-OS data, we also excluded women with weight change beyond 5 sd (n 326). These observations were considered outliers or extreme values which may occur due to illness experience during the one-year gap. Finally, 75 336 women remained in the primary data analysis. Further, we did a sensitivity analysis by excluding an additional 3191 women who were diagnosed with cancer, diabetes or CVD (including myocardial infarction, coronary revascularization and stroke) during the first year of follow-up.
In addition, we performed a separate analysis on 6596 women in the WHI enrolled in the LLS, who had both self-reported and measured weight collected about 20 years later (2013–2014). Women in the WHI-OS made up 20 % of the LLS cohort (n 1269). The remaining 80 % of the LLS were from the WHI-CT. We excluded women with missing values of self-reported or measured weight (n 318) and women with extreme values (difference between self-reported and measured weight during 2013–2014 beyond 5 sd; n 42). Finally, 6236 women remained in the secondary data analysis.
Weight measurement and discrepancy estimation
Weights were measured in the WHI-OS women at baseline during clinic visits by trained research staff using standardized protocols that included measurement on balance-beam scales with light clothing and removal of shoes. Weights for the LLS were measured in 2013–2014 in the homes of participants by trained personnel using the same standardized protocol and portable balance-beam scales. Self-reported weight at year 1 and in LLS in 2013–2014 was collected by answering the mailed survey question, ‘What is your current weight (in pounds)?’ Discrepancy between self-reported and measured weight was calculated by subtracting measured weight from self-reported weight.
Characteristics of reported weight discrepancy
Based on a review of relevant weight estimation literature, we considered potential characteristics that might influence the relationship between measured and self-reported body weight. These characteristics included age (in years) at enrolment or during 2013–2014, measured weight (at baseline and 2013–2014) and other sociodemographic factors at baseline: race/ethnicity (American Indian or Alaskan Native; Asian or Pacific Islander; Black or African-American; Hispanic/Latino; non-Hispanic White; and other), education (high school or less; some college/technical training; college or higher), smoking status (never; former; current), alcohol intake (non-drinker; past drinker; current and <7 drinks/week; current and ≥7 drinks/week), history of hormone therapy use (none; oestrogen alone; oestrogen plus progestin; mixed, i.e. oestrogen alone and oestrogen plus progestin), total energy intake, total Healthy Eating Index (HEI)-2005 score, physical activity, marital status, family income, and history of diabetes, hypertension and CVD. Total energy intake was derived from the FFQ in the WHI. Total HEI-2005 score was a measure of diet quality that assesses conformance to the 2005 Dietary Guidelines for Americans. Physical activity was determined by asking participants how often they were currently participating in different types of physical activities (mild; moderate; strenuous or very hard exercise) and the frequency (from never to ≥5 d/week) and duration (<20 min; 20–39 min; 40–59 min; ≥1 h) of each exercise session.
Statistical analysis
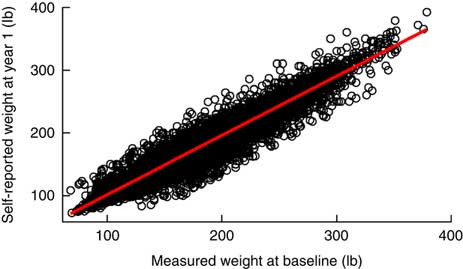
First, we plotted the linear relationship between self-reported weights and measured weights (Fig. 1) and the Bland–Altman difference plot( Reference Bland and Altman 24 ) to examine visually the agreement between measured and self-reported weights. In the Bland–Altman difference plot, we used measured weight as a standard measurement to plot the difference between self-reported and measured weights against the measured weight (Fig. 2).
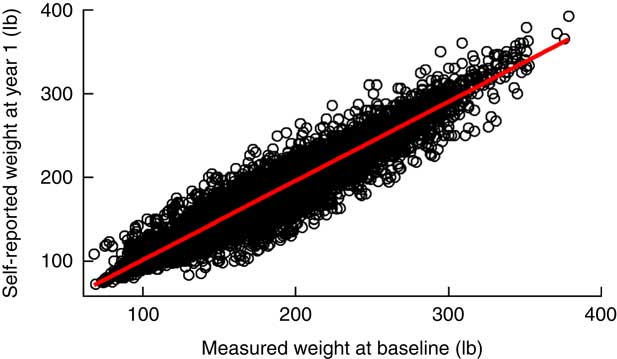
Fig. 1 (colour online) Relationship between self-reported and measured weights*, with an overall regression line (![]() ), among 75 336 women participating in the Women’s Health Initiative Observational Study (WHI-OS). *1 lb=0·454 kg
), among 75 336 women participating in the Women’s Health Initiative Observational Study (WHI-OS). *1 lb=0·454 kg
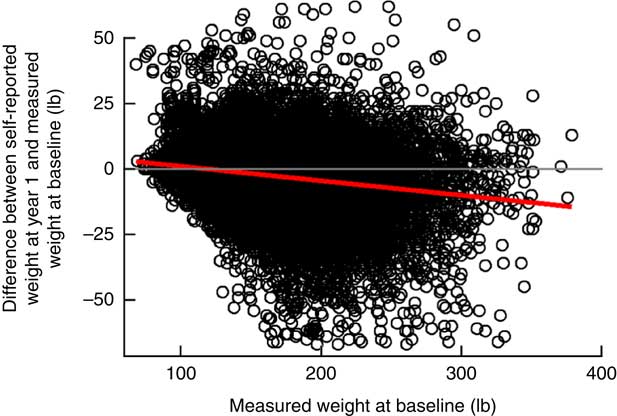
Fig. 2 (colour online) Bland–Altman difference plot between self-reported and measured weights*, with an overall regression line (![]() ), among 75 336 women participating in the Women’s Health Initiative Observational Study (WHI-OS); (
), among 75 336 women participating in the Women’s Health Initiative Observational Study (WHI-OS); (![]() ) represents the line of no difference. *1 lb=0·454 kg
) represents the line of no difference. *1 lb=0·454 kg
Second, multiple linear regression was used to examine any potential influence of sociodemographic, lifestyle and health characteristics on the difference between self-reported and measured weights separately for WHI-OS data at baseline and year 1 and for LLS data collected during the 2013–2014 follow-up.
We then built two linear statistical prediction models based on the WHI-OS data with measured weight as the dependent variable and self-reported weight and other sociodemographic characteristics as predictors. One model was adjusted for only age, race/ethnicity and education (simple adjustment model); the other was adjusted for all significant sociodemographic determinants including age, race/ethnicity, education, smoking, alcohol, total energy intake, physical activity, income, hypertension and diabetes (full model). We used the prediction models to correct the self-reported weight and assessed whether the corrections improved the estimates of obesity status in the population. Further, we applied the same statistical model built from WHI-OS data to self-reported weight LLS data 20 years later to test the durability of the adjustment model.
In addition, we performed another analysis to build and validate our model within the same data set (WHI-OS). We randomly split the sample into two half samples (50:50). We used one of them as a training set to build the model and used the independent half as a test set to validate the model.
Finally, we also compared measured weights at both baseline and year 1 in the WHI-CT to examine whether the weight differences over time may be real, due to the one-year gap between measured and self-reported weight in the WHI-OS data.
Results
Agreement between self-reported and measured weights
The correlation between self-reported and measured weights was very high (r=0·97; Fig. 1). However, individual variability in discrepancy between measured and self-reported weights was sometimes large (Fig. 2). The Bland–Altman plot showed an inverse association between weight discrepancy and measured weight. That is, the higher the measured BMI, the more likely the weight was under-reported (Fig. 2).
Discrepancy between self-reported and measured weights
On average, in the WHI-OS data, women under-reported their weight by about 2 lb (0·91 kg; 95 % CI 1·96, 2·07 lb). Compared with normal-weight women, obese women were more likely to under-report their weight and underweight women were more likely to over-report (Table 1). Older and more educated women were more likely to under-report their weight than younger women. American Indian/Alaskan Native and Black/African-American women appeared to have the greatest underestimation, followed by non-Hispanic White women, Hispanic/Latino women and Asian/Pacific Islander women. By analysing the subset of LLS data collected 20 years later, we observed similar patterns to WHI-OS data (results not shown). Women under-reported their weight on average by 2·36 lb (1·07 kg) in the LLS data.
Table 1 Mean and sd for measured weight, self-reported weight and weight difference (self-reported minus measured weight) by sociodemographic factors, based on data at baseline and year 1 among 75 336 women participating in the Women’s Health Initiative Observational Study (WHI-OS)Footnote *

* The total number does not always sum to 75 336 due to missing data.
† 1 lb=0·454 kg.
Relationships of sociodemographic factors with weight discrepancy between self-reported and measured weights
The multivariable-adjusted model based on the WHI-OS data showed that greater under-reported weight was associated with higher measured BMI, older age, higher education, previous smoking, alcohol consumption, lower reported energy intake, higher reported physical activity, greater family income and having no history of hypertension or diabetes, relative to referent groups. An individual’s BMI status was the strongest predictor for the magnitude and direction of discrepancies. Although all race/ethnicity groups under-reported their weight, Asian/Pacific Islander, Black and Hispanic women under-reported less relative to White women in the multivariable model (Table 2). LLS data after 20 years showed similar patterns, although some of the characteristics became non-significant due to the small sample size (Table 3). By analysing a subset of women who had data in both WHI-OS and LLS (n 1269), we did not observe a significant difference in self-reported weight v. measured weight in the sub-cohort (results not shown).
Table 2 Relationships of sociodemographic factors with weight difference (self-reported weight at year 1 minus measured weight at baseline) among 75 336 women participating in the Women’s Health Initiative Observational Study (WHI-OS)Footnote *

Ref., referent category.
* All variables were adjusted for all the other variables in the table.
† BMI was based on measured weight.
Table 3 Relationships of sociodemographic factors with weight difference (self-reported weight minus measured weight during 2013–2014) among 6236 women participating in the Women’s Health Initiative Long Life Study (LLS)Footnote *
Ref., referent category.
* All variables were adjusted for all the other variables in the table.
† BMI was based on measured weight.
Assessment of obesity status based on measured, uncorrected and corrected self-reported weights
Table 4 shows the average value of corrected weight was 155·68 lb (70·6 kg; identical to that of the measured weight), regardless of adjusting by the simple model or the full model. Without adjustment, the proportion of obesity based on the self-reported weight was 21·34 %, about 2 % lower as compared with clinic measured weight. After correction by the simple model, the estimated proportion of obese status was closer to the proportion by measured weight (22·85 and 23·48 %, respectively). Compared with the simple adjustment model including age, race/ethnicity and education, additional adjustment for more sociodemographic characteristics did not improve the assessment of obesity status further (Table 4).
Table 4 Association between self-reported weight and distribution of overweight and obesity at year 1 among 75 336 women participating in the Women’s Health Initiative Observational Study (WHI-OS)

* 1 lb=0·454 kg.
† Adjusted for age, race/ethnicity and education.
‡ Adjusted for all significant sociodemographic determinants, including age, race/ethnicity, education, smoking, alcohol, total energy intake, physical activity, income, hypertension and diabetes.
Finally, we applied the simple adjustment model built from WHI-OS data to self-reported weight in LLS data between 2013 and 2014. We observed that the corrections for self-reported weight biases by the simple model improved estimates of obesity status (Table 5). Similarly, we assessed obesity status based on measured, uncorrected and corrected self-reported weights in a training sample (a random half of WHI-OS participants) and test sample (the remaining half; Table 6). The results show that correction for self-reported weight by a few individual characteristics (age, race/ethnicity and education) improved the accuracy of assessment of obesity status in postmenopausal women.
Table 5 Applying the simple model based on Women’s Health Initiative Observational Study (WHI-OS) data to self-reported weight in the Women’s Health Initiative Long Life Study (LLS) data between 2013 and 2014

* 1 lb=0·454 kg.
† Model included age, race/ethnicity and education built from WHI-OS data.
Table 6 Assessment of obesity status based on measured, uncorrected and corrected self-reported weights in a training sample (a random half of Women’s Health Initiative Observational Study (WHI-OS) participants) and test sample (the remaining half)

* 1 lb=0·454 kg.
† Model included age, race/ethnicity and education built from training sample.
Sensitivity analysis
A sensitivity analysis that excluded 3191 women who were diagnosed with cancer, diabetes or CVD during the first year of follow-up showed similar results. For example, in the sensitivity analysis, the correlation between self-reported and measured weights was the same (r=0·97). On average, women under-reported their weight by 1·92 lb (0·87 kg). Compared with normal-weight women, underweight women over-reported their weight by 3·83 lb (1·74 kg) and obese women under-reported their weight by 4·09 lb (1·86 kg) on average.
Further, we compared measured weights at both baseline and year 1 in the WHI-CT to examine whether the weight differences over time may be real, due to the one-year gap between measured and self-reported weights in the WHI-OS data. We observed an average of 0·46 lb (0·21 kg) reduction in weight between baseline and year 1 in the WHI-CT.
Discussion
In this large prospective study, we observed that on average postmenopausal women were relatively accurate in reporting body weight, with an average underestimate of weight of 2 lb (0·91 kg). The discrepancy between self-reported and measured weights varied by sociodemographic, lifestyle and health characteristics. An individual’s BMI status was the strongest predictor for the magnitude and direction of the discrepancy. Compared with women of normal weight who have no or negligible bias in self-reported weight, women who were underweight were more likely to over-report their weight, and obese women were more likely to under-report their weight. The higher the BMI or higher the degree of obesity, the greater the underestimation of weight. Despite the modest bias on average, self-report led to underestimate the prevalence of obesity by 2 %. A simple adjustment method (adjusting for age, race/ethnicity and education) to the self-reported weight improved the accuracy of assessment of obesity status in the population when using individual self-report data.
Our data confirmed the previously reported findings( Reference Anai, Ueda and Harada 1 – Reference Spencer, Appleby and Davey 3 ) that in general women tend to underestimate their weight, especially women who are obese. Our data also showed that underestimation of weight was slightly associated with increasing age, which supports evidence from most previous studies( Reference Stommel and Schoenborn 7 , Reference Grossschadl, Haditsch and Stronegger 13 , Reference Kuczmarski, Kuczmarski and Najjar 14 ).
Regarding race/ethnicity difference in reported biases, our data show that without adjustment, American Indian/Alaskan Native and Black/African-American women appeared to have the greatest underestimation of body weight, followed by non-Hispanic White women, Hispanic/Latino women and Asian/Pacific Islander women. However, the multivariable-adjusted model showed that non-Hispanic White and American Indian/Alaskan Native women had greater under-reporting of their weight than Asian/Pacific Islander, Black/African-American or Hispanic/Latino women. The difference for Black/African-American women before and after adjustment is likely due to the fact that this group had higher BMI than the other groups. Previous findings regarding race/ethnic differences have not been consistent( Reference Johnson, Bouchard and Newton 5 , Reference Gillum and Sempos 10 – Reference Griebeler, Levis and Beringer 12 ). For example, Johnson et al.( Reference Johnson, Bouchard and Newton 5 ) reported that the disparity in underestimation was greater in European-Americans than African-Americans in males, but not in females. Gillum and Sempos( Reference Gillum and Sempos 10 ) reported that Hispanic-Americans had the highest underestimation relative to other race/ethnicity groups. Some studies have reported that self-reported weight was greater than measured weight for US Hispanic/Latino populations( Reference Fernandez-Rhodes, Robinson and Sotres-Alvarez 11 ) or reported no difference between Hispanic White and non-Hispanic White women( Reference Griebeler, Levis and Beringer 12 ). Reasons for discrepancies across race/ethnic groups are not fully elucidated, but this may reflect less frequent self-monitoring of weight and/or lower access to or visits to medical practitioners that would generally include weight measurements, or it could reflect cultural differences in notions of ideal body size (or acceptance of lower or higher BMI).
Our data showed that greater under-reported weight was associated with higher education, alcohol consumption, lower total energy intake, more physical activity and higher family income, relative to referent groups. These findings may be explained by social desirability, which is a desire to conform to perceived societal norms. When using self-reported measures, people have a tendency to overestimate desirable traits and underestimate undesirable ones. Studies have shown that social desirability score was significantly correlated with the discrepancy between self-reported and measured body weights after adjusting for actual weight in women( Reference Larson 25 ).
Strengths of our study include its large sample, prospective design; comprehensive sociodemographic characteristics; and the availability of two data sets 20 years apart that allowed us to examine the robustness of our findings and test generalizability of the adjustment model built in a different time period. Another strength is that we were able to examine the accuracy of self-reported weight in multiple racial/ethnic groups in the same cohort. However, one limitation is the one-year time span between self-report and measured weight at baseline. Although we excluded a small number of women with extremes values (difference more than 5 sd) that may occur due to illness or other changes during the year, some women may experience actual weight changes during the time span which may contribute to an overestimate of the difference between self-reported and measured weight. A sensitivity analysis that excluded women diagnosed with major diseases between baseline and year 1 showed similar results. Results of additional analysis comparing measured weight at baseline and measured weight at year 1 suggest that the one-year gap did not have a meaningful influence on the results. The less than 0·5 lb (0·23 kg) reduction in weight in the WHI-CT may be due in part to the interventions (menopausal hormone therapy and low-fat dietary modification), which may not be applicable to the OS participants. An additional limitation is that self-reported and measured weight may not be totally independent. That is, women may remember what their measured weight was at the baseline clinic visit and then tend to report a very similar weight. Results are also limited to postmenopausal women in the USA and are likely not generalizable to other populations.
Conclusion
In conclusion, this large prospective study confirmed previously reported results that women demonstrate relatively valid estimates of body weight, with women who are underweight overestimating their body weight and women who are obese underestimating their body weight. Despite the modest bias on average, self-report led to an underestimate in the prevalence of obesity. In addition, these data show that even a simple correction for self-reported weight by individual age, race/ethnicity and education could improve the accuracy of assessment of obesity status, suggesting it is feasible to use a simple correction formula to correct for self-reported bias in assessment of overweight and obesity status when using self-reported data.
Acknowledgements
Acknowledgements: A short list of WHI investigators is given in the online supplementary material. Financial support: The WHI programme is funded by the National Heart, Lung, and Blood Institute, National Institutes of Health, US Department of Health and Human Services (contract numbers HHSN268201600018C, HHSN268201600001C, HHSN268201600002C, HHSN268201600003C and HHSN268201600004C). The current analysis received no specific grant from any funding agency in the public, commercial or not-for-profit sectors. Conflict of interest: There is no conflict of interest. Authorship: J.L. contributed to the study concept and design, acquisition of data, data management, analysis and interpretation of data, and drafting of the manuscript. K.L.M. contributed to the study concept and design, interpretation of data, and critical review and revision of the manuscript. Other co-authors contributed to interpretation of data and critical review and revision of the manuscript. J.L. is the guarantor of this work and, as such, had full access to all the data in the study and takes responsibility for the integrity of the data and the accuracy of the data analysis. Ethics of human subject participation: The WHI study was approved by institutional review boards at all forty clinical centres and at the coordinating centre. All participants in WHI gave written informed consent.
Supplementary material
To view supplementary material for this article, please visit https://doi.org/10.1017/S1368980018003002