


Despite the key role of self-monitoring in healthy lifestyle programmes, little has been reported on what impacts self-monitoring adherence over time( Reference Burke, Wang and Sevick 1 ). As a notable exception, self-monitoring adherence to recording dietary intake and physical activity has been compared between different modes of data entry, including mobile app, personal digital assistant, website and paper diary, with some studies demonstrating reduced adherence to a paper diary( Reference Beasley, Riley and Davis 2 – Reference Turner-McGrievy, Beets and Moore 5 ). Electronic assessment tools continue to evolve as personal digital assistants have been replaced by the increasing capabilities, ubiquity and penetration of mobile phones into every facet of daily living. Despite these technological advances, the question remains as to what factors impact adherence to self-monitoring and how the use of mobile technology can best support the role of self-monitoring in treatment settings. Towards this goal, we examine adherence to self-monitoring of healthy lifestyles through self-report on mobile phones and camera phone-based images of meals, i.e. photographic food records (PFR).
Mobile phones have become popular assessment and self-monitoring tools whereby individuals self-report dietary intake by selecting food items from a database and report on other health-related behaviours through mobile phone apps( Reference Free, Phillips and Galli 6 , Reference Heron and Smyth 7 ). By using a readily available data entry tool, participant burden is reduced and more frequent assessment that matches meal schedules becomes practical( Reference Thompson, Subar and Loria 8 ). This type of frequent reporting in situ is in line with ecological momentary assessment (EMA)( Reference Piasecki, Hufford and Solhan 9 , Reference Stone and Shiffman 10 ) that has been shown to reduce recall bias relative to more traditional retrospective report. Moreover, multiple types of data can be captured throughout the day to add context to dietary intake. For example, dietary intake can be assessed several times per day and physical activity can be assessed at the end of the day to summarize daily physical activity.
PFR are a natural extension of mobile dietary assessment using food-item databases that have been developed and pilot-tested in laboratory settings, often with research staff over several days( Reference Arsand, Tufano and Ralston 11 – Reference Wang, Kogashiwa and Ohta 19 ). The feasibility and acceptability of PFR need to be fully evaluated in real-world settings. Studies have taken place, but not typically, over evaluation periods of 6 months or longer that are in line with weight-loss interventions and other programmes that incorporate dietary assessment( Reference Turner-McGrievy, Beets and Moore 5 , Reference Reeves, Terranova and Eakin 20 ). To the best of our knowledge, studies have used PFR for 3 months( Reference Arsand, Froisland and Skrovseth 21 , Reference Froisland, Arsand and Skarderud 22 ) or less( Reference Brown, Chetty and Grimes 23 – Reference Wang, Kogashiwa and Kira 26 ). Similarly, we were only able to find two studies that have used personal digital assistants or mobile phones to assess dietary intake over a 6-month period( Reference Burke, Styn and Glanz 3 , Reference Arsand, Froisland and Skrovseth 21 ); other studies took place over 3 months or less( Reference Froisland, Arsand and Skarderud 22 , Reference Carter, Burley and Nykjaer 27 – Reference Mattila, Parkka and Hermersdorf 29 ).
In the present paper, we examine adherence to mobile assessment and PFR over 6 months as a key metric of feasibility and acceptability for mobile self-monitoring. Self-monitoring data were collected as part of a study that offered mothers a mobile app to help them balance the daily stressors of motherhood with healthy lifestyle choices. Study participants filled out EMA on diet, exercise, sleep, stress and mood through cell phone-based self-report, hereafter referred to as cellular EMA (CEMA), and recorded PFR. Recruitment efforts focused on ethnic minority women because we wanted to draw a sample of mothers who could greatly benefit from a self-monitoring mobile app. Ethnic minority women suffer from high rates of obesity, especially African-American women( Reference Flegal, Carroll and Kit 30 ), are heavily impacted by diet-related diseases, such as diabetes( Reference Narayan, Boyle and Thompson 31 , Reference Shai, Jiang and Manson 32 ), and are understudied with regard to self-monitoring tools( Reference Burke, Wang and Sevick 1 , Reference Arab, Tseng and Ang 33 ).
Hypothesizing was somewhat difficult due to a lack of studies on CEMA and PFR adherence but was aided by findings on adherence to follow-up study visits and self-report over time, especially regarding EMA. Thus, we anticipated decreases in CEMA and PFR adherence over time in line with decreases in EMA adherence that have been found in other populations( Reference Broderick, Schwartz and Shiffman 34 – Reference Courvoisier, Eid and Lischetzke 36 ). We also hypothesized lower adherence for younger participants; Fitzpatrick et al.( Reference Fitzpatrick, Jeffery and Johnson 37 ) found younger age to be associated with a greater likelihood of missed visits in a weight-loss intervention for adults with obesity and with type 2 diabetes. Hongu et al.( Reference Hongu, Pope and Bilgic 38 ) conducted a feasibility study where participants recorded PFR over six non-consecutive days and found that a greater number of PFR were recorded per day on weekends v. weekdays; similarly, we anticipated higher adherence on the weekend in our study. Lastly, our study collected anthropometric and biomarker measures of health, such as BMI. We hypothesized higher CEMA and PFR adherence among less healthy individuals as indicated by higher BMI and blood pressure, for example. Past studies have found higher CEMA adherence in patient v. non-patient populations for various health measures( Reference Mattila, Parkka and Hermersdorf 29 , Reference Broderick, Schwartz and Shiffman 34 – Reference Courvoisier, Eid and Lischetzke 36 , Reference Freedman, Lester and McNamara 39 – Reference Comulada 41 ). Even though our study participants were not patients, we hypothesized that less healthy individuals who joined our study were more motivated to self-monitor, and in turn adhere to CEMA and PFR, than healthier individuals.
Methods
Study design
Ethnic minority mothers were recruited to pilot-test a mobile app that was designed to help them maintain a healthy lifestyle by self-monitoring health-related behaviours and stress. They were asked to record CEMA and PFR for 6 months using assigned Samsung Vibrant smartphones running the AndroidTM operating system version 2.2 or higher (Google Inc., Mountain View, CA, USA). Study participants were randomly assigned to this self-monitoring condition (n 44) or a control condition where smartphones were not assigned (n 12); the control condition was implemented to evaluate other study aims not reported herein. Two of the forty-four participants became pregnant within two months after enrolment and dropped out of the study; the analysis sample comprised forty-two participants.
At enrolment, participants completed an online baseline assessment to collect sociodemographic characteristics. Several anthropometric measures and biomarkers were collected as measures of general health and stress. Afterwards, study smartphones were assigned and participants were instructed on how to use them to fill out (CEMA) and record PFR through a mobile app. The app was designed using Ohmage, an open-source mobile-to-web platform that has been used to design data collection platforms in prior studies( Reference Comulada 41 , Reference Swendeman, Comulada and Ramanathan 42 ). Figure 1 shows CEMA screenshots of the Ohmage app on an AndroidTM phone.

Fig. 1 (colour online) Screenshots of the mobile app used to access cellular ecological momentary assessment (CEMA) surveys, showing dashboard to access CEMA assessments (left) and a multiple-choice question from the end-of-day survey (right) that prompts the mobile user to check boxes to indicate the types of exercise she performed that day
Participants were instructed to complete CEMA four times daily for 6 months; the study period occurred between January 2012 and March 2013. Participants received a single time-based prompt on their study smartphone, such as an alarm, during each of three 3 h windows that were selected by each participant at enrolment to cover morning, midday and late afternoon time frames. Participants also received a single time-based prompt to complete an end-of-day or bedtime assessment each day. Participation in the self-monitoring conditions included in-person meetings at 3 and 6 months to review CEMA output with participants to help them determine triggers for any obvious changes in their dietary and exercise patterns.
Selection of CEMA measures was based on a participatory sensing framework( Reference Reddy, Shilton and Burke 43 ) where individuals use their mobile phone sensors to capture data that would otherwise be impractical or costly to capture. As an example, from Reddy et al.( Reference Reddy, Shilton and Burke 43 ), GPS (Global Positioning Satellite) location traces from a participant’s phone can be used to estimate his/her exposure to pollution based on pollution levels in the vicinity of his/her physical location. Such a framework is made possible by minimizing participant burden. In this vein, the current study employed measures that minimized the burden of participation in filling out CEMA over a 6-month period. User preference and real-world usability were prioritized over precision in estimating health behaviours, stress and mood. Selection of measures was guided heavily by focus groups comprised of ethnically diverse mothers similar to the current sample( Reference Ramanathan, Swendeman and Comulada 44 ). Discussions led to the five domains of health-related measures that were included in CEMA, including diet, exercise, sleep, stress and mood, and led to the selection of subjective v. standardized measures, such as measures of perceived diet quality over standardized dietary intake measures. Discussions also informed question categories, such as multiple-choice items for mood and exercise questions.
Focus group participants expressed a strong interest in the ability to record PFR as part of their self-monitoring routine. This led to the inclusion of PFR in the study protocol as an additional and exploratory function of the mobile app. Participants were instructed to self-initiate PFR for meals by clicking a ‘food button’ that was always displayed on the smartphone desktop for quick food reporting. The food button launched a prompt to ‘Take a picture of the food’ and then was followed by a multiple-choice question asking participants to tag the picture, e.g. if the meal was ‘planned’ or ‘unplanned’ and a ‘snack’ or a ‘meal’ (the question is shown in the online supplementary material).
Participants
Recruitment occurred from January 2012 through September 2012 in the Los Angeles area and took place in public settings, such as farmers’ markets and grocery stores, through local online parenting groups, flyers and word of mouth. All participants signed voluntary informed consent forms. Informally, we sought to achieve a sample of women that was over-represented by African-American and Latina women v. women of other races and ethnicities. Enrolment criteria included female gender and having a child under 18 years of age living at home. Exclusion criteria included being pregnant, breast-feeding or having a BMI less than or equal to 18·5 kg/m2, considered to be underweight. The study was approved by the University of California, Los Angeles Institutional Review Board.
Measures
Sociodemographic characteristics
Sociodemographic characteristics included age, race/ethnicity, highest level of education, work hours per week and the number of children living at home.
Anthropometric measures
Height was measured using a portable stadiometer and weight was measured using a Tanita scale and body composition analyser (model Tbf-300a; Tanita Corporation of America, Inc., Arlington Heights, IL, USA). Company and model number information for the stadiometer is unknown. BMI was then calculated as weight in kilograms divided by the square of height in metres. Analyses used standard BMI classifications for being normal weight (BMI=18·5–24·9 kg/m2), overweight (BMI=25·0–29·9 kg/m2) or obese (BMI≥30·0 kg/m2)( 45 ). Bioelectrical impedance measurements were also taken through the Tanita scale to estimate body fat( Reference Kyle, Bosaeus and De Lorenzo 46 , Reference Kyle, Bosaeus and De Lorenzo 47 ). An Omron® automatic blood pressure monitor (HEM-705CP; Omron Healthcare, Inc., Bannockburn, IL, USA) was used to measure systolic and diastolic blood pressure at the midpoint of the upper arm. Three readings were taken. The average of the final two readings was used in analyses, similar to Parker et al.( Reference Parker, Schmitz and Jacobs 48 ).
Biomarkers
A single finger-prick from a micro-lancet was used to collect drops of blood from each participant. Blood spot samples were tested in a laboratory for C-reactive protein level using a biotin–streptavidin-based immunofluorometric assay; see Copeland et al.( Reference Copeland, Shanahan and Worthman 49 ) for details. C-reactive protein is a measure of inflammation and risk for CVD, with standard classifications of low (<1 mg/l), intermediate (1–3 mg/l) and high risk (>3 mg/l)( Reference Yeh and Willerson 50 , Reference Ansar and Ghosh 51 ). Blood spot samples were also tested for Epstein-Barr virus (EBV) antibodies using an ELISA for EBV antibodies (no. P001606A; DiaSorin Corporation, Stillwater, MN, USA); ELISA methods are reported in McDade et al.( Reference McDade, Stallings and Angold 52 ). EBV antibodies are a marker of chronic stress, with higher EBV antibody levels being indicative of higher stress levels( Reference Herbert and Cohen 53 ). EBV levels have not been grouped into health-risk categories. Instead we discuss how mean EBV levels in our sample compare with those of women aged 19–47 years from another study that was conducted in Illinois (n 183)( Reference Borders, Grobman and Amsden 54 ); most women were non-Hispanic black (82·1 %) or Hispanic (10·2 %).
Cellular ecological momentary assessment
The mobile phone prompted four assessments each day, including a morning, midday, late afternoon and end-of-day (or bedtime) assessment. A summary of question content and the number of questions in each of the four assessments is shown in Table 1. Assessment questions are given in the online supplementary material. Assessments were designed to be brief and contained ten to twelve questions. The number of hours that were slept the prior evening was queried during the morning assessment. Participants were asked to describe their mood ‘at this moment’ during the morning, midday and late afternoon assessments. Stress levels ‘in the last two hours’ were queried on during the morning, midday and late afternoon assessments. Participants were asked to rate the stressfulness of their day during the bedtime assessment. During the morning, midday and late afternoon assessments, participants were asked if they ate since completing their ‘last diet survey’ and if so, who they ate with, if they ate a ‘snack’ or a ‘meal’, how their food was prepared, the perceived nutritional quality of their meal (e.g. ‘High’), how hungry they were before eating and the perceived amount of food they ate (e.g. ‘Too much’). Participants were asked to rate their ‘eating’ for the day in terms of quality and quantity. Questions on physical activity and exercise that occurred during the day were prompted during the bedtime assessment.
Table 1 Summary of questions contained in each of the four daily-administered cellular ecological momentary assessments (CEMA)

Data analysis
We compared adherence to recording any PFR over the 6-month study period or not by sociodemographic characteristics, anthropometric and biomarker measures. The χ 2 test was used for comparing categorical measures and the t test for independent samples was used for comparing continuous measures on adherence.
Random-effects logistic regression models were used to examine CEMA and PFR adherence on a daily basis over the study period. The 6-month follow-up period for each participant began the day after the first day she was were assigned a study phone, giving her a chance to try out the assigned phone, and ended on the day she returned for a follow-up visit to return the assigned phone, which was longer than the anticipated 6-month study period for approximately half of the participants (median=206·5 d for all participants). Adherence was evaluated over 8561 d as the sum of the follow-up periods across forty-two participants (range=43–288 d per participant). Adherence to filling out each of the possible four CEMA each day was categorized as 1 for a completed assessment or 0 for a missed or incomplete assessment. Only a small fraction of the assessments was incomplete, including twenty-four, thirty, twenty-eight and forty incomplete morning, midday, late afternoon and end-of-day assessments, respectively. PFR adherence each day was categorized as 1 for taking at least one picture in a day or 0 for not taking any pictures in a day. The number of pictures in a day was not differentiated further because most pictures were taken on separate days; details follow in the ‘Results’ section.
As a first run, separate models were fit to individual covariates for sociodemographic characteristics, anthropometric and biomarker measures, day of the week and time in the study. CEMA compliance analyses also included covariates for assessment type, including morning, midday, late afternoon and end-of-day or bedtime assessments. Models included random effects for each study participant to account for correlations between patterns of compliance within individuals. Covariates that were statistically significant (P<0·05) were retained to fit two multivariable models for adherence to CEMA and PFR. Analyses were carried out in the statistical software package SAS version 9.4. Plots were produced using R software version 3.2.5.
Results
Sociodemographic characteristics and health measures
Baseline characteristics are shown in Table 2. On average, study participants were 31·2 years old (range=20–43 years). Most participants were ethnic minorities, reporting African American (38 %) or Latino (43 %) ethnicity. One-third of the participants had a high-school education or less; one participant did not report her level of education. Participants reported having between one to four children; half the participants reported working part-time (18 h/week) or less (50 %; n 21) and approximately half had one child (45 %; n 19). On average, BMI was 32·4 (sd 7·0) kg/m2. Approximately half of the participants were obese (57 %) as corroborated by an average percentage of body fat at 40 %. Due to the small number of normal-weight participants (n 7) we grouped them with participants who were overweight for regression analyses. On average, participants had systolic (mean=122·3 (sd 14·4) mmHg) and diastolic blood pressure (mean=79·6 (sd 10·1) mmHg) readings in the normal range. Average C-reactive protein level at 3·2 mg/l indicated intermediate risk for CVD. On average, EBV levels in our sample were comparable to EBV levels in the sample of women from Illinois that was discussed above (mean=140·3 v. 136·8 ELISA units)( Reference Borders, Grobman and Amsden 54 ).
Table 2 Sociodemographic characteristics and health indicators of mostly ethnic minority mothers from the Los Angeles area, California, USA, according to recording of photographic food records (PFR) for more than a day or not over a 6-month period (January 2012 through March 2013)

*P<0·05, **P<0·01.
† ‘Other’ category includes two Asians, four Whites, and two participants not reporting race/ethnicity.
‡ n 30 for participants recording PFR for more than a day (one missing observation).
§ Test statistic compares obese with normal- and overweight categories.
|| n 27 for participants recording PFR for more than a day and n 10 for participants recording PFR for a day or less.
¶ n 10 for participants recording PFR for a day or less.
Adherence to recording any photographic food record
Table 2 also compares baseline characteristics between participants who recorded PFR during the study period (n 31) and participants who did not record PFR (n 10) or did not record after the first day (n 1). Those who recorded PFR for more than a day were twice as likely to be obese v. normal- or overweight than those who did not (68 v. 27 %; P=0·02). On average, participants who recorded PFR for more than a day also had higher systolic (mean=125·7 v. 112·9 mmHg; P<0·01) and diastolic blood pressures (mean=82·8 v. 71·4 mmHg; P<0·01). None of the other comparisons on baseline characteristics were statistically significant.
Cellular ecological momentary assessment and photographic food record reporting characteristics over time
A total of 16165 CEMA were recorded by forty-two participants across 6330 d or 74 % of the total number of days over which participants were followed (8561 d). CEMA were more likely to be filled out in the morning and decreased as the day went on: 4412 morning assessments, 4140 midday assessments, 3872 late afternoon assessments and 3741 end-of-day assessments were filled out. Participants filled out at least one CEMA daily for a median of 169 d (range=16–237 d) and filled out at least three of the four possible CEMA, including morning, midday, late afternoon and end-of-day assessments, on approximately half of those days (53 %).
A total of 1664 PFR were recorded by thirty-two participants across 941 d or 11 % of the total number of days over which participants were followed (8561 d). The thirty-two mothers who recorded PFR recorded for a median of 15 d (range=1–174 d). A single PFR was recorded on approximately half of the days when PFR were recorded (56 %; 528 of 941 d). Two or three food items were recorded on 24 and 11 % of the days when PFR were recorded, respectively. The largest and second largest number of PFR that were recorded per day were twenty-six PFR on a single day and seven PFR on two days.
Figure 2 shows the percentage of participants out of forty-two who filled out each of the four CEMA and who recorded at least one PFR on a daily basis over the 6-month follow-up period. Percentages in Fig. 2 are smoothed using locally weighted regression for easier viewing. Decreasing compliance over time is consistent for CEMA and PFR, with more rapid decreases in the early follow-up period. Highest rates of compliance are noted for filling out morning CEMA and lowest for recording PFR.
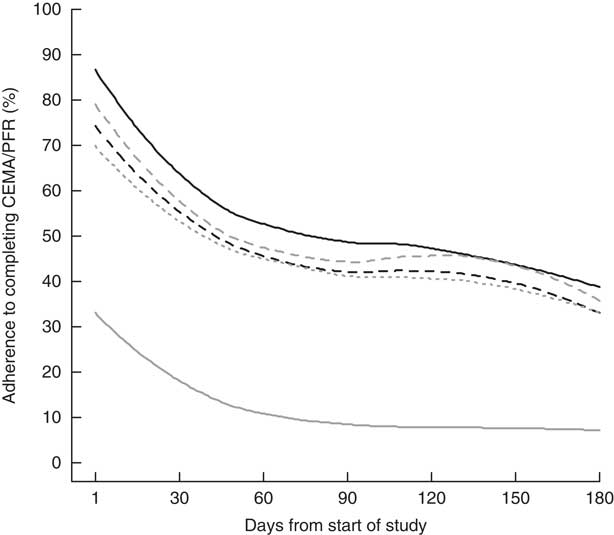
Fig. 2 Degree of adherence to self-monitoring by mostly ethnic minority mothers (n 42) from the Los Angeles area, California, USA, who recorded photographic food records (PFR) and cellular ecological momentary assessment (CEMA) of diet quality, exercise, perceived stress, mood and sleep over a 6-month period (January 2012 through March 2013): ![]() , morning CEMA;
, morning CEMA; ![]() , midday CEMA;
, midday CEMA; ![]() , late afternoon CEMA;
, late afternoon CEMA; ![]() , end-of-day CEMA;
, end-of-day CEMA; ![]() , one or more PFR
, one or more PFR
Cellular ecological momentary assessment adherence over time
Table 3 shows the results of multivariable random-effects logistic regression models for adherence to CEMA. Lower CEMA adherence was found on the weekend (OR=0·72; 95 % CI 0·68, 0·76; P<0·01). Statistically significant linear and quadratic time trends (both P<0·01) underscore a decelerating decrease in CEMA compliance over the study period that is shown in Fig. 2. As represented visually in Fig. 2, CEMA adherence was highest for morning assessments relative to midday, late afternoon and end-of-day assessments (Table 3; all P<0·01).
Table 3 Results of final multivariable logistic regression models, showing predictors of adherence to filling out cellular ecological momentary assessments (CEMA) and to recording at least one photographic food record (PFR) on a daily basis over a 6-month period (January 2012 through March 2013), among mostly ethnic minority mothers from the Los Angeles area, California, USA

*P<0·05, **P<0·01.
† Weekday is reference group.
‡ Morning assessment is reference group.
Photographic food record adherence over time
Table 3 also shows the results of multivariable random-effects logistic regression models for adherence to recording at least one PFR daily. Similar to CEMA, PFR adherence was lower on the weekend, i.e. Saturday or Sunday (OR=0·64; 95 % CI 0·52, 0·80; P<0·01), and decreased more rapidly in the earlier months of follow-up based on statistically significant linear and quadratic time trends (both P<0·001; Fig. 2). Higher PFR adherence was found for older participants (OR=1·14; 95 % CI 1·00, 1·28; P=0·04). Figure 3 shows density plots for the time of day when PFR recordings occurred on weekdays and weekends. Density shapes are quite similar between weekdays and weekends, indicating similar reporting patterns. We also note that the density was spread fairly evenly between 08.00 and 20.00 hours, with a rapid drop-off outside this range, indicating that the hours when most PFR were recorded had a peak around noon.

Fig. 3 Density plot for time of day when mostly ethnic minority mothers (n 32) from the Los Angeles area, California, USA, recorded photographic food records over a 6-month period (January 2012 through March 2013): ![]() , weekend;
, weekend; ![]() , weekday
, weekday
Discussion
Given a proliferation of pilot studies that have used CEMA or PFR to record dietary intake over short time periods, the current study that evaluated mobile assessment adherence for CEMA and PFR over 6 months comes at a crucial time to start a larger discussion on the usability and limitations of mobile assessment tools in clinical settings. As expected, we observed decreases in CEMA and PFR adherence over time that are in line with prior EMA studies( Reference Broderick, Schwartz and Shiffman 34 – Reference Courvoisier, Eid and Lischetzke 36 ). It is not surprising that continual monitoring over 6 months was problematic. What was encouraging was that adherence did not drop to zero. Short and intermittent bursts of assessment, perhaps for a week or less each, may raise adherence to an acceptable level to support long-term self-monitoring schedules during treatment programmes and warrant further study.
As hypothesized, several participant characteristics also emerged as predictors of adherence. Higher PFR adherence was found among older participants, similar to what Fitzpatrick et al.( Reference Fitzpatrick, Jeffery and Johnson 37 ) reported for adherence to in-person visits for a weight-loss intervention. We expected similar age relationships for both CEMA and PFR adherence and were surprised that age was not associated with CEMA adherence. We also found greater adherence to filling out PFR for more than a day v. a day or less among participants with higher BMI and blood pressure (i.e. less healthy mothers). Due to small sample sizes for the comparison (thirty-one v. eleven participants), we interpret findings with caution; but note that findings are in line with our hypothesis that less healthy participants would have greater adherence based on past CEMA studies in patient and non-patient populations( Reference Mattila, Parkka and Hermersdorf 29 , Reference Broderick, Schwartz and Shiffman 34 – Reference Courvoisier, Eid and Lischetzke 36 , Reference Freedman, Lester and McNamara 39 – Reference Comulada 41 ). We posit that less healthy participants may have had a greater desire to use dietary assessment as a bridge to potentially improve eating habits and, as a result, were more motivated and engaged. Findings from our study contrast with findings from Hongu et al.( Reference Hongu, Pope and Bilgic 38 ); they conducted a usability study of a diet app that supported PFR, in which body weight was not a predictor of participants’ self-reported likelihood that they would use an app to record PFR in the future. There are several notable differences between the study conducted by Hongu et al.( Reference Hongu, Pope and Bilgic 38 ) and ours that complicate comparisons across studies. They had a shorter follow-up period (six non-consecutive days over 3 weeks), a different adherence measure calculated as a count for the total number of PFR recorded over the study period, and, perhaps most importantly, a study sample with a lower BMI on average (24·5 v. 32·4 kg/m2), which may have partially explained a lack of association between body weight and future intentions to record PFR in their study. Future studies should examine adherence in larger samples with variation in BMI to better examine associations between health and adherence to self-monitoring through PFR and other self-monitoring tools.
Comparisons between CEMA and PFR should be done with caution as the study design likely reinforced CEMA with study participants to a larger degree than PFR. CEMA was prompted at regularly scheduled intervals whereas participants self-initiated PFR during meals. While PFR were encouraged by the research staff, only the CEMA results were reviewed with study participants during in-person meetings at the 3- and 6-month reviews. Despite differences in how CEMA and PFR were emphasized by the study design and a higher adherence to CEMA over PFR, common predictors of CEMA and PFR adherence emerged. CEMA and PFR adherence decreased over the course of the study and was lower on weekends v. weekdays. The opposite finding was noted by Hongu et al.( Reference Hongu, Pope and Bilgic 38 ) in a sample of college students who were almost 10 years younger than our population on average (22·8 v. 31·2 years old), likely to have been in a different stage of life than our sample, and likely to have had different priorities and availability that impacted adherence on weekends v. weekdays. Additionally, CEMA compliance was highest in the morning. Adherence findings from our study and Hongu et al.( Reference Hongu, Pope and Bilgic 38 ) for both CEMA and PFR highlight the need to consider the daily routines and temporal characteristics of target populations when designing self-monitoring tools, whether those tools are in the form of CEMA, PFR or future innovations.
Conclusions
Our results provide important insight to inform the development of future self-monitoring tools. CEMA and PFR reporting both dropped off appreciably over the 6-month time span, a similar duration as many weight-loss treatment programmes. Regardless of the assessment method that is chosen, a single method may not elicit high adherence over the necessary time span for a treatment programme. Instead, a hybrid approach that combines different assessment methods over short bursts of time, such as six non-consecutive reporting days( Reference Hongu, Pope and Bilgic 38 ), will likely be needed. This calls for the development of methods to integrate information across assessment tools in order to provide the most accurate and usable information for self-monitoring purposes. A starting point is provided by models for planned missing data( Reference Graham and Shevock 55 ) that combine measures collected with different intensities to better estimate the relationship with an outcome than the collection of either measure by itself could do. For example, an assessment scheme may collect PFR over shorter bursts of time relative to CEMA, or vice versa, if one type of measure is deemed to be more burdensome than the other. To date, models for planned missing data have been used in other fields of research that include blood pressure measurement( Reference Zawadzki, Graham and Gerin 56 ) and psychological assessment( Reference Graham, Taylor and Olchowski 57 ), but could potentially be used to improve assessment of diet and other health-related behaviours as well.
Our study design suggests several exciting directions for future studies. The handful of participant characteristics we explored highlighted differences in adherence. Future studies should evaluate more comprehensive lists of population characteristics to determine the practicality of different assessment tools for given populations. For example, we examined characteristics of the mothers themselves. Family characteristics, such as the age of mothers’ children, may also influence adherence to the assessment of health-related behaviours as motivators or barriers. Our study design emphasized self-monitoring through self-report by prompting CEMA on a daily basis and in-person visits at 3 and 6 months to review self-reports; similar mechanisms could be incorporated for PFR and may boost uptake. Lastly, it is important to acknowledge that mobile tools in our study were developed in 2010 before the popularization of photo-based social media apps, such as Instagram and Snapchat, which embed picture-taking in users’ daily activities. In a modern setting with professional development and design, a PFR application could be based around photo-based apps that users are already comfortable using. Higher uptake may result.
Acknowledgements
Financial support: This research was supported by the National Institutes of Health (grant numbers RC1HL099556, P30MH58107 and K01MH089270). The National Institutes of Health had no role in the design, analysis or writing of this article. Conflict of interest: None. Authorship: W.S.C.: analysis and interpretation of data, drafting of the manuscript, critical revision of the manuscript and lead statistical analysis. D.S.: conception and design, acquisition of data, analysis and interpretation of data, drafting of the manuscript, critical revision of the manuscript, statistical analysis, obtaining funding and administrative, technical or material support. M.K.K.: analysis and interpretation of data, drafting of the manuscript, critical revision of the manuscript and administrative, technical or material support. D.M.: analysis and interpretation of data and critical revision of the manuscript. M.M.: conception and design, acquisition of data, drafting of the manuscript, critical revision of the manuscript, statistical analysis and administrative, technical or other material support. D.E.: conception and design, acquisition of data, drafting of the manuscript, critical revision of the manuscript and administrative, technical or material support. N.M.: analysis and interpretation of data, drafting of the manuscript, statistical analysis. N.R.: conception and design, critical revision of the manuscript and administrative, technical or material support. Ethics of human subject participation: This study was conducted according to the guidelines laid down in the Declaration of Helsinki and all procedures involving human subjects/patients were approved by the University of California, Los Angeles Institutional Review Board. Written informed consent was obtained from all subjects/patients.
Supplementary material
To view supplementary material for this article, please visit https://doi.org/10.1017/S1368980017003044


