


The first nutrition recommendations date back to Britain in 1862. Following economic depression, the British Privy Council wanted guidelines for food that was cheap but would avoid diseases related to malnutrition(Reference Doets, de Wit and Dhonukshe-Rutten1). Today, most industrialized countries have nutrition recommendations and the Nordic countries have published joint recommendations, the Nordic Nutrition Recommendations (NNR)(2), since 1980. The NNR focus on the energy distribution from macronutrients, intake of micronutrients, and the most recent version from 2004 includes physical activity. The NNR are based on the current nutritional situation in the Nordic countries and available scientific knowledge to promote overall good health and reduce the risk of diet-associated diseases.
Upper respiratory tract infection (URTI), including the common cold and influenza, is a frequent disease which, in addition to causing individual suffering, is responsible for huge costs to society. URTI is estimated to cost $US 40 billion per year in the USA(Reference Fendrick, Monto and Nightengale3), not including the cost of influenza, and is the most common reason for seeking primary care in many countries(Reference Grimsmo, Hagman and Faiko4). Despite this, little is known about how to decrease susceptibility.
A large number of studies have focused on the effects of dietary patterns on chronic diseases, such as CVD and cancer(Reference McCullough, Feskanich and Rimm5–Reference Imamura, Jacques and Herrington9). For example, a lower risk of CVD was found among women adhering to the Dietary Guidelines for Americans(Reference Imamura, Jacques and Herrington9). Less is known about the effects of dietary patterns on respiratory infections. Most nutrient deficiencies are related to suppression of both innate and adaptive immune functions. For example, the fat-soluble vitamins A, D and E have been shown to affect immune cell lineage development, as well as several immune functions including apoptosis and phagocytosis(Reference Shils and Shike10). In addition, vitamin E supplementation in the elderly has been shown to reduce susceptibility to infection(Reference Meydani, Han and Hamer11), and vitamin C has since 1937 been suggested to reduce the risk of URTI(Reference Pauling12). Other nutrients suggested to affect the risk of URTI are n-3 fatty acids, selenium and zinc(Reference Shils and Shike10, Reference Jackson, Lesho and Peterson13, Reference Prasad, Beck and Bao14). However, less is known about macronutrient composition and risk of URTI.
We aim to evaluate adherence to the NNR in a population-based, prospective web cohort and to investigate if high adherence to the NNR is associated with self-reported incidence of URTI, compared with low adherence.
Because URTI typically has a brief duration, frequent follow-ups are needed for an accurate incidence tally. We assessed self-reported incidence of URTI every third week for 15 weeks by sending an email linked to a short web questionnaire to all participants.
Subjects and methods
The LIME (Lifestyle and Immune function) study comprises 1509 men and women, aged 20–60 years, residing in a middle-sized county in northern Sweden. The study is a population-based cohort on lifestyle factors and immune function, using the Internet as a tool for data collection. Subjects were randomly selected from the Swedish Total Population Registry at Statistics Sweden, and invited to participate in the study in January 2004. The study was approved by the Research Ethics Committee at Karolinska Institutet.
Study design
Invitations to participate in the study were sent out via regular paper mail. The invitations included information on how to access the web questionnaire, details on use of a web browser, the URL to the web questionnaire, and an individual username. The baseline questionnaire about lifestyle factors included a question about the participant’s email address. We sent five follow-up questionnaires during the following 15 weeks (in February, March, early April, late April and May). Every questionnaire included questions on URTI during the three preceding weeks. We sent reminders to non-responders by email 1·5 weeks after each follow-up.
Five thousand individuals were invited to participate in this prospective study, of whom 1805 completed the baseline web questionnaire in the three weeks that the web questionnaire was open. No further reminder for the baseline questionnaire was given since we aimed for a high continuation rate rather than a high initial response rate. After exclusions, 1509 were eligible for follow-up questionnaires. We excluded participants who had URTI at baseline (n 236), lacked an email address (n 17) or chose not to disclose it (n 20). During the study it became evident to us that participants at one specific workplace had an email server that filtered our emails as junk mail. We excluded these participants from the study (n 23) since they could not be invited via email to fill out the follow-up questionnaires. Response rate for each follow-up questionnaire ranged between 83 and 84 % (number of responders to that follow-up questionnaire divided by the number eligible for that follow-up questionnaire). In total, 1111 out of 1509 responded (74 % of baseline respondents) to all five follow-ups.
The baseline web questionnaire has been described in detail elsewhere(Reference Balter, Balter and Fondell15). In brief, the questionnaire included immediate checks for incomplete or implausible answers, reminder messages to the respondent when a question was left unanswered, hiding of non-relevant follow-up questions, automatic summarization of answers, voluntary personalized feedback to the respondents on BMI, energy expenditure and intakes of vitamin C, calcium, fibre and iron, and illustrations to clarify complex questions. No software installation was required to complete the web questionnaire.
Assessment of exposure
Diet was assessed at baseline by a ninety-six-item validated semi-quantitative FFQ(Reference Messerer, Johansson and Wolk16, Reference Michels, Holmberg and Bergkvist17), including questions on vitamin and mineral supplements, measuring the usual dietary intake. Consumption data from the questionnaire, including portion size, were linked to the Swedish National Food Administration database version 19/05/2009 (Uppsala, Sweden) on energy and nutrient content in various food products in order to calculate the daily mean intake. Comparing the FFQ with a 7 d food diary(Reference Messerer, Johansson and Wolk16), Spearman correlation coefficients ranged from 0·38 (iron) to 0·81 (vitamin C) for micronutrients and had the following values for macronutrients: 0·44 (protein), 0·73 (carbohydrates), 0·71 (fibre), 0·70 (total fat), 0·75 (SFA), 0·66 (MUFA), 0·49 (PUFA) and 0·81 (alcohol). Total physical activity was also assessed at baseline. Participants were asked to estimate the amount of time (hours and minutes) spent on each out of nine activity levels on a usual day and night. Each activity level was explained by examples of activities(Reference Lagerros, Mucci and Bellocco18).
Description of the Nordic Nutrition Recommendations
For several decades, the Nordic countries have worked together to set dietary guidelines. The NNR are based on research data from epidemiological studies and laboratory studies, and the recommendations apply to all the Nordic countries: Sweden, Norway, Denmark, Finland and Iceland. The NNR include recommendations on total energy intake, macronutrients as a percentage of total energy intake, intakes of fibre and salt, as well as recommended daily intakes of vitamins and minerals and recommendations on physical activity. The main goal for the NNR is to set guidelines to promote good health and to prevent major chronic diseases on a population basis(2).
Categorization of adherence
Table 1 lists the NNR by six groups of individual recommendations: intake from (i) macronutrients (e.g. total fat, protein and carbohydrates), (ii) micronutrients (vitamins and minerals), (iii) sodium, (iv) alcohol, (v) fibre and (vi) physical activity. For each major NNR group, every individual recommendation variable was graded on a continuous scale from 0 to 1 as follows. 1 point was given to intakes within the NNR; 0 point was given to intakes below a defined lowest value and/or above a highest value (for nutrient variables, the median of the ten lowest and/or ten highest intakes among the study population was used; for physical activity, <30 min/d was used as lower value); and a relative score of 0–1 points was awarded for intakes or activity levels between the recommendation level and above the defined highest and lowest values according to the following calculation (where Y is the new adherence variable and X is the intake or activity level).
Table 1 The individual recommendations in the Nordic Nutrition Recommendations (NNR) and their criteria for cut-offs and adherence scores; and mean intakes and adherence in the study population: Swedish men and women (n 1509) aged 20–60 years, LIME (Lifestyle and Immune function) study, 2004
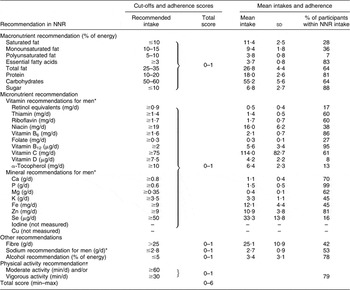
*Different cut-offs were used for women for some vitamins and minerals(2).
†Moderate activity was defined as activities corresponding to 5 MET and vigorous as activities >6 MET (where MET is metabolic equivalent task). The NNR advises more than 30 min and preferably more than 60 min of moderate and/or vigorous physical activity daily in addition to inactive living.
For lower limits, Y varies from 0 to 1:
For upper limits, Y varies from 1 to 0:
Summation of the scores of individual recommendations into groups of recommendation (e.g. fat, carbohydrates, vitamins and minerals) was made by summing up the individual scores and dividing the sum by the number of individual recommendations included in the group; in that way equal weight was given to each group in the final adherence score. Sodium, alcohol, fibre and physical activity were kept as individual recommendations. Scores from the six recommendation groups were then summarized into a total score ranging from 0 to 6 points for each person, and divided into three groups of adherence using pre-chosen arbitrary cut-off points: <4·5 points for low adherence (range 0·17–4·49, median 4·10), 4·5–5·5 points (median 4·99) for medium adherence and >5·5 points (range 5·50–5·83, median 5·60) for high adherence. The group with low adherence was considered as the reference group in the subsequent analyses.
Moreover, three additional scoring models were tested in order to evaluate the effect of scoring per se. The first alternative scoring model differs from the initial model with regard to giving more weight to the score for vitamins and minerals. The second scoring model differs from the initial model by giving more weight to the scores for vitamins, minerals and individual macronutrients. Finally, the third alternative scoring model differs from the initial model by excluding recommendations for total fat intake, monounsaturated fat intake, polyunsaturated fat intake, protein intake and carbohydrate intake and only by including recommendations that are open-ended (no closed intervals; e.g. ≤10 % of energy from saturated fat). This way, measurement error of the FFQ would have less influence on the results.
Ascertainment of upper respiratory tract infection
Self-reported URTI was assessed at baseline and in all five follow-up questionnaires. In the follow-up questionnaires, participants were asked if they currently had an infection (cold or influenza) or if they had had a new infection during the last three weeks, or since the last questionnaire. Participants were considered to have URTI if they answered ‘yes’ to this question. They were instructed not to count a URTI episode twice, even if it crossed over two follow-up periods. Follow-up questions about symptoms were given to all participants who reported an infection. Seven symptoms were recorded: sore throat, cough, runny nose, headache, malaise, fever and unspecified symptoms. The influenza season of 2003–2004 in Sweden was of medium intensity. Activity peaked during the last week of December 2003 and the first week of January 2004, but declined shortly after and remained low during the rest of the season, which ended in the middle of March(Reference Linde, Brytting and Johansson19). Influenza vaccination history was collected at baseline and updated at every follow-up. Allergy symptoms were collected in the follow-up questionnaires in April and May (the pollen season in the part of the country where the study population lived), since symptoms of pollen allergy can mimic URTI.
Data analysis methods
We divided the number of reported URTI by person-time at risk to get incidence rates. We estimated incidence rate ratios (IRR) with 95 % confidence intervals using Poisson regression models to assess and control for age and sex along with other confounding factors. Disease-free participants contributed three weeks of time under risk for each 3-week follow-up period. A participant with no reported URTI could therefore contribute up to five 3-week periods of time at risk, a total of 15 person-weeks. Since we did not know exactly when an episode of URTI occurred or how long it lasted during the 3-week period, we assigned to participants who reported URTI 1·5 weeks of risk time out of the 3-week follow-up period. We considered each follow-up period to be independent of previous or later periods for the same person. The correlation in the data due to repeated measurements on the same individual was investigated by using GEE (generalizing estimating equations), but no evidence of substantial correlation was found and GEE were not used in the final analysis. Therefore, we assumed that the risk of contracting URTI was independent of one’s previous history of URTI.
We assessed the confounding potential of a large number of potential confounding factors by eliminating one factor at a time from the full model. We included in the final Poisson model those that changed the effect estimate more than 10 % when dropped. Age, sex, BMI, asthma, self-reported weakened immune system, month, energy intake and education all had small confounding effects, but nevertheless were kept in all multivariable models. Perceived stress and smoking status changed the estimates by more than 10 % in all NNR adherence score models and were included in multivariable analyses. We also assessed as potential confounders snuff use, contact with small children, contact with large crowds at leisure time, use of public transport, poor sleep, influenza vaccination history and pollen allergy. None of these changed the estimate by more than 10 % and was not included in the final model. Individuals with missing information on the NNR score or any covariate in the final multivariable model were excluded from the analyses (n 254). The multivariable analyses on the initial NNR adherence scoring model included 15780 person-weeks contributed by 1255 participants, generating 1090 cases combined (0–5 cases per participant).
We fit a cubic spline model for the initial NNR adherence scoring model with six knots (at minimum and maximum, and at adherence scores of 1·0, 2·0, 3·0 and 4·0)(Reference Royston20) to characterize any shape of a possible dose–response relationship. We present a graph of the rates at the baseline value for all other covariates predicted from the model.
The analyses were conducted using SAS version 9·2 (SAS Institute, Cary, NC, USA) and Stata Intercooled version 10·1 (Stata Corporation, College Station, TX, USA) statistical software packages.
Results
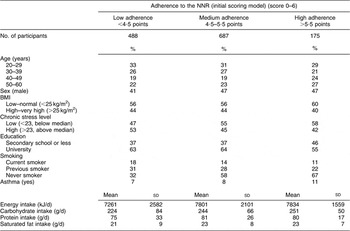
We found only small differences in baseline characteristics between study participants regarding age, sex, BMI, asthma and energy intake. Higher adherence to the NNR appeared to be associated with lower perceived stress, lower education level and fewer smokers (Table 2).
Table 2 Baseline characteristics of study participants by adherence to the Nordic Nutrition Recommendations (NNR): Swedish men and women (n 1509) aged 20–60 years, LIME (Lifestyle and Immune function) study, 2004
Adherence to each dietary recommendation is shown in Table 1. PUFA and vitamin D showed the least adherence: 7 % of participants were within the recommended interval for PUFA and only 8 % reached the recommended intake level for vitamin D. Mean intake for PUFA was 3·8 (sd 0·8) % of total energy intake, which is well below the recommended intake of 5–10% of energy. Observed intake for vitamin D was also well below the recommended intake of 7·5 μg/d, with an observed mean of 4·2 (sd 2·2) μg/d. Participants also scored lower for α-tocopherol (13 %) and selenium (16 %), where the mean intake was 6·4 (sd 2·3) mg/d and 33·3 (sd 13·8) μg/d, respectively, much lower than the recommended intakes of 10 mg/d (for men) and 50 μg/d (for men), respectively (Table 1). A previous validation study for dietary variables of the FFQ found that Spearman correlations were moderate for PUFA (0·49) and vitamin D (0·48), low for α-tocopherol (0·37) and high for selenium (0·72)(Reference Messerer, Johansson and Wolk16). Almost all participants (99 %) reached the recommended intake level of phosphorus of 0·6 g/d and almost as many (95 %) reached the recommended intake of vitamin B12 of 2 μg/d. For phosphorus and vitamin B12, the mean intakes (1·5 (sd 0·5) g/d and 5·6 (sd 3·4) μg/d) were almost three times higher than the recommended intakes (Table 1).
We found that 50 % of study participants had medium adherence (4·5–5·5 points) and 13 % had high adherence (>5·5 points) to the NNR according to the initial scoring model (Table 2). Using the initial scoring model, high adherence to the NNR (>5·5 points) was not associated with lower risk of URTI compared with low adherence (<4·5 points; IRR = 0·89, 95 % CI 0·73, 1·08; Table 3). In order to evaluate the effect of different scoring models for adherence, we tested three additional scoring models, see Table 3. However, the results did not change much. This may partially be explained by the correlation coefficients between the initial scoring models and the alternative scoring models being relatively high, as expected, ranging from 0·75 to 0·85.
Table 3 Initial and alternative scoring models of adherence to the Nordic Nutrition Recommendations (NNR) and risk of upper respiratory tract infection among Swedish men and women (n 1509) aged 20–60 years, LIME (Lifestyle and Immune function) study, 2004
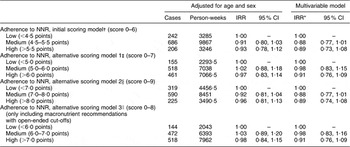
IRR, incidence rate ratio.
*IRR for all adherence scores were adjusted for age (20–29, 30–39, 40–49 and 50–60 years), sex, energy intake (in four categories), BMI (low, normal, overweight and obese), weakened immune system (yes/no), asthma (yes/no), perceived stress (below and above median), education level (secondary school or less and university), smoking (daily/less frequent/previous/never) and month (February to May).
†Scoring was calculated by awarding 1 point (1p) for adherence to the following recommendation subgroups in NNR: physical activity (1p), fibre intake (1p), sodium intake (1p), alcohol intake (1p), mineral and vitamin intake (1p), and macronutrient intake (1p).
‡Scoring was calculated by awarding 1 point for adherence to each of the following recommendation subgroups in NNR: physical activity (1p), fibre intake (1p), sodium intake (1p), alcohol intake (1p), mineral (1p) and vitamin intake (1p), and macronutrient intake (1p).
§Scoring was calculated by awarding 1 point for adherence to the following recommendation subgroups in NNR: physical activity (1p), fibre intake (1p), sodium intake (1p), alcohol intake (1p), mineral (1p) and vitamin intake (1p); and 1 point to each subgroup in macronutrient recommendations: carbohydrate and sugar intake (1p), total fat intake, saturated fat intake, essential fat intake, polyunsaturated fat intake, monounsaturated fat intake (1p) and protein intake (1p).
∥Scoring was calculated by awarding 1 point for adherence to open-ended (no intervals) recommendation subgroups in NNR: physical activity (1p), fibre intake (1p), sodium intake (1p), alcohol intake (1p), mineral (1p) and vitamin intake (1p); and 1 point to each subgroup in macronutrient recommendations; sugar intake (1p), saturated fat intake, essential fat intake (1p) and protein intake (1p).
Using the same scoring criteria as the initial model we excluded those with daily or weekly multivitamin use (about 12 % of all participants; IRR = 0·93, 95 % CI 0·76, 1·15), but the results were similar to the initial model including all multivitamin supplement users for high adherence to the NNR (>5·5 points) compared with low adherence (<4·5 points).
Adherence to the different groups of recommendations, according to the initial scoring model, and risk of URTI is shown in Table 4. We found no association between URTI and adherence to any of the groups of recommendations. The carbohydrate group (including sugar), protein group, physical activity group and alcohol group were not included in Table 4, since >75 % of participants fulfilled the recommendations for these groups and would therefore make comparisons difficult.
Table 4 Adherence score (0–1) for each group of recommendations of the Nordic Nutrition Recommendations (NNR) and risk of upper respiratory tract infection among Swedish men and women (n 1509) aged 20–60 years, LIME (Lifestyle and Immune function) study, 2004
IRR, incidence rate ratio.
*Carbohydrate group (including sugar), protein, physical activity and alcohol were not included in this table since >75 % of participants were within recommendations (adherence score = 1) for those groups.
†IRR for all adherence scores were adjusted for age (20–29, 30–39, 40–49 and 50–60 years), sex, energy intake (in four categories), BMI (low, normal, overweight and obese), weakened immune system (yes/no), asthma (yes/no), perceived stress (below and above median), education level (secondary school or less and university), smoking (daily/less frequent/previous/never) and month (February to May).
‡Including total fat intake, saturated fat intake, essential fat intake, polyunsaturated fat intake and monounsaturated fat intake.
In Table 5 we show associations between URTI and absolute intake of individual recommendations, rather than adherence score, for macronutrients, sodium, fibre and physical activity. We found no association for any individual group, except for physical activity, which was associated with reduced risk of URTI (IRR = 0·82, 95 % CI 0·69, 0·97). Single vitamins and minerals were not included in the analysis due to the large number of individual vitamins and minerals.
Table 5 Absolute cut-off points for individual recommendations of the Nordic Nutrition Recommendations (NNR) and risk of upper respiratory tract infection among Swedish men and women (n 1509) aged 20–60 years, LIME (Lifestyle and Immune function) study, 2004
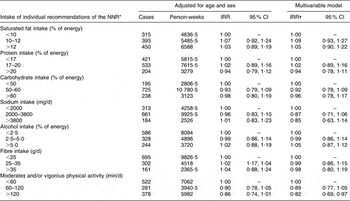
IRR, incidence rate ratio.
*Single vitamins or minerals were not studied since they were too many in number and would increase the risk of chance findings.
†IRR for all adherence scores were adjusted for age (20–29, 30–39, 40–49 and 50–60 years), sex, energy intake (in four categories), BMI (low, normal, overweight and obese), weakened immune system (yes/no), asthma (yes/no), perceived stress (below and above median), education level (secondary school or less and university), smoking (daily/less frequent/previous/never) and month (February to May).
‡Moderate physical activity cut-offs: <2 h, 2–3 h, >3 h.
To study the possible continuous relationship between adherence to the NNR and URTI risk, we fit spline regressions for the initial scoring model (shown in Fig. 1). We also fit spline regressions for each group of individual NNR and URTI risk. Only physical activity appeared to be associated with URTI risk (Fig. 2).
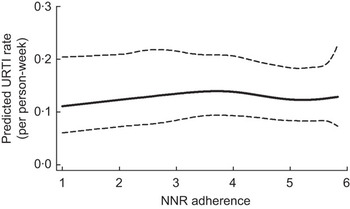
Fig. 1 Spline regressions for overall adherence to the Nordic Nutrition Recommendations (NNR) expressed as adherence score and risk of upper respiratory tract infection (URTI) among Swedish men and women (n 1509) aged 20–60 years, LIME (Lifestyle and Immune function) study, 2004. ---, 95% confidence intervals
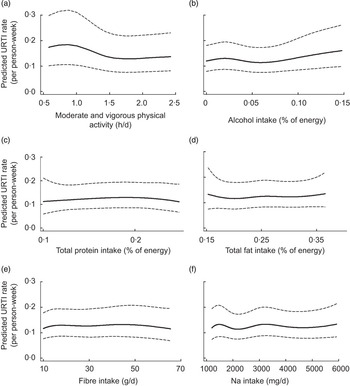
Fig. 2 Spline regressions for groups of individual recommendations in the Nordic Nutrition Recommendations (NNR) using absolute intake and risk of upper respiratory tract infection (URTI) among Swedish men and women (n 1509) aged 20–60 years, LIME (Lifestyle and Immune function) study, 2004. ---, 95% confidence intervals
Discussion
We found that high adherence to the NNR was not associated with risk of URTI, compared with low adherence. Different scoring models were used to assess adherence to the NNR, but the result did not differ between the scoring models. However, when analysing different parts of the NNR score, we found that high physical activity was associated with lower risk of URTI but none of the recommendations on diet were associated with risk of URTI. The study also demonstrates that the overall adherence to the NNR was moderately good.
To the best of our knowledge, there are no other studies available that have studied the effect of dietary recommendations on the risk of URTI. Previous studies evaluating dietary recommendations have focused on the effect on diseases such as myocardial infarction or cancer. McCullough et al.(Reference McCullough, Feskanich and Rimm5, Reference McCullough, Feskanich and Stampfer6) evaluated the adherence to the Dietary Guidelines for Americans (DGA) using ten equally weighted groups (e.g. servings of grain, fruit and meat). They found no preventive effect for cancer and no effect on CVD in women(Reference McCullough, Feskanich and Stampfer6) and only a small reduced risk for men(Reference McCullough, Feskanich and Rimm5). A more recent study, using a continuous scoring model similar to ours, found an association between DGA and atherosclerosis progression in women(Reference Imamura, Jacques and Herrington9). It is possible that the use of food groups in recommendations such as DGA is more efficient in predicting disease than the NNR which emphasize macronutrient proportions.
In the present study, diet was assessed by a validated semi-quantitative FFQ. However, we acknowledge the limitations of FFQ. The FFQ does not assess the entire diet, but large parts of the dietary intake. The shortcomings of an FFQ can blunt a true association(Reference Yngve, Hambraeus and Lissner21) and thus the results from the current study should be interpreted with caution. For example, in the European Prospective Investigation into Cancer and Nutrition, which used both FFQ and food diaries, a stronger association was found between saturated fat and breast cancer on data from food diaries compared with FFQ(Reference Bingham, Luben and Welch22). In addition, a previous validation study using the same FFQ and repeated records of total dietary intake found that the correlation coefficients between FFQ and dietary records were moderate to high for different nutrients (ranging from 0·31 for iron to 0·81 for vitamin C). Still, in dietary surveys, regardless of dietary assessment method, fat (especially saturated fat) and carbohydrates are considered to be typically under-reported, while protein is typically over-reported(Reference Becker23). Obese and weight-conscious participants are considered to be those who under-report unhealthy food the most(Reference Bandini, Schoeller and Cyr24–Reference Black, Coward and Cole26). The intakes of various nutrients in the present study were of the same magnitude as intakes reported in a previous national Swedish study, Riksmaten, from 1997–1998, of 1215 Swedish men and women(Reference Becker and Pearson27). In Riksmaten, the participants were asked to record their total intake of food and beverages using a 7 d food dairy and did not use an FFQ. A more precise measure of some dietary intakes would have been to use biomarkers, which were not available in our study.
Moderate validity for certain food items or nutrients may result in bias, with double-ended macronutrient recommendations (e.g. 50–60 % of energy from carbohydrates) being more vulnerable to poor validity (i.e. misclassification when using FFQ). In alternative scoring model 3 we excluded all double-ended recommendations, but the results did not change much compared with the initial scoring model. In order to reduce bias from misclassification using absolute cut-off points for the NNR scoring, we used a continuous score proportional to the distance from the guidelines (in all scoring models). By doing this, intakes close to, but not within the recommended intake were still given a high score.
We cannot rule out the possibility that the null results for overall adherence to the NNR in the present study are due to participants being generally very well-nourished, leading to a limited variation and skewing towards higher adherence scores for certain recommendations in order to see an association with URTI. Nevertheless, small variations in the scoring were taken into account by using a continuous grading scale for intakes close to NNR cut-offs. Our results on physical activity and URTI are supported by previous studies which have suggested a protective association on URTI of moderate levels of physical activity(Reference Matthews, Ockene and Freedson28), possibly mediated by a higher circulating number of natural killer cells found in resting athletes(Reference Mackinnon29). Although we cannot rule out a potential effect of reverse causality, to minimize this possibility we assessed exposure before outcome (i.e. baseline) and thereafter excluded those with URTI at baseline.
Major strengths of our study include its population-based design and the comprehensiveness of case identification using frequent follow-ups. Also, the continuation rate for each follow-up was high, i.e. more than 80 % of the participants responded to each follow-up web questionnaire. Incidence of URTI was self-reported and self-diagnosis of URTI has been shown to be reliable in adult patients(Reference Gwaltney30). The prospective nature of the study makes any potential recall bias highly unlikely. We adjusted for several potential confounders in the model, including stress, smoking, education level and season, observing no great difference between the age-adjusted and the multivariable models, but unmeasured aspects of a healthy diet or lifestyle (e.g. hand-washing) might result in residual confounding.
In conclusion, we found that the overall adherence to the NNR was moderately good. Overall adherence to the NNR was not associated with URTI risk in our study. However, when investigating individual components of the NNR, we found that high physical activity was associated with lower URTI risk. In addition, we found that the feasibility of using a web questionnaire at baseline and sending follow-up questionnaires via email was high in this population.
Acknowledgements
This study was financed in part by a grant from Osher Center for Integrative Medicine, Karolinska Institutet. Additional funds were received from the Swedish Council for Working Life and Social Research and the Swedish Research Council. The authors declare no conflict of interest. All authors contributed to the study design. K.B. supervised the study. K.B. and E.F obtained funding. K.B., O.B. and E.F. obtained the data. E.F. and S.C. performed data analysis and drafted the manuscript. All authors participated in critically revising the manuscript for important intellectual content. We thank Kenneth J. Rothman for methodological advice.


