


According to the Health Survey for England 2011, 24 % of boys and 17 % of girls aged 11–15 years were classified as obese( 1 ). Obesity in adolescence has been associated with an increased risk of chronic disease, persisting through to adulthood( Reference Reilly 2 ). One of the factors proposed to contribute to the obesity epidemic is the consumption of nutrient-poor foods( 3 ). Alternative terms for a ‘nutrient-poor food’ are inconsistent, varying from energy dense, to ‘empty calories’, to low-nutrient-dense food, to junk food and so forth( Reference Drewnowski 4 ). Definitions also vary across countries, organisations and health outcomes, and are based on an unspecified nutrient density( Reference Raynor, Kilanowski and Esterlis 5 ), unspecified dietary guidelines or unexplained results from epidemiological studies( Reference Michels and Wolk 6 ). A standardised approach with explicit criteria is required to define foods required for health.
The Australian Guide to Healthy Eating( Reference Kellet, Smith and Schmerlaib 7 ) divides foods into core, which should adequately provide the body with all the essential nutrients required, and non-core, which are surplus to requirements. Core foods form the five food groups of fruit, vegetables, cereals, meat and alternatives, and milk and alternatives, and ‘extra’ or non-core foods are everything else. This classification of foods to core and non-core is based on clearly defined cut-off points of fat and sugar derived from dietary guidelines and therefore presents a simple and explicit tool for defining ‘healthy’ and ‘unhealthy foods( Reference Bell, Kremer and Magarey 8 , Reference Rangan, Randall and Hector 9 ).
Research into adolescents’ consumption of core and non-core foods has taken place mainly in Australia( Reference Bell, Kremer and Magarey 8 – Reference Rangan, Kwan and Louie 10 ). Non-core foods were found to contribute 40·9 % of energy, 47·3 % of total fat and 53·8 % of sugar in the total diet of children between 2 and 18 years old, with proportions increasing with age( Reference Bell, Kremer and Magarey 8 , Reference Rangan, Randall and Hector 9 ). In the UK non-core food intake has not specifically been explored; however, carbonated and soft drinks were the most common snack consumed by 13–16-year-old adolescents( Reference Kerr, Rennie and McCaffrey 11 ). Although foods consumed as snacks can often be nutrient poor, the latter study used only the time of day to identify snacks and hence the quality of the foods consumed at other times of day was not assessed. Another study using data from the UK National Diet and Nutrition Survey (NDNS) 2008–2011 found that the most energy-dense foods consumed by 11–18-year-old adolescents were fat oils and spread, sweet spreads, crisps and savoury snacks, nuts and seeds, chocolate confectionery and biscuits( Reference Albar, Alwan and Evans 12 ). While the identification of foods according to their energy density is an indicator of the foods’ nutritional quality, it is not the only relevant factor and may misclassify certain groups such as nuts and seeds, which are high in energy but are also a good source of unsaturated fats and vitamins.
In the UK, no study to date has described adolescents’ non-core food intake in terms of either the amount or types of non-core foods eaten, but this information could guide public health initiatives aiming to improve adolescents’ diet. In addition to identifying common non-core foods as targets for intervention, knowing the determinants of non-core food intake is crucial for designing effective strategies. Studies in younger children have shown that their consumption of non-core foods is associated with maternal intake of non-core foods, home food availability and greater television watching( Reference Johnson, van Jaarsveld and Wardle 13 , Reference McGowan, Croker and Wardle 14 ). However, adolescents are more likely to eat outside the home and evidence suggests that friends have an increasing influence on their food intake( Reference Hill 15 , Reference Wouters, Larsen and Kremers 16 ). There is some evidence that food provided outside the home is more likely to be a type of non-core food; for example, a recent study conducted in the USA using National Health and Nutrition Examination Survey (NHANES) data from 3077 children and adolescents aged 2–18 years reported that the contribution of ‘empty calories’ (sum of energy from added sugar and fat) to total energy intake was similar across stores, schools and fast-food places (33 %, 32 % and 35 %, respectively; P<0·05)( Reference Poti, Slining and Popkin 17 ).
Only one study has described adolescents’ (11–13 years old) food consumption across different social contexts such as alone, with family and with friends; however, that was assessed only for the lunchtime period( Reference Woodruff, Hanning and McGoldrick 18 ). Although that study indicated potential food sources in different social contexts, the quality of these foods was not reported and subsequently the impact of social context on non-core food intake remains unclear. Experimental studies exploring food selection in the company of parents and friends showed adolescent girls’ higher consumption of unhealthy snacks (chips, cakes, cookies) in the presence of their mother compared with the company of a friend( Reference Salvy, Elmo and Nitecki 19 ); in addition, eating with unfamiliar peers was associated with adolescents having a higher healthy food intake (carrots, grapes)( Reference Salvy, Kieffer and Epstein 20 ). Using a social network approach Feunekes et al. found that consumption of foods like pizza, minced meat, bacon and fish fingers was highly correlated between parents and 15-year-old adolescents, while consumption between adolescents and their friends was different (i.e. spirits, breads, croquettes, fries and sausages)( Reference Feunekes, de Graaf and Meyboom 21 ).
Little is known about adolescents’ non-core food intake in the UK in terms of the contribution to total energy intake and the types of non-core foods being consumed overall and in different eating contexts. Therefore, the present study aimed to describe adolescents’ non-core food intake in the UK and also to explore variation in non-core food intake in different physical and social eating contexts.
Methods
Study sample and design
Dietary data were used from 666 adolescents aged 11–18 years from Years 1–3 (2008/09–2010/11) of the UK NDNS. NDNS is a programme of cross-sectional surveys that assess the dietary intake and nutritional status of the general UK population aged 1·5 years and over. The sample is drawn from a selection of postcodes across the UK, which are then divided into smaller geographical areas called primary sampling units. A number of random households per primary sampling unit are then visited by the study team, where only one adult (19 years and over) and one child (1·5 to 18 years) can participate from the selected households. In order to have equal numbers of children and adults, in some households only children are selected to take part. A face-to-face interview is conducted and participants are asked to complete a food diary recording foods and beverages consumed inside and outside the house over four consecutive days, randomly chosen. Participants who record at least 3 d are considered to have valid data. Portion sizes are estimated with household measures, while food weights from labels are also used for ready-made foods. More details about the design and dietary assessment of NDNS can be found elsewhere( 22 ). The NDNS was conducted according to the guidelines laid down in the Declaration of Helsinki and all procedures involving human subjects were approved by the Oxfordshire A Research Ethics Committee. Written informed consent was obtained from all participants( 22 ). The data for the present secondary analysis were downloaded from the UK Data Service website (http://discover.ukdataservice.ac.uk/catalogue?sn=6533, accessed June 2012).
Classification of foods to non-core
Food intake in NDNS consists of sixty main food groups, 150 subgroups and 3398 food items( 23 ). Classification of foods and food groups to non-core was made by using specific cut-off points based on sample foods from the Australian Guide to Healthy Eating( Reference Kellet, Smith and Schmerlaib 7 ). The cut-off points are based on the amount of fat and sugar contained per 100 g of food and are different for each food group, taking into account differences in nutrient density( Reference Rangan, Randall and Hector 9 ). If a food item exceeded the cut-off points, it was then allocated to the non-core food group. The fat and sugar contents of all foods items were examined, which allowed some main food groups to be wholly classified as core or non-core. If the allocation of a main group was not possible then subgroups were allocated wholly and where this was not possible single food items were allocated as core or non-core individually. As an example, most types of cheese were allocated as core foods; however, cheese with high fat content such as stilton was allocated to the non-core food group whereas mozzarella-type cheese was allocated to core foods. Composite dishes were examined as part of the main food group to which they were previously allocated in NDNS( 23 ). In cases where foods had slightly different contents of fat and sugar, which would allocate them to a different group from the one they had been allocated to by Rangan et al.( Reference Rangan, Randall and Hector 9 ), then Rangan and colleagues’ allocation was taken into account. For example, coleslaw is considered a core food in Australia based on a fat content of 10–12 %. However, although the coleslaw in NDNS has a fat content of 16 % it was still allocated as a core food item. A total of eighteen non-core and seventeen mixed main food groups were determined, in which core and non-core food items were identified and grouped, thus resulting in twenty groups of non-core foods (see online supplementary material, Supplemental Table 1). Although both food and beverage groups were analysed in the present study, the term ‘foods’ is used herein to comprise foods and beverages, in order to ensure an easier reading flow.
Definition of eating context
Participants in NDNS recorded ‘where’ and ‘with whom’ consumption of each food item occurred, which defined the eating context. ‘Where’ responses in NDNS were coded to thirty-six responses, which were then grouped into seven categories for the purposes of the present study. Similarly, ‘with whom’ responses were initially coded to eighteen responses, which were then grouped to five categories as part of the present study. Grouping happened with similar locations and people; for example, ‘school – canteen’, ‘school – classroom’ and ‘school – playground’ would be grouped together under the category of ‘School’, and ‘family’, ‘family & friends’ and ‘carers & other children’ would be grouped together under ‘Family & friends’. Also, categories that included only a few participants were incorporated into other groups; for example, ‘partner’ and ‘partner & children’ were added to the ‘Friends’ group. The initial ‘where’ and ‘with whom’ categories and their breakdown can be seen in the online supplementary material, Supplemental Tables 2 and 3. In total, twelve eating contexts were considered for the current analyses: seven ‘where’ and five ‘with whom’ eating contexts.
Data analysis
All descriptive analyses of non-core food consumption in total and across eating contexts (seven ‘where’ and five ‘with whom’ categories) were conducted using the Stata statistical software package release 13. Descriptive analyses of non-core foods were produced according to age, gender and socio-economic status (SES). SES (low, intermediate, high) was calculated from the National Statistics Socio-economic Classification (NS-SEC), which is based on occupation, as done elsewhere( Reference Wijlaars, Johnson and van Jaarsveld 24 ). Percentages of non-core energy consumed in total and across each eating context were calculated by adding all individual intakes together to compute total non-core energy consumed in the whole survey, in each context and for each food group separately. The term ‘total/non-core energy’ refers to dietary energy from foods and beverages consumed in the survey. Working with eating context means that the same adolescents can consume non-core foods in multiple different ‘where’ and ‘with whom’ categories; therefore exclusive percentages of non-core energy cannot be generated. Hence, the data set was re-structured and percentages of non-core energy were calculated across the entire survey without taking into account the number of people. Percentages were calculated in order to meet the following three aims.
1. Assessing total and non-core food consumption (in total and for each eating context)
Percentages of total energy consumed in each eating context were calculated by dividing the amount of energy consumed in each of these eating contexts by the total energy consumed in the entire survey and then multiplying by 100. Similarly, to assess non-core food consumption in total, the amount of non-core energy consumed in the entire survey was divided by the total amount of energy consumed in the entire survey and then multiplied by 100. Percentages of non-core energy consumed in each eating context out of the total energy consumed in that context were also calculated. For example, to calculate the percentage of non-core energy consumed with ‘Parents/carers’, non-core energy consumed with ‘Parents/carers’ was divided by the total amount of energy consumed with ‘Parents/carers’ and then multiplied by 100.
2. Assessing contribution of non-core foods to non-core food intake (in total and for each eating context)
Percentages of non-core energy from individual food groups were calculated to assess the types of non-core foods that contribute the most energy to total non-core food intake. As an example, to calculate the percentage of non-core energy contributed from ‘Crisps & savoury snacks’, the total amount of non-core energy consumed from ‘Crisps & savoury snacks’ was divided by the total non-core energy in the entire survey and then multiplied by 100. This process was replicated across all eating contexts to assess the contribution of non-core foods within each setting (e.g. contribution of ‘Crisps & savoury snacks’ at ‘Home’), with the difference that the denominator was the total amount of non-core energy consumed in each of these settings. Percentages of the top five non-core foods’ contribution to non-core food intake (in total and for each eating context) are presented in the online supplementary material, Supplemental Tables 4 and 5.
3. Assessing popularity of non-core foods’ consumption (in total and for each eating context)
Although it is important to assess the energy contribution of non-core foods to total non-core food intake, it is also important to understand how many people consumed these non-core foods in the survey. From a public health perspective, foods contributing a large amount of non-core energy to non-core food intake but consumed by only a few people may be less important than foods contributing a medium amount of non-core energy but eaten by many people. Hence, percentages of people consuming each non-core food were calculated by dividing the number of people consuming each individual food by the total number of people in the survey and then multiplying by 100. The process was replicated across eating contexts to assess the popularity of non-core foods within each eating context (e.g. percentage of people consuming ‘Biscuits’ at ‘School’), with the difference that the denominator was the number of people consuming non-core foods in each of these settings. Percentages of the top five non-core foods’ popularity among adolescents (in total and for each eating context) are presented in the online supplementary material, Supplemental Tables 4 and 5.
Combined ranking of non-core food groups
After assessing each food’s contribution to total non-core food intake and the food’s popularity, a combined ranking for each food group was created to account for both these aspects. First, percentages of non-core energy for all food groups in total were ranked from the non-core food contributing the most non-core energy (rank=1) to the one contributing the least non-core energy (rank=20). Second, percentages of people consuming each non-core food group in total were ranked from the most popular food (rank=1) to the least popular one (rank=20). Hence, two separate rankings were created for each food group that were then added to create a combined ranking. For example, if a non-core food group received a ranking of 3 for the amount of non-core energy it contributed to total non-core food intake and a ranking of 5 for its popularity, it would get a combined ranking of 8. This process was replicated for each eating context separately. In the Results section, the top five food groups in total and for each eating context are reported based on the combined ranking.
Results
Overall non-core food intake
The percentage of non-core energy consumed overall in the survey was 39·5 % (Table 1). The mean non-core food intake according to age, gender and SES is presented in Table 2. Non-core food intake increased from early (11–12 years old) to mid adolescence (13–15 years old) and then dropped slightly for the older age group (16–18 years old; 37·6 % v. 40·6 % v. 39·5 %). Girls’ non-core food intake was higher compared with boys’ (40·6 % v. 38·7 %), while adolescents from low SES had the highest non-core food intake compared with higher SES groups (43·4 % v. 39·0 % (intermediate SES) v. 38·4 % (high SES)). The top five foods that contributed the most non-core energy to total non-core food intake and were also popular among adolescents were ‘Regular soft drinks’, ‘Crisps & savoury snacks’, ‘Chips & potato products’, ‘Chocolate’ and ‘Biscuits’ (Fig. 1).
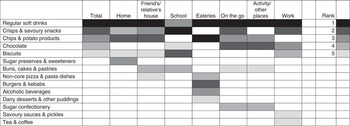
Fig. 1 Combined ranking of top five non-core foods in total and across each ‘where’ category among adolescents aged 11–18 years (n 666) from the UK National Diet and Nutrition Survey 2008–2011. The ranking of each food group is a combination of the non-core food’s contribution to total non-core food intake and the food’s popularity among adolescents
Table 1 Percentages of total and non-core food consumption (% energy), overall and across ‘where’ and ‘with whom’ eating contexts, by adolescents aged 11–18 years (n 666) from the UK National Diet and Nutrition Survey 2008–2011
* Percentages of total energy across the ‘where’ and ‘with whom’ eating contexts were calculated by dividing the amount of energy consumed in each of these contexts by the total energy consumed in the entire survey and then multiplying by 100.
† The percentage of non-core energy overall was calculated by diving the amount of non-core energy across the entire survey by the total amount of energy in the entire survey and then multiplying by 100. Percentages of non-core energy across the ‘where’ and ‘with whom’ eating contexts were calculated by dividing the amount of non-core energy consumed in each of these contexts by the total non-core energy consumed in the entire survey and then multiplying by 100.
‡ ‘Where’ refers only to the place where food was consumed.
Table 2 Percentage of non-core energy consumed out of all energy consumed in the survey, according to age, gender and SES, by adolescents aged 11–18 years (n 666) from the UK National Diet and Nutrition Survey 2008–2011
SES, socio-economic status.
* SES was calculated from the National Statistics Socio-economic Classification (NS-SEC), which is based on occupation( Reference Wijlaars, Johnson and van Jaarsveld 24 ).
Non-core food intake across the ‘where’ eating contexts
Table 1 shows percentages of total and non-core energy consumed in each location. Nearly two-thirds of total energy intake was consumed at ‘Home’, followed by 12 % at ‘School’. Just over half of non-core energy was eaten at home, followed by 13 % at ‘School’. Non-core energy as a percentage of the total energy consumed in each location is displayed in Fig. 2. The vast majority of food eaten at ‘Eateries’ and ‘On the go’ was non-core (57·0 % and 65·8 %), which was higher compared with food eaten at ‘Home’ (33 %). Having a more detailed look at the top five non-core foods from the combined ranking in each location (Fig. 1), ‘Regular soft drinks’ came first in the ranking of most ‘where’ categories, apart from ‘School’, where it was ranked third. ‘Crisps & savoury snacks’ and ‘Chips & potato products’ were also highly ranked in multiple locations, while some non-core foods were highly ranked only in specific locations. For example, ‘Burgers & kebabs’ were among the top five foods only at ‘Eateries’; ‘Alcoholic beverages’ were highly consumed only at ‘Eateries’; and ‘Savoury sauces & pickles’ were among the top five non-core foods only at ‘Work’.
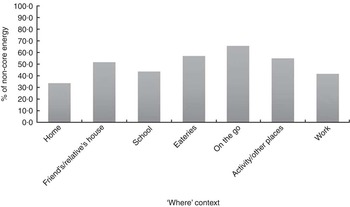
Fig. 2 Percentages of non-core energy consumed in each ‘where’ category by adolescents aged 11–18 years (n 666) from the UK National Diet and Nutrition Survey 2008–2011. Percentages are calculated by dividing the amount of non-core energy consumed in a ‘where’ eating context by the total energy consumed in the same eating context and multiplying by 100
Non-core food intake across the ‘with whom’ eating contexts
Table 1 presents the percentages of total and non-core energy consumed across the ‘with whom’ eating contexts. Most total energy was consumed with ‘Friends’ followed by being ‘Alone’ and with ‘Parents & siblings’, while similarly most non-core energy was consumed with ‘Friends’ followed by being ‘Alone’ and with ‘Family & friends’. Figure 3 shows the percentage of non-core energy consumed in each ‘with whom’ category out of the total energy consumed. Eating with ‘Friends’ was associated with a higher percentage of non-core energy compared with eating with ‘Parents/carers’ or ‘Parents & siblings’ (51·3 % v. 32·1 % and 31·0 %, respectively). Similarly to the non-core foods intake across ‘where’ eating contexts, ‘Regular soft drinks’ were first in the ranking, this time in all the ‘with whom’ categories (Fig. 4). Other persistent foods reported across most of the five ‘with whom’ categories were ‘Chips & potato products’, ‘Crisps & savoury snacks’ and ‘Chocolate’. There were also non-core foods associated with specific ‘with whom’ categories. For example, ‘Savoury sauces & pickles’ were highly ranked when eating with ‘Parents/carers’, ‘Parents & siblings’ and ‘Family & friends’ but not when ‘Alone’ or with ‘Friends’; ‘Non-core pizza & pasta dishes’ were highly ranked when eaten with ‘Parents & siblings’ and ‘Family & friends’.
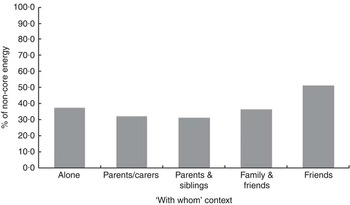
Fig. 3 Percentages of non-core energy consumed in each ‘with whom’ category by adolescents aged 11–18 years (n 666) from the UK National Diet and Nutrition Survey 2008–2011. Percentages are calculated by dividing the amount of non-core energy consumed in a ‘with whom’ eating context by the total energy consumed in the same eating context and multiplying by 100
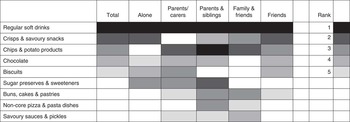
Fig. 4 Combined ranking of top five non-core foods in total and across each ‘where’ and ‘with whom’ category among adolescents aged 11–18 years (n 666) from the UK National Diet and Nutrition Survey 2008–2011. The ranking of each food group is a combination of the non-core food’s contribution to total non-core food intake and the food’s popularity among adolescents
Discussion
The present study is the first that describes adolescents’ non-core food intake in the UK. Adolescents’ consumption of non-core foods was 39·5 % of their energy intake and the top five non-core foods consumed were ‘Regular soft drinks’, ‘Crisps & savoury snacks’, ‘Chips & potato products’, ‘Chocolate’ and ‘Biscuits’. Total non-core food intake was higher at ‘Eateries’ and ‘On the go’ compared with eating at ‘Home’ and it was also higher when adolescents were eating with ‘Friends’ compared with eating with ‘Parents/carers’ or ‘Parents & siblings’. Although there were persistent foods across most eating contexts (i.e. ‘Regular soft drinks’, ‘Chips & potato products’, ‘Crisps & savoury snacks’ and ‘Chocolate’), some non-core foods were uniquely associated with specific eating contexts; for example, ‘Burgers and kebabs’ with ‘Eateries’ and ‘Non-core pizza & pasta dishes’ associated with ‘Parents & siblings’ and ‘Family & friends’.
The overall proportion of non-core food intake from our findings was similar to non-core food intake in Australia (41·5–42·7 %)( Reference Bell, Kremer and Magarey 8 , Reference Rangan, Randall and Hector 9 ), as well as to energy intake from foods high in solid fats and added sugars in the USA (34 %)( Reference Slining and Popkin 25 ). Total non-core food intake in our study was higher in specific settings (i.e. at ‘Eateries’, ‘On the go’ and with ‘Friends’). A few studies have reported higher energy intake in restaurants and fast-food places compared with energy intake at home( Reference Woodruff, Hanning and McGoldrick 18 , Reference Zoumas-Morse, Rock and Sobo 26 ), while there is less evidence about energy intake in different social settings. In a sample of Canadian adolescents, the reported energy intake with friends was not statistically different from the energy consumed when being with family members or alone( Reference Woodruff, Hanning and McGoldrick 18 ), although that study only assessed energy intake during lunchtime. In addition, roughly similar to the top non-core foods in our study, the top five non-core foods among Australian children and adolescents (2–16 years old) were sugar drinks, sweet biscuits, potato crisps and snacks, cakes and muffins, and fried potatoes( Reference Rangan, Kwan and Flood 27 ).
Non-core foods in our sample contributed 39·5 % to adolescents’ diet, which is almost two to four times higher than the 5–20 % intake specified by the Australian Guide to Healthy Eating( Reference Kellet, Smith and Schmerlaib 7 ) or the 8–19 % intake of ‘empty calories’ specified by the Dietary Guidelines for Americans( 28 ). In the UK, the Eatwell Plate states that foods and drinks high in fat and/or sugar should be consumed in small amounts( 29 ); however it does not provide any advice on what the recommended intake should be. It could therefore be argued that adopting the non-core food model could allow for specific recommendations to be made about the appropriate limits on intake of these foods as part of a balanced diet.
Looking at specific non-core foods across eating contexts, the amount of non-core food eaten was higher at ‘Eateries’, ‘On the go’ and with ‘Friends’. As noted, adolescents’ energy intake in restaurants and fast-food places has been shown to be higher compared with eating at home( Reference Woodruff, Hanning and McGoldrick 18 , Reference Zoumas-Morse, Rock and Sobo 26 ); however, the nutritional quality of this energy intake has not been assessed. Foods consumed in ‘away from home’ locations are often high in energy density and provide high energy from fat( Reference Kirkpatrick, Reedy and Kahle 30 , Reference Lachat, Nago and Verstraeten 31 ), and our study strengthens this evidence by showing that a higher percentage of food intake in out-of-home locations comes from non-core foods. In addition, higher intakes of ‘unhealthy’ foods (i.e. snacks, soft drinks, desserts) have also been reported in relation to peers’ consumption( Reference Wouters, Larsen and Kremers 16 ) and peers’ support( Reference Fitzgerald, Heary and Kelly 32 ), as it is believed that the transition to adolescence is characterised by increased peer influences( Reference Brown, Dolcini and Leventhal 33 ).
The most common types of non-core foods seemed to be the same regardless of the physical or social setting. ‘Regular soft drinks’ were highly ranked in all eating contexts, while ‘Chips & potato products’, ‘Crisps & savoury snacks’ and ‘Chocolate’ were among the top five non-core foods in the majority of eating contexts. Similarities of foods contributing to ‘empty calories’ across physical eating contexts (defined as the place of purchase) have also been observed among adolescents from NHANES( Reference Poti, Slining and Popkin 17 ), where sandwiches, pizza, grain desserts and sugar-sweetened beverages were among the high scorers. Hence, it could be argued that while the physical and social context does not seem to affect the type of non-core food eaten, it does appear to influence the amount of non-core food consumed.
Regular soft drinks were the most highly consumed non-core food group in our sample regardless of the eating context. Soft drinks have also been reported to be the most popular snack choice among 13–16-year-old British adolescents( Reference Kerr, Rennie and McCaffrey 11 ), while sugar drinks including soft drinks, juice drinks and sweetened tea/coffee have been the number one beverage providing the most daily energy among 13–18-year-old adolescents in the UK( Reference Ng, Ni Mhurchu and Jebb 34 ). Therefore, since consumption of soft drinks occurs in every eating context and at the same time it is highly ranked in terms of energy contribution and popularity, policies aiming to change non-core food consumption in adolescence should target this food group. In addition, soft drinks’ importance to health has also been underlined, as findings from a review and meta-analysis suggest a link between children’s and adolescents’ consumption of sugar-sweetened beverages and the promotion of weight gain( Reference Malik, Pan and Willett 35 ). Hence, from a public health perspective, targeting soft drinks can be an alternative for changing levels of non-core food consumption and subsequently improve diet in adolescence.
Our study is strengthened by the use of data from a representative sample of adolescents in the UK and used a simple and explicit classification of non-core foods. In addition, the use of detailed prospective food diaries allowed the collection of ‘real time’ information on food intake in relation to the eating context, rather than assessing frequency of consumption. By recording the foods at the time they are consumed, rather than relying on recalled intakes, food diaries provide more accurate information and a better description of the type and the portion size of the food compared with other dietary assessment methods, such as FFQ or a single 24 h recall( Reference Thompson and Subar 36 ).
However, the present study has also its limitations. The analysis is solely descriptive at the population level and does not account for the individual differences or within-person variation. Therefore, we cannot be sure that different contexts are causally related to the consumption of non-core food as we have not accounted for the types of people who tend to eat in certain contexts. Confounding by individual characteristics such as age, gender, body size and social class could be controlled with the use of multilevel models to explore the independent determinants of non-core food intake and should be explored in future studies. Another point to address is the validity of food diaries to capture food intake in specific eating contexts. Adolescents may forget to take the food diary to places away from home and subsequently there may be omissions of specific foods and drinks( Reference Livingstone, Robson and Wallace 37 ). Therefore, the amount of food eaten outside the home may be underestimated.
Conclusion
The present study is the first to describe adolescents’ non-core food intake in the UK in total and across different eating contexts. On the basis of these data, food environments like ‘Eateries’, ‘On the go’ and eating with ‘Friends’ could be targeted by future interventions and policies in order to reduce non-core food consumption. However, further evidence on the causal nature of this association is required from multilevel, longitudinal or randomised controlled studies to rule out confounding and reverse causality. The eating context did not affect the type of non-core food consumed, and the fact that regular soft drinks were highly consumed regardless of the environment where adolescents ate reinforces the need for this as a specific target for interventions to reduce the intake of non-core foods among adolescents.
Acknowledgements
Acknowledgements: The authors would like to thank the study participants, the NDNS team, the UK Data Service and the dietary assessment assistants at MRC Human Nutrition Research who coded the food diaries. Financial support: This research received no specific grant from any funding agency in the public, commercial or non-for-profit sectors. Conflict of interest: None. Authorship: Z.T., A.M.H. and L.J. contributed in conception, design and drafting of the manuscript and Z.T. and L.J. contributed in data analysis. All authors read and approved the final manuscript. Ethics of human subject participation: The NDNS was conducted according to the guidelines laid down in the Declaration of Helsinki and all procedures involving human subjects were approved by the Oxfordshire A Research Ethics Committee. Written informed consent was obtained from all participants.
Supplementary Material
To view supplementary material for this article, please visit http://dx.doi.org/10.1017/S1368980016000124


