


Alcohol has been suggested to have a hypnotic effect on the body because it can suppress the function of the central nervous system(Reference Miyata, Noda and Ito1–Reference Roehrs, Papineau and Rosenthal3). In contrast, alcohol also could interrupt the sleep cycle and increase the risk of sleep disorders by interrupting the respiratory system during sleep and competing with neuroimmune and neurotransmitter systems(Reference Miyata, Noda and Ito1,Reference Elmenhorst, Elmenhorst and Benderoth2,Reference Guo, Hu and Liu4–Reference Chakravorty, Chaudhary and Brower6) . Alcohol tends to reduce sleep onset latency and decrease the rapid eye movement sleep percentage of the total sleep period and results in a higher frequency of waking during sleep(Reference Miyata, Noda and Ito1,Reference Elmenhorst, Elmenhorst and Benderoth2) . Previous human studies, including a clinical trial and several observational studies, found that alcohol intake may increase the odds of sleep disorders(Reference Miyata, Noda and Ito1,Reference Nagayoshi, Yamagishi and Tanigawa7,Reference Jung, Kim and Min8) . Although these results demonstrate a possible connection between alcohol consumption and sleep disorders, these studies were limited by a small sample size or lack of detailed information on sleep disorder type and alcohol consumption (i.e., amount and type of alcohol consumed)(Reference Miyata, Noda and Ito1,Reference Nagayoshi, Yamagishi and Tanigawa7,Reference Jung, Kim and Min8) . Further, most previous studies of the association between alcohol intake and sleep quality focused on excessive drinking, inducing participants with alcoholism, alcohol dependence and alcohol use disorders (AUD)(Reference Chakravorty, Chaudhary and Brower6,Reference Carton, Pignon and Baguet9–Reference Bensley, Seelig and Armenta11) . The impact of alcohol intake on sleep quality in community populations without excessive drinking remains unclear. Additionally, previous studies have only investigated the effect of alcohol consumption on one or two sleep parameters (i.e., insomnia, daytime sleepiness or snoring/obstructive sleep apnoea (OSA))(Reference Guo, Hu and Liu4,Reference Kolla, Foroughi and Saeidifard5,Reference Chung, Kan and Yeung12) . The impact of habitual alcohol consumption on overall sleep pattern remains unknown.
Therefore, we conducted a cross-sectional study using a community-based cohort to examine the association of alcohol intake, specifically the amount and type of alcoholic beverages consumed, with sleep quality. Overall sleep quality was evaluated by combining four sleep parameters including insomnia, daytime sleepiness, sleep duration and snoring. We also examined the association between alcohol intake and each individual sleep parameter. We hypothesised that higher alcohol intake would be associated with poorer sleep quality, as suggested by low overall sleep quality score and higher odds of having individual sleep disorders.
Method
Participants
The analysis was based on a subset of a Chinese cohort, the Kailuan Study, being conducted in the Kailuan community in Tangshan city, China(Reference Ma, Pavlova and Li13). In the Kailuan Study, 101 510 participants (81 110 men and 20 400 women) from the ages of 18–97 were recruited in 2006–2007 at eleven hospitals (study sites)(Reference Ma, Pavlova and Li13–Reference Huang, Li and Shearer15). These hospitals provide primary care for all participants of the Kailuan Study. All participants completed standardised questionnaires, laboratory assessments and underwent physical examination. Every 2 years, the questionnaires, laboratory assessments and clinical examination were repeated.
In 2012, information on sleep habits was collected in 12 990 participants (10 725 men and 2265 women) who had completed the survey in the Kailuan Hospital (the largest study site of the Kailuan Study) and were free of neurodegenerative diseases, as detailed previously(Reference Ma, Pavlova and Li13,Reference Ma, Pavlova and Liu14) . We excluded participants with CVD, cancer and head injury (n 987) and participants who had incomplete sleep and alcohol intake information (n 98), leaving 11 905 participants (9776 men and 2129 women) in the current analysis. Fig. 1 showed the flow chart of the study.
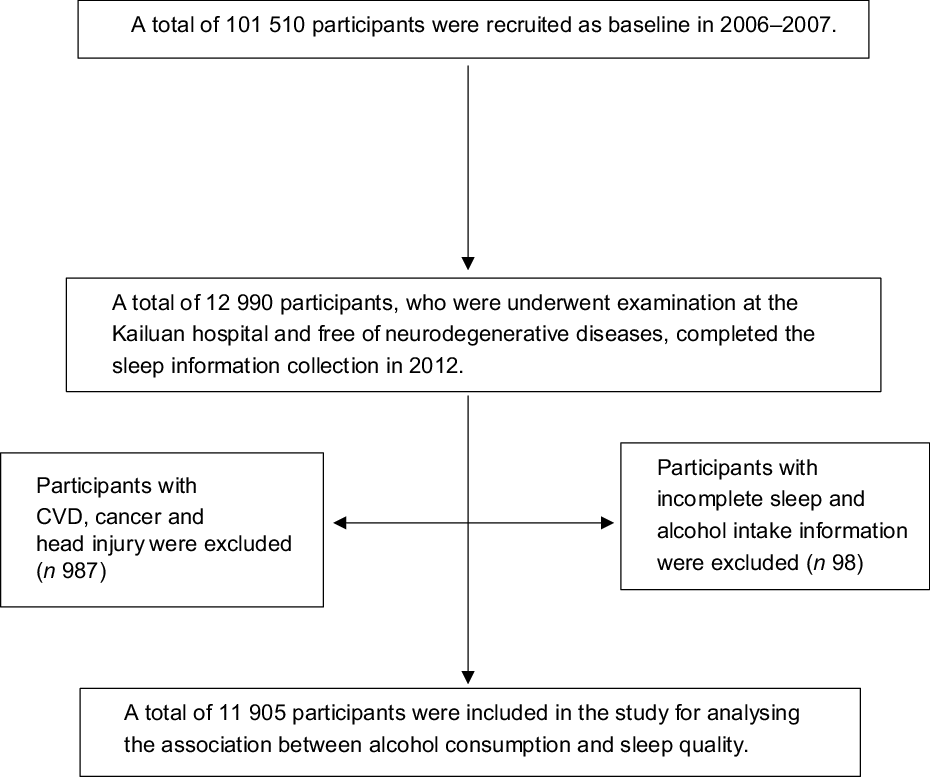
Fig. 1 Flow chart of the study
Measurement of alcohol consumption
Information on alcohol intake (both amount and type) was collected via questionnaires during the Kailuan Study, in 2006 (baseline) and 2012(Reference Ma, Pavlova and Li13,Reference Huang, Li and Shearer15) . To reduce the possibility of reverse causality (the presence of sleep disorders may change alcohol intake) we used the alcohol intake from the 2006 questionnaire as the primary exposure. However, we also examined the 2012 alcohol intake as a secondary exposure to understand the potential short-term impact of alcohol intake on sleep. In the questionnaire, participants reported their alcohol intake over the past 12 months, including consumption (yes or not), beverage type (beer, wine, hard liquor), amount of alcohol consumed and frequency of intake. Alcohol consumption was calculated (in g/d) via the frequency of intake (times/d) multiplied by the usual amount of alcoholic beverage consumed and the corresponding average ethanol content of that beverage (5·0 g for 100 g beer, 12·0 g for 100 g wine, 40·0 g for 100 g hard liquor)(Reference Ma, Pavlova and Li13,Reference Huang, Li and Shearer15) . A standard drink (classified as ‘one serving’ in the study) contained around 14·0 g of ethanol(Reference Huang, Li and Shearer15).
The US Department of Agriculture and US Department of Health and Human Services define one standard drink as a beverage containing 0·6 fl oz or 14·0 g ethanol on the ‘Dietary Guidelines for American 2015–2020’(16). Thus, based on the definition of one standard drink, we classified participants into the following categories of alcohol consumption: non-drinkers, light drinkers (women: 0–0·4 serving/d; men: 0–0·9 serving/d), moderate drinkers (women: 0·5–1·0 serving/d; men: 1·0–2·0 servings/d) and heavy drinkers (women: >1·0 servings/d; men: >2·0 servings/d)(16). For the alcoholic beverage types, we defined three categories: beer, wine and hard liquor. Within each category, we divided participants into two groups, a ‘yes’ group containing people who drank the indicated type of alcoholic beverage and a ‘no’ group containing people who did not drink any alcohol or did not drink the indicated type of alcoholic beverage.
The validity of the self-reported alcohol consumption data has been confirmed in previous studies. One study from our lab demonstrated a dose–response relationship between alcohol consumption and HDL-cholesterol concentrations in a cross-sectional analysis conducted in 71 379 Kailuan Study participants(Reference Huang, Li and Shearer15).
Measurement of sleep quality
In the Kailuan Study, the majority of the sleep data was collected in 2012 via questionnaires administered verbally by trained interviewers(Reference Ma, Pavlova and Li13,Reference Huang, Li and Shearer15,Reference Li, Huang and Hou17) . OSA information was collected in 2014. The primary outcome of the current study was overall sleep quality, based on four sleep parameters including insomnia, daytime sleepiness, sleep duration and snoring, as detailed previously(Reference Li, Huang and Hou17).
Insomnia
The insomnia status of participants was assessed via a Chinese version of the Athens Insomnia Scale (AIS)(Reference Chung, Kan and Yeung12,Reference Sun, Chiou and Lin18) . The AIS is a self-report questionnaire designed to assess the insomnia status of a person in the past month via eight questions about sleep situations(Reference Sun, Chiou and Lin18). The score of each question within the AIS ranges from 0 to 3 (0 = no event, 1 = mild, 2 = moderate, 3 = severe), and the maximum total score of the AIS is 24 (8 × 3 = 24)(Reference Chung, Kan and Yeung12). A participant with a total score scale ≥6 was classified as having insomnia(Reference Chung, Kan and Yeung12).
Daytime sleepiness
Daytime sleepiness data were collected via a Chinese version of the Epworth Sleepiness Scale (ESS)(Reference Chen, Johns and Li19,Reference Johns20) . To support the validation of the Chinese version of ESS, a previous study demonstrated an acceptable test–retest reliability (ρ = 0·74, P = 0·01) of the Chinese version of ESS among the Chinese population(Reference Chen, Johns and Li19). The ESS includes eight items, each scored from 0 to 3, to evaluate a person’s feeling of falling asleep while engaging in daily activities, in specific circumstances(Reference Johns20). A person with a higher score for each item represents a higher tendency of falling asleep. The total score of the ESS ranges from 0 to 24(Reference Johns20). A person with a score ≥10 was classified as having excessive daytime sleepiness(Reference Johns20).
Sleep duration
Information regarding the sleep duration of participants was collected via self-report surveys(Reference Ma, Pavlova and Liu14). Participants reported their total sleep hours during a usual night. In the current study, sleep duration was classified into four groups (<6, 6–7, 7–8, ≥8 h/d).
Snoring and obstructive sleep apnoea
In 2012, self-reported snoring, including self-reported snoring and breathing stops (i.e., apneas), was collected via a questionnaire(Reference Ma, Pavlova and Liu14,Reference Li, Huang and Hou17) . A participant with self-reported breathing stops must have had >10 s of breathing stops before breathing re-covered and had more than an estimated fifty breathing stops per night(Reference Ma, Pavlova and Liu14,Reference Li, Huang and Hou17) . Participants reported the frequency of snoring based on three levels (never/rare, occasional or frequent).
In 2014, the OSA status and anthropometric assessments were measured via a STOPBANG questionnaire by a trained interviewer, as detailed previously(Reference Ma, Pavlova and Li13,Reference Ma, Pavlova and Liu14,Reference Chung, Yegneswaran and Liao21) . The STOPBANG questionnaire evaluates a participant’s risk of OSA and contains eight binary variables including snoring, daytime tiredness, observed apnoeas, blood pressure, BMI (BMI, >35 kg/m2), age (>50 years), neck circumference (>40 cm) and sex (men)(Reference Ma, Pavlova and Li13,Reference Ma, Pavlova and Liu14) . A person with three or more positive scores of the eight binary variables is considered to have an intermediate or high risk of OSA(Reference Ma, Pavlova and Li13,Reference Chung, Yegneswaran and Liao21) . The validation of the STOPBANG questionnaire in a Chinese population is supported by a previous study demonstrating high sensitivity (91–94 %)(Reference Nagappa, Liao and Wong22). In our secondary analysis, we examined the relation between alcohol and OSA status.
Overall sleep quality
As detailed elsewhere, overall sleep quality was calculated based on the combination of the four sleep parameters assessed in 2012, each scored 0–2, with a total score of 8 (0 = best sleep quality, 8 = worst sleep quality)(Reference Li, Huang and Hou17). A person without insomnia (AIS score < 6) or with insomnia (AIS score ≥ 6) was scored either 0 or 2. A person without daytime sleepiness (ESS score < 10) or with excessive daytime sleepiness (ESS score ≥ 10) was scored either 0 or 2. Participants with a sleep duration of <6·0 h/d or ≥8·0 h/d was scored 2, while a sleep duration of 6·0–6·9 h/d was scored 1 and a sleep duration of 7·0–7·9 h/d was scored 0. Self-reported snoring was classified into three score groups (none = 0, occasional = 1, frequent = 2).
Measurement of potential covariates
Potential covariates were selected because they either had association with alcohol consumption or had association with sleep quality(Reference Chakravorty, Chaudhary and Brower6,Reference Huang, Li and Shearer15,Reference Wong, Li and Pavlova23) . Information on age, sex, occupation (two groups: blue-collar/white-collar), education level (three groups: primary, middle, and college or higher), income level (three groups: <500, 500–1000 and >1000 RMB/month), smoking status and physical activity was collected via a questionnaire in 2006 and repeated every 2 years(Reference Wu, An and Li24). The smoking status of participants was categorised into three groups: never, past smoker and current smoker. Physical activity, with a definition of lasting at least 20 min, was divided into three groups, including never, <4 times/week and ≥4 times/week(Reference Wu, An and Li24).
The weight and height of each participant were measured by trained study staff (nurses and physicians). BMI (in kg/m2) was calculated by dividing body weight (in kg) by the square of height (in m2). BMI was then divided into categories of normal weight (<24 kg/m2), overweight (24–27·9 kg/m2) and obese (≥28 kg/m2)(Reference Zhou25,Reference Chen and Lu26) . Brachial blood pressure was measured twice with participants in the seated position using a mercury sphygmomanometer. The average of two measurements of systolic and diastolic blood pressure was calculated. Participants were assigned to the hypertension group if their systolic or diastolic blood pressure was elevated (> 140 or 90 mmHg, respectively) or they self-reported a history of hypertension(Reference Liu27). Prehypertension was defined as systolic blood pressure between 120 and 139 mmHg or diastolic blood pressure between 80 and 90 mmHg(Reference Liu27).
Fasting blood samples were collected from participants at the Kailuan Hospital to measure the concentration of glucose, HDL-cholesterol, LDL-cholesterol, TAG and urate using an autoanalyzer (Hitachi 747; Hitachi). Diabetes was defined as a self-reported history of a diagnosis of diabetes, a fasting blood glucose ≥7·0 mmol/l or the use of an oral hypoglycaemic agent(28). Prediabetes was defined as a fasting blood glucose concentration ranging from a 5·6 to 6·9 mmol/l(28).
Statistical analysis
The statistical analyses were conducted using SAS software, version 9.4 (SAS Institute Inc.). The significance level of the two-sided hypothesis tests was 0·05.
We used a linear regression model to calculate the mean differences and 95 % CI for overall sleep quality score across different alcohol intake categories, adjusting for age, sex, education level, occupation, income level, smoking status, hypertension, diabetes, physical activity, BMI and plasma concentrations of TAG, HDL-cholesterol, LDL-cholesterol and urate. Three models were conducted. Model 1 was adjusted for age and sex. Model 2 was additionally adjusted for education level, occupation, income level, smoking status, hypertension, diabetes, physical activity and BMI. Model 3 was further adjusted for some potential intermediators in the alcohol-sleep pathway, including plasma concentrations of TAG, HDL-cholesterol, LDL-cholesterol and urate although we were aware of the possibility of over-adjustment.
A logistic regression model was conducted to calculate the adjusted OR and 95 % CI for the odds of having each individual sleep disorder (insomnia, daytime sleepiness, sleep duration and snoring), based on alcohol intake levels, with adjustment for the aforementioned covariates.
Results
Participants (n 11 905) with higher alcohol intake were more likely to be men, current smokers, have a low education level, a low-income level (<500 and 500–1000 RMB/month), blue-collar occupation, hypertension and higher concentrations of HDL-cholesterol, LDL-cholesterol, TAG and urate (Table 1).
Table 1 Demographic and clinical characteristics of participants according to alcohol consumption status in 2006*,†
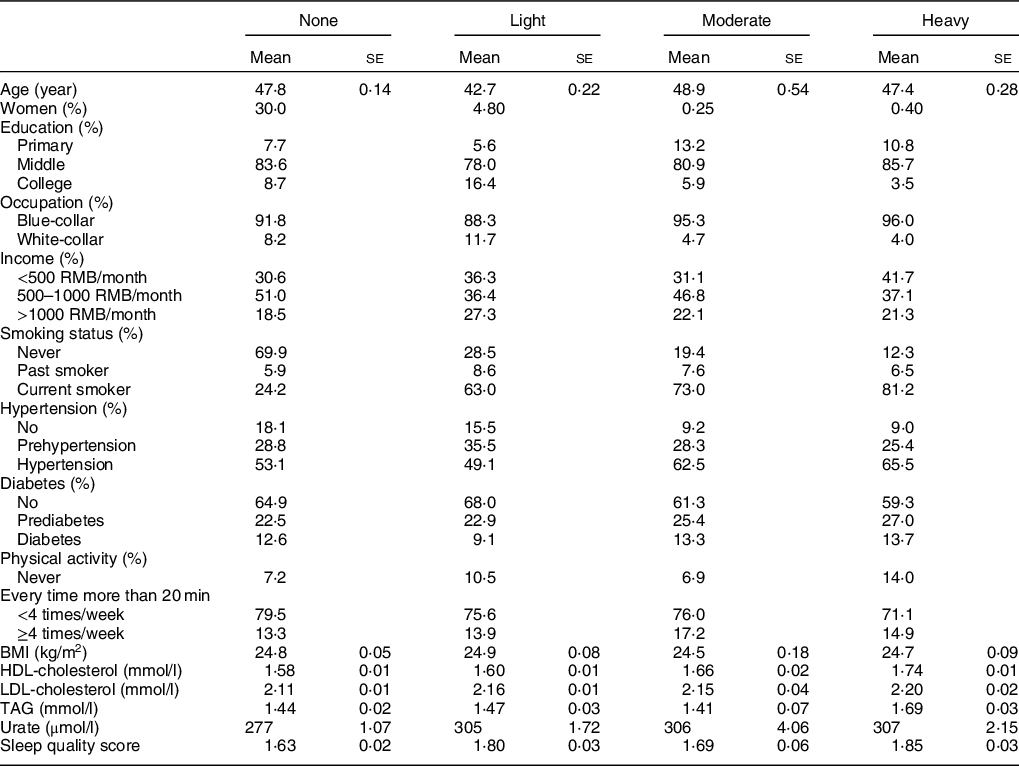
* Values are mean (se) adjusted for age and sex, or percentages.
† Participants were categorised into non-drinkers, light drinkers (women: 0–0·4 serving/d; men: 0–0·9 serving/d), moderate drinkers (women: 0·5–1·0 serving/d; men: 1·0–2·0 servings/d) and heavy drinkers (women: >1·0 servings/d; men: >2·0 servings/d).
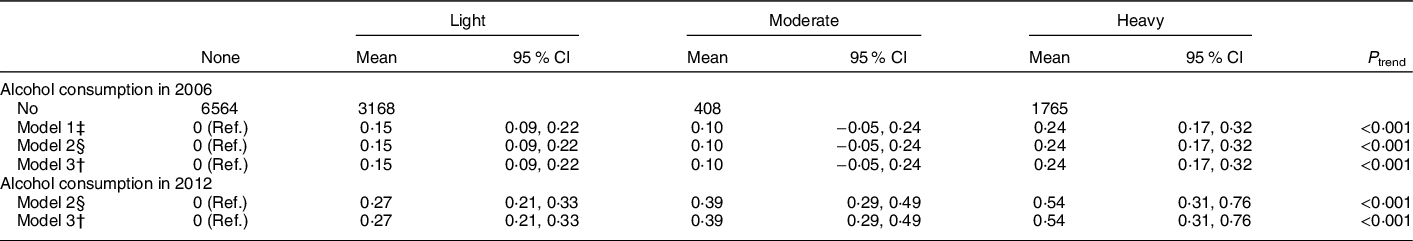
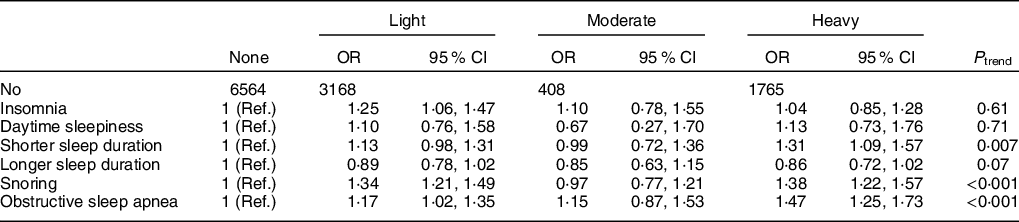
Higher alcohol consumption in 2006 was associated with worse overall sleep quality (P trend < 0·001, Table 2), after adjusting for sex, age, education level, occupation, income level, smoking status, hypertension, diabetes, physical activity and BMI (Table 2). Same results were found after including lipid profiles and urate concentrations (Table 2). Similar patterns were observed when we used the 2012 alcohol intake as the exposure (Table 2). We observed significant associations between higher alcohol consumption and higher odds of having short sleep duration, and snoring (Table 3). Consistently, alcohol was also significantly associated with increased odds of having OSA (Table 3).
Table 2 The adjusted mean differences and 95 % CI of sleep quality score, according to alcohol consumption status*,†
Ref, Reference.
* Participants were categorised into non-drinkers, light drinkers (women: 0–0·4 servings/d; men: 0–0·9 servings/d), moderate drinkers (women: 0·5–1·0 servings/d; men: 1·0–2·0 servings/d) and heavy drinkers (women: >1·0 serving/d; men: >2·0 servings/d).
† Adjusted for age, sex, education level (primary, middle or college and higher), occupation (blue-collar/white-collar), income level (<500, 500–1000 or >1000 RMB/month), smoking status (never, past or current smoker), hypertension (no, prehypertension or hypertension), diabetes (no, prediabetes or diabetes), physical activity (never, <4 times/week or ≥4 times/week) BMI (<24, 24–28 or ≥28 kg/m2) and plasma concentrations of TAG (quartiles), LDL-cholesterol (quartiles), HDL-cholesterol (quartiles) and urate (quartiles).
‡ Adjusted for age, sex.
§ Adjusted for age, sex, education level (primary, middle or college and higher), occupation (blue-collar/white-collar), income level (<500, 500–1000 or >1000 RMB/month), smoking status (never, past or current smoker), hypertension (no, prehypertension or hypertension), diabetes (no, prediabetes or diabetes), physical activity (never, <4 times/week or ≥4 times/week) and BMI (<24, 24–28 or ≥28 kg/m2).
Table 3 The adjusted OR and 95 % CI of sleep disorders, according to alcohol consumption status in 2006*,†
Ref, Reference.
* Participants were categorised into non-drinkers, light drinkers (women: 0–0·4 servings/d; men: 0–0·9 servings/d), moderate drinkers (women: 0·5–1·0 servings/d; men: 1·0–2·0 servings/d) and heavy drinkers (women: >1·0 serving/d; men: >2·0 servings/d).
† Adjusted for age, sex, education level (primary, middle or college and higher), occupation (blue-collar/white-collar), income level (<500, 500–1000 or >1000 RMB/month), smoking status (never, past or current smoker), hypertension (no, prehypertension or hypertension), diabetes (no, prediabetes or diabetes), physical activity (never, <4 times/week or ≥4 times/week) BMI (<24, 24–28 or ≥28 kg/m2), plasma concentrations of TAG (quartiles), LDL-cholesterol (quartiles), HDL-cholesterol (quartiles) and urate (quartiles).
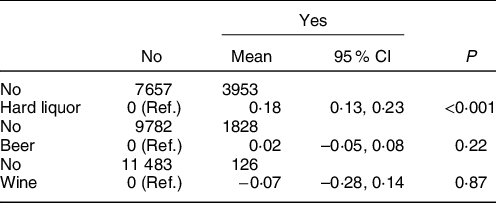
Individual alcoholic beverages were further studied. Participants who consumed hard liquor, but not wine and beer, were more likely to have worse overall sleep quality when compared with people who did not consume liquor (adjusted mean differences = 0·18; 95 % CI: 0·13, 0·23 with P < 0·001) (Table 4).
Table 4 The adjusted mean difference and 95 % CI of sleep quality by types of alcoholic beverage*,†,‡
Ref, Reference.
* Participants were categorised into beer drinkers and non-beer drinkers (non-drinkers and other alcoholic beverage drinkers), wine drinkers and non-wine drinkers (non-drinkers and other alcoholic beverage drinkers), liquor drinkers and non-liquor drinkers (non-drinkers and other alcoholic beverage drinkers).
† Adjusted for age, sex, education level (primary, middle or college and higher), occupation (blue-collar/white-collar), income level (<500, 500–1000 or >1000 RMB/month), smoking status (never, past or current smoker), hypertension (no, prehypertension or hypertension), diabetes (no, prediabetes or diabetes), physical activity (never, <4 times/week or ≥4 times/week), BMI (<24, 24–28 or ≥28 kg/m2), plasma concentrations of TAG (quartiles), LDL-cholesterol (quartiles), HDL-cholesterol (quartiles) and urate (quartiles).
‡ ‘No’ group with participants who did not drink any alcohol or did not drink the indicated type of alcoholic beverage; ‘Yes’ group with participants who drank the indicated type of alcoholic beverage.
Discussion
In this community-based study with 11 905 participants, we observed a significant linear association between alcohol intake and poor overall sleep quality 6 years later. Specifically, individuals with a higher alcohol consumption had higher odds of experiencing short sleep duration, snoring and OSA.
Our findings are consistent with the literature, although previous studies were generally conducted among populations suffering from alcoholism or alcohol abuse(Reference Bensley, Seelig and Armenta11,Reference Laniepce, Segobin and Lannuzel29,Reference Hasler, Martin and Wood30) . A recent large-scale study, including 151 567 adults with problematic alcohol consumption and post-traumatic stress disorder symptoms, found an inverse association between alcohol consumption and sleep quality(Reference Bensley, Seelig and Armenta11). Another recent study, investigating the relationship between AUD, with and without Korsakoff’s syndrome and sleep quality, showed that the sleep complaints were prevalent among the participants with AUD(Reference Laniepce, Segobin and Lannuzel29). A longitudinal study with 696 adolescents (12–19 years old) found that insomnia and sleep problems may be a consistent problem for adolescents with AUD and may also be a risk factor for the development of AUD in adolescents(Reference Hasler, Martin and Wood30).
We observed a significant positive dose–response association between alcohol consumption and the odds of snoring (including OSA), and short sleep duration. The association between alcohol and snoring/OSA may be explained by the known effects of alcohol on the respiratory system, including upper airway narrowing, reducing hypoglossal muscle activity, increased nasal resistance and reduced ventilatory responses to asphyxia, which may increase the risk of snoring/OSA(Reference Kolla, Foroughi and Saeidifard5,Reference Nagayoshi, Yamagishi and Tanigawa7,Reference Jung, Kim and Min8) . Alcohol may also impact sleep duration via circadian rhythm dysregulation, increased physiological arousal and competition with neuroimmune and neurotransmitter systems (i.e., Ca current in the thalamus, adenosine) caused by the metabolism of ethanol(Reference Miyata, Noda and Ito1,Reference Elmenhorst, Elmenhorst and Benderoth2,Reference Chakravorty, Chaudhary and Brower6,Reference Carden, Alexander and Friedman31) . Alcohol may also directly disrupt the sleep cycle, which could reduce sleep duration(Reference Miyata, Noda and Ito1,Reference Elmenhorst, Elmenhorst and Benderoth2,Reference Chakravorty, Chaudhary and Brower6,Reference Carden, Alexander and Friedman31) . Although associations between alcohol consumption and insomnia, daytime sleepiness and longer sleep duration did not reach significance, trends existed that demonstrated higher odds of these sleep disorders with increased alcohol intake, which is consistent with previous studies(Reference Chakravorty, Chaudhary and Brower6).
We found a significant association between higher consumption of hard liquor, but not beer or wine, and poor overall sleep quality. A majority of the Kailuan Study’s participants report drinking hard liquor, which is consistent with the alcohol intake culture in northern China. The significant association between hard liquor and sleep quality, not present for beer and wine, may be explained by the higher concentration of alcohol in hard liquor compared with beer and wine (5·0 g ethanol for 100 g beer, 12·0 g ethanol for 100 g wine, 40·0 g ethanol for 100 g hard liquor). The small sample sizes in the groups of beer- and wine-drinkers may also have contributed to the non-significant results.
Our study had several limitations. Sleep status was only assessed in 2012, so we cannot assess the effects of the alcohol on subsequent change in sleep quality. Therefore, our study should be considered a cross-sectional analysis. However, using alcohol consumption at different time points (e.g., assessed 6 years prior to sleep assessment or at the same time as sleep assessment) generated similar results. Misclassification of the exposure (alcohol intake) and outcome (sleep quality) is another concern, because the alcohol consumption and sleep status data were collected via self-report questionnaires. Residual confounding is another limitation. For example, the Kailuan Study did not collect data on depression until 2016(Reference Shen, Li and Schwarzschild32), which was thus not adjusted in the current analysis. However, the prevalence of physician-diagnosed depression (0·13 %) was low among the Kailuan participants(Reference Shen, Li and Schwarzschild32), although it could be underdiagnosed. Further, the Kailuan Study is located in Tangshan city, China, and included a large portion of individuals with low-to-middle education levels and low-income, which may limit the generalisability of the findings to other ethnic groups.
In conclusion, greater alcohol consumption was associated with poorer sleep quality and higher odds of having snoring and short sleep duration, in a dose–response manner. Our findings warrant replication in a prospective study conducted in populations with diverse cultural backgrounds and objective assessment of sleep status.
Acknowledgements
Acknowledgements: None. Financial support: This work is supported by the start-up grant from the College of Health and Human Development and the Department of Nutritional Sciences, Penn State University. Conflict of interest: None. Authorship: S.W. and X.G. had full access to all of the data in the study and take responsibility for the integrity of the data and the accuracy of the data analysis. Concept and design: S.W. and X.G. Acquisition, analysis or interpretation of data: All authors. Drafting the manuscript: D.Z. Critical revision of the manuscript for important intellectual content: All authors. Statistical analysis: C.M. Obtained funding: X.G. Administrative, technical or material support: X.Y., C.M., Y.L., H.V.E., Y.S. and S.W. Supervision: S.W. and X.G. Ethics of human subject participation: The study was conducted according to the guidelines laid down in the Declaration of Helsinki and all procedures involving human subjects/patients were approved by the Ethics Committee of the Kailuan General Hospital. Written informed consent was obtained from all participants.


