


Accurate assessment of young children's diets is essential in order to examine relationships between early dietary experiences and later health outcomes. However, accurate assessment of the diets of young children is notoriously difficult. First, young children do not have the cognitive ability to report their own dietary intake and therefore researchers generally rely on the information coming from the child's caregiver. This may prove problematic if responsibility for the study child is shared (for example if the child spends time in a nursery or with grandparents) and the caregiver providing the dietary information does not have knowledge of all foods consumed. Second, portion sizes are difficult to ascertain as the caregiver may report the amount of food that the child was given – not necessarily how much the child actually consumed. Third, young children's food habits change rapidly thus making assessment of habitual diet difficult( Reference Stein, Shea and Basch 1 , Reference Serdula, Alexander and Scanlon 2 ).
Food diaries (FD) have been regarded for many years as the ‘gold standard’ of dietary assessment( Reference Gibney, Margetts and Kearney 3 ). Assessing dietary intake of young children using FD requires the caregiver to document detailed information on all food and drinks that the study child has consumed over a certain time period, usually a few days. While FD are often considered the most accurate method, they are burdensome for the reporter which may bias study participation( Reference Rockett and Colditz 4 ) and response rates may be low. FFQ have been widely used in large-scale studies of adults and have been shown to be an effective tool for ranking individuals in terms of their nutrient intakes( Reference Cade, Thompson and Burley 5 ). FFQ cover a longer time frame than short-term records (e.g. 24 h recalls or FD) and therefore may provide a better approximation of habitual diet( Reference Margetts, Cade and Osmond 6 ). However, they have been less commonly used to assess the diets of children. Previous studies evaluating the use of FFQ to assess children's diets have raised concerns that FFQ overestimate intakes( Reference Serdula, Alexander and Scanlon 2 ), although nutrient intakes assessed using FFQ appear to show reasonable ranking when compared with 24 h recalls( Reference Parrish, Marshall and Krebs 7 ), FD( Reference Ortiz-Andrellucchi, Henriquez-Sanchez and Sanchez-Villegas 8 ) and some biomarkers( 9 ). Little is known about the determinants of reporting error when assessing the diets of young children. In their 2001 review of dietary assessment methods for pre-school children, Serdula et al. pointed to the need for an evaluation of the maternal and child factors that may influence misreporting( Reference Serdula, Alexander and Scanlon 2 ). The challenges of dietary assessment for children of this age were also highlighted in a more recent review for the US National Children's Study( 9 ), which concluded that there is a need for larger validation studies, conducted in more representative populations.
We have previously described the use of FFQ to assess the diets of infants at 6 and 12 months of age( Reference Marriott, Inskip and Borland 10 , Reference Marriott, Robinson and Poole 11 ) in a large prospective study of mothers and children, the Southampton Women's Survey (SWS). In the present paper we evaluate the use of a new FFQ developed to describe the diets of SWS children when they were aged 3 years. In a group of 892 SWS children we compare energy and nutrient intakes and a measure of dietary quality assessed by the FFQ with those determined using a prospective 2 d FD. In addition, we consider some of the background factors that may affect the ability of the FFQ to rank children according to intakes of selected nutrients and diet quality, when compared with the FD.
Methods
The Southampton Women's Survey
The SWS is a large prospective cohort study of mothers and children that began in 1998. The study recruited 12 583 non-pregnant women aged 20–34 years. Detailed information about their diet and sociodemographic factors was collected upon enrolment and height and weight were measured( Reference Inskip, Godfrey and Robinson 12 ). Children who were subsequently born to SWS women were followed up at home by trained research nurses at the ages of 6 and 12 months, and at 2 and 3 years. There were 1981 singleton live births to women in the SWS up to the end of 2003. A total of 1640 (83 %) of these children were followed-up at 3 years of age. A trained research nurse interviewed the child's main caregiver, usually the mother (99·5 %), in the child's home, to collect information about the child's diet, eating behaviour, physical activity, sleep pattern and illnesses. The number of times per week over the past 3 months the child had consumed meals (excluding snacks) away from home was recorded. The child's nibbling behaviour was categorised as ‘nibbles during the day, rarely eats meals’; ‘nibbles during the day but also has meals’; ‘nibbles on some days but also has meals’; ‘doesn't nibble much, just has meals’. Caregivers were also asked if they had restricted the type or amount of food the child had consumed over this period. During the study visit the nurse measured the child's height (Leicester height measurer; Seca Ltd, Birmingham, UK) and weight (calibrated digital scales; Seca Ltd). The study was conducted according to the guidelines laid down in the Declaration of Helsinki and all procedures involving human subjects were approved by the Southampton and South West Hampshire Local Research Ethics Committee. Written informed consent was obtained from all participants.
FFQ
Diet was assessed using an eighty-item FFQ that was administered by trained research nurses( Reference Fisk, Crozier and Inskip 13 ). The list of food and beverage items was compiled from a review of dietary intake data collected from a nationally representative sample of children aged 3 years( Reference Gregory, Collins and Davies 14 ), SWS infants( Reference Robinson, Marriott and Poole 15 ) and SWS women( Reference Robinson, Crozier and Borland 16 ) and 3-year-olds in the Avon Longitudinal Study of Pregnancy and Childhood( Reference North and Emmett 17 ). The FFQ asked how often in the last 3 months the child had consumed each of the food and beverage items. The response options were never, less than once per month, 1–3 times per month, number of times per week (1–7) or more than once per day. If a food was consumed more than once per day, the number of times was recorded. Prompt cards were used during the interview to show examples of the foods included in each food group and to help standardise the responses to the FFQ. Portion sizes were recorded for all foods. Portions were quantified using normal household measures (e.g. tablespoons) or typical portions (e.g. slices of bread); visual aids were also used to standardise portions that could be subjective (e.g. slice of pizza). At the end of the FFQ, additional information was collected relating to milk consumption and sugar added to food and/or drinks each day. This included information on the type and quantity of milk consumed and the number of teaspoons of sugar added to the child's food and drinks. Frequencies of consumption and amounts of foods not listed in the FFQ were also recorded if they were consumed once per week or more. Dose and frequency of dietary supplements taken in the preceding 3 months were recorded.
Food diary
At the end of the visit, caregivers were invited to complete a 2 d prospective FD on behalf of the child. In an open diary, they were asked to record all food and drinks consumed by the child from midnight the day following the interview until midnight two days later; food and drinks were described by weight, size (measured dimensions using a ruler), number or in terms of a household measure (e.g. tablespoon). Details on cooking method, brand names, ingredients of meals and leftovers were also requested. If the child had taken any dietary supplements over the 2 d period these were recorded. The completed FD was returned by post using a prepaid envelope. Upon receipt the FD was checked by a member of the research team for completeness; in the case of missing or illegible information the caregiver was telephoned to obtain clarification. Eight hundred and ninety-two (54 %) participants returned a complete FD.
Dietary analysis
To calculate nutrient intakes from the FFQ and FD, the portion weights of foods were multiplied by their nutrient content. The food composition database was based on McCance and Widdowson's The Composition of Foods, 5th edition( Reference Holland, Welch and Unwin 18 ) and all related supplementary volumes( Reference Chan, Brown and Church 19 – Reference Holland, Welch and Buss 27 ), together with recipes and information obtained from manufacturers. The composition of dietary supplements was provided by manufacturers. Nutrient intakes from supplements were calculated according to dose and frequency taken over the period covered by the FFQ and the 2 d period of the FD, and converted to average daily intakes. Total daily energy and nutrient intakes (food plus dietary supplements) are reported throughout this paper.
Prudent diet score
We have previously described the dietary patterns of the 3-year-old SWS children, that were defined using principal component analysis (PCA) of the FFQ data( Reference Fisk, Crozier and Inskip 13 ). Before the PCA, the eighty foods listed on the 3-year FFQ were grouped into forty-four groups based on similarity of type of food and nutrient composition. Milks (full fat and reduced fat) and sugar (added to food and drinks) were put into three extra groups to give a total of forty-seven groups. Most additional foods recorded at the end of the FFQ were assigned to one of these groups, but for the remaining foods, four further groups were created (baby foods, fruit purees, cream, and Yorkshire pudding and savoury pancakes), giving a total of fifty-one groups to be entered into the PCA. The first component in the PCA (that explains the greatest variance in the dietary data) described a dietary pattern that was characterised by high consumption of fruit, water and wholemeal cereals but low consumption of refined cereals, low-calorie soft drinks, crisps and confectionery( Reference Fisk, Crozier and Inskip 13 ). This pattern was termed a ‘prudent’ diet pattern as it represented a diet consistent with healthy eating recommendations and was similar to the prudent pattern that we have previously described in the SWS women( Reference Robinson, Crozier and Borland 16 ). Individual prudent diet scores were calculated by multiplying the coefficients for the food groups by the child's standardised frequencies of consumption recorded on the FFQ, and summed.
All food and beverages recorded in the FD were assigned to one of the same fifty-one food groups used for the PCA of the FFQ data. In a separate PCA of the FD data, the first dietary pattern identified was very similar to the prudent pattern defined in the PCA of the FFQ and described compliance with healthy eating guidance (data not shown). In order to compare prudent pattern scores defined using the FFQ and FD with reference to a single scale, FD-defined prudent diet scores were calculated using the coefficients from the PCA of the FFQ and the standardised frequencies of food consumption recorded in the FD. Prudent diet scores calculated using both FFQ and FD data were transformed using Fisher–Yates normal scores. This has the effect of mapping the scores on to a normal distribution with a mean of 0 and a standard deviation of 1.
Statistical analysis
The data reported in the present paper are for 892 SWS children whose diets were assessed by the FFQ and FD at 3 years. BMI values of mothers and children were calculated from height and weight measurements; maternal smoking status was defined when the child was aged 6 months. Statistical analysis was performed using the statistical software package Stata version 11·1. Spearman's rank correlation coefficients were used to describe the association between the FFQ and FD estimates of nutrient intake. All nutrients were adjusted for energy intake using the Willett method( Reference Willett 28 ) and correlation coefficients were recalculated. This method to ‘energy-adjust’ nutrients involves computing nutrient intakes as the residuals from a regression model where total energy intake and absolute nutrient intake are the independent and dependent variable, respectively. Thus the nutrient residuals provide a measure of intake which is uncorrelated with total energy intake. Percentages of over- or under-assessment of nutrient intakes by the FFQ compared with FD were obtained. A Bland–Altman plot was produced to assess the level of agreement in prudent diet scores between the two methods. As the nutrients were not normally distributed, log transformations were used prior to the Bland–Altman analysis. The Bland–Altman limits of agreement are expressed as symmetric percentages, which summarise the percentage differences between the FFQ and FD( Reference Bland and Altman 29 ). A Pearson correlation was used to compare FFQ and FD prudent diet scores. Variations in ranking from FFQ assessments compared with FD by levels of maternal and children characteristics were examined by incorporating an interaction term into a separate linear regression model for each characteristic and nutrient.
Results
Characteristics of the children and their mothers who completed the both the FFQ and FD are detailed in Table 1. Mothers had a range of educational attainment; 36 % left formal education at 16 years of age with GCSE (General Certificate of Secondary Education) level qualifications or below while 26 % reported having a university degree. In total 13 % of the children were overweight or obese, according to the cut-offs of the International Obesity Taskforce( Reference Cole, Bellizzi and Flegal 30 ). About half of the children (48 %) were described as regularly ‘nibbling’ food during the day, although most commonly this was in addition to eating meals. The majority of children (68 %) had eaten away from home regularly over the 3-month period assessed by the FFQ. Nearly half of the mothers reported that they restricted the types of foods their child consumed but only 24 % reported restricting the amount of food consumed. Twenty-five per cent of children had taken dietary supplements during the 3-month period preceding the interview, but the proportion taking supplements during the 2 d period of the FD was lower (16 %). When compared with the SWS families who did not return an FD, some differences in background characteristics were observed. Mothers who did not return an FD tended to be educated to a lower level (48 % educated to GCSE level or below, compared with 36 %, P < 0·0 0 1) and there was a small difference observed in maternal BMI (median BMI of mothers who did not return an FD was 24·7 (IQR 22·3–28·5) kg/m2, compared with 24·2 (IQR 22·0–27·0) kg/m2, P < 0·0 0 1). There was also a small difference in BMI of children according to whether a completed FD was returned or not, with 17 % of children whose mothers did not return an FD being overweight or obese v. 13 % of children of mothers who did (P = 0·001; data not shown).
Table 1 Characteristics of 892 mother–child pairs studied, Southampton Women's Survey, Southampton, UK
IQR, interquartile range; GCSE, General Certificate of Secondary Education; HND, Higher National Diploma; FD, food diary.
*Data collected when the child was 6 months old.
†Using cut-offs of the International Obesity Taskforce( Reference Cole, Bellizzi and Flegal 30 ).
Comparison of FFQ with food diary
Table 2 shows the FFQ and FD estimates of energy and nutrient intakes. In each case the FFQ estimates were higher than those obtained with the FD. However, the difference between the two assessment methods varied. Differences in macronutrient intakes tended to be smaller than differences in micronutrient intakes: differences ranged from 13 % (saturated fat) to 31 % (total sugar) for macronutrients compared with 23 % (Ca) to 52 % (vitamin C) for micronutrients. In terms of ranking children with respect to their energy and nutrient intakes, the Spearman's correlation coefficients comparing the FFQ and FD indicated moderate agreement, ranging from r s = 0·33 (energy) to 0·54 (Ca and retinol). With the exception of retinol intakes, higher correlations were found for energy-adjusted intakes (range r a = 0·41 for thiamin to 0·59 for Ca).
Table 2 Energy and nutrient intakes, assessed by the FFQ and FD, among 892 children aged 3 years, Southampton Women's Survey, Southampton, UK
r s, Spearman rank correlation coefficient; r a, energy-adjusted correlation coefficient; N/A, not applicable.
*All P < 0·001.
When considering the children's dietary patterns, we found that, in comparison with energy and nutrient intakes, prudent diet scores assessed by the FFQ and FD were more highly correlated (r = 0·72) indicating comparable ranking of children in terms of their compliance with the prudent diet pattern. To examine agreement between prudent diet scores assessed by the two dietary methods, they were compared using a Bland–Altman plot (Figure 1). The prudent diet scores from the FFQ were defined in a PCA of the full cohort (n 1640), in which the mean score was zero because the scores were standardised( Reference Fisk, Crozier and Inskip 13 ). For the children who provided FD data (n 892) in the present analysis, their prudent diet scores from the FFQ were slightly higher than the average for the full cohort, whereas the standardised scores for the FD had a mean of zero. This difference is evident on the Bland–Altman plot. Overall there was good agreement between methods; 95 % of the differences lie within +1·6 sd and −1·4 sd.
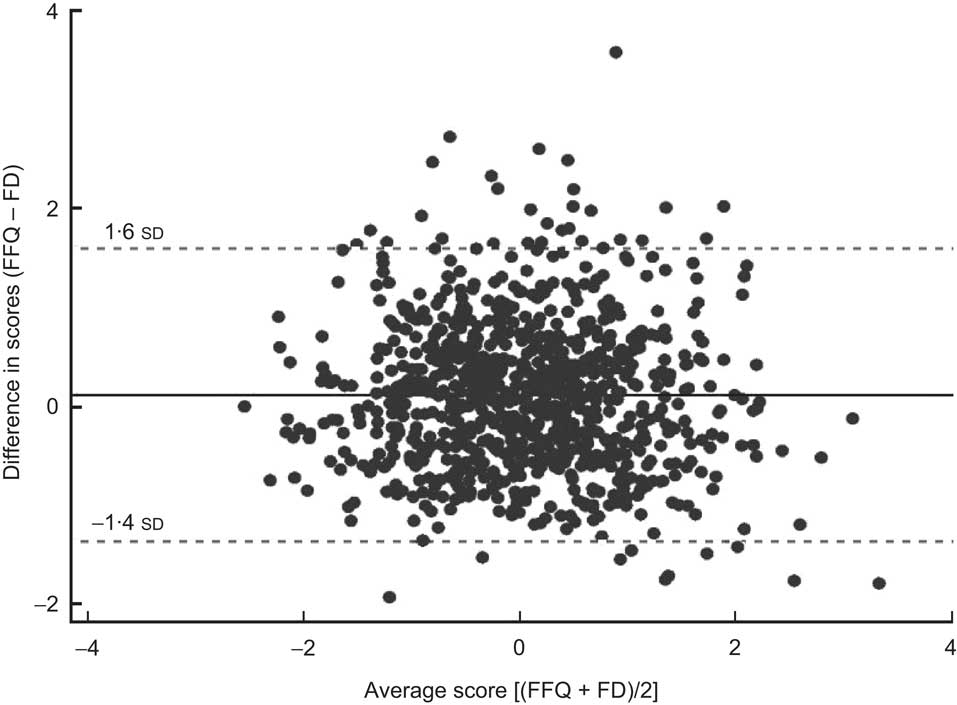
Fig. 1 Bland–Altman plot for agreement between prudent diet scores assessed by the FFQ and the 2 d food diary (FD) among 892 children aged 3 years in the Southampton Women's Survey, Southampton, UK
Comparison of ranking of children from FFQ and food diary assessments of intake and diet quality, according to mother and child characteristics and eating behaviours
Additional analyses explored how ranking of children from the FFQ and FD assessments was influenced by mother's level of education, child's BMI, number of meals the child had eaten away from home, nibbling behaviour and restriction of types of foods in the child's diet. Table 3 shows correlation coefficients for intakes of selected nutrients and prudent diet scores assessed by the two methods, split according to the characteristics of interest. Nibbling behaviour was considered in two groups as the numbers of children who rarely had meals, or who only had meals, was relatively small.
Table 3 Correlations between FFQ and FD estimates of intakes of energy and selected nutrients and prudent diet scores, according to maternal and child characteristics, among 892 children aged 3 years, Southampton Women's Survey, Southampton, UK*,†,‡
FD, food diary; GCSE, General Certificate of Secondary Education.
*Text in bold indicates significant differences in the associations between FFQ and FD according to level of the maternal and child characteristic, assessed by test for interaction in linear regression.
†Nutrients were energy-adjusted.
‡Spearman rank correlations are shown for nutrients; Pearson correlation coefficients are shown for prudent diet score.
There were no differences observed according to the BMI status of the child. However, some differences were found for other characteristics; significant interactions are shown in Table 3 in bold. Higher correlations, indicating more comparable ranking of children with respect to energy intakes, were found for children born to mothers with lower levels of educational attainment (P = 0·01). Single differences were also observed according to nibbling behaviour (vitamin D) and restriction of foods (Ca). However, the most consistent differences appeared to be in relation to the number of meals the child ate away from home during the 3-month period assessed by the FFQ. Poorer consistency of ranking of children was found among those who regularly ate away from home in terms of Ca intake and prudent diet score (P < 0·001 and P = 0·01 respectively); a comparable pattern was also seen for energy, fat and vitamin D intakes although these interactions were not statistically significant. As the poorer ranking of children according to energy intake observed among more highly educated mothers was unexpected, further analyses explored the association between educational attainment and number of meals eaten by the child away from home. These showed that level of maternal education and frequency of meals eaten away from home were linked, such that higher educational attainment was associated with greater frequency of meals consumed away from home. For example, 29 % of children whose mothers had a high level of educational attainment consumed more than four meals per week away from home as compared with only 18 % of children whose mothers were more poorly educated (P < 0·0 0 1).
Discussion
In a large population sample of children aged 3 years we have evaluated the use of a new FFQ to assess diet by comparison with a prospective 2 d FD. We found that the FFQ appears to provide useful information to enable ranking of children in terms of their nutrient intake and quality of their diets, but in comparison with the FD, estimates of absolute intake were higher. In examining the impact of maternal and child characteristics on reporting error, we found that these characteristics may be of importance when assessing the diets of young children using an FFQ, most notably the number of meals eaten by the child away from home.
Absolute intakes assessed by the FFQ
Intakes assessed by the FFQ were consistently higher than those assessed by the FD. The largest differences were observed for micronutrient intake; differences ranged from 23 to 52 % compared with 13 to 31 % for macronutrients. While some of the differences in micronutrient intake may be due to having more accurate composition data for individual foods recorded in the FD, the mean difference in energy intake (17 %) is of concern and suggests either over-reporting of the child's intake in response to the administered FFQ and/or incomplete recording in the FD. That higher intakes were assessed by the FFQ is consistent with our earlier findings using an FFQ to assess the diets of the SWS children when they were aged 12 months (mean difference 19 %( Reference Marriott, Inskip and Borland 10 )) and with other published validation studies of FFQ designed to assess the diets of pre-school children( Reference Serdula, Alexander and Scanlon 2 , 9 ). For example, Stein and colleagues( Reference Stein, Shea and Basch 31 ) found that an FFQ used to assess the diets of 224 children aged 3·5–5 years (administered at two time points) overestimated absolute intakes of energy and all nutrients except Na when compared with mean intakes from four 24 h recalls (intake estimates were 1·4–1·9 times higher). Similarly Parrish et al. ( Reference Parrish, Marshall and Krebs 7 ) observed consistent overestimation of nutrient intakes assessed by an FFQ in sixty-eight pre-school children when compared with those assessed by three 24 h recalls (70 % overestimation of energy intake). These differences in absolute intakes may be explained by difficulties encountered by caregivers in describing portion size and/or frequency of foods consumed by the child – a concern that has been highlighted in a review of dietary assessment methods in pre-school children( Reference Serdula, Alexander and Scanlon 2 ). In the present study it is unlikely that the differences between the FFQ and FD can be explained by under-reporting of intake during the FD, as the estimate of energy intake (kJ/kg body weight) was in the expected range, and slightly higher than published energy requirements for children of this age (334 and 320 kJ/kg for boys and girls aged 3–3·9 years, respectively( Reference Torun 32 )).
Ranking of children by the FFQ
In contrast to differences in estimates of absolute intake, the ranking of children in terms of nutrient intake appeared to be reasonably comparable using the FFQ and FD. When we compared the present data with the correlations for the FFQ we used to assess the diet of SWS infants at 12 months of age( Reference Marriott, Inskip and Borland 10 ) we found the range of coefficients at 3 years was slightly narrower (range for energy-adjusted nutrient intakes was 0·41–0·59 at 3 years (Table 2), compared with 0·31–0·71 for the same nutrients assessed at 12 months( Reference Marriott, Inskip and Borland 10 )). Our data are consistent with other published validation studies of FFQ used to assess the diets of young children. Andersen( Reference Andersen, Lande and Trygg 33 ) and colleagues carried out a study to validate an FFQ against a 7 d weighed FD in 187 children aged 2 years in Norway and observed correlation coefficients ranging from 0·26 to 0·50. In comparison, Stein et al. ( Reference Stein, Shea and Basch 31 ) validated an FFQ against multiple 24 h recalls in 4–5-year-old children in America and similarly found the FFQ to rank the children reasonably well, with correlations ranging from 0·16 to 0·60.
In comparison with the FFQ ranking of children in terms of their energy and nutrient intakes, prudent pattern scores were highly correlated with scores defined from the FD (correlation coefficient 0·72), indicating very comparable assessment of quality of the children's diets by the two dietary methods. While, to our knowledge, dietary pattern scores of pre-school children assessed by different dietary methods have not been evaluated before, this finding is in line with other published data from our group. At 6 months, the correlation for SWS infants’ scores for the first PCA component (‘infant guidelines’ pattern) assessed by FFQ and 24 h recall was 0·81( Reference Robinson, Marriott and Poole 15 ), while among a group of pregnant women the correlation for prudent diet scores assessed by an FFQ and a 4 d FD was 0·67( Reference Crozier, Inskip and Godfrey 34 ). Our findings are also consistent with other adult studies( Reference Khani, Ye and Terry 35 , Reference Hu, Rimm and Smith-Warner 36 ) in which FFQ have been shown to identify similar patterns of diet as other dietary methods and that dietary pattern scores determined using different dietary methods are highly correlated. While there are concerns about the measurement error associated with estimates of nutrient intakes assessed using FFQ( 9 ), they may be particularly well suited to the description of broader dietary patterns.
Influences on reporting diet using the FFQ
We considered a number of maternal and child factors that could affect the accuracy of describing diet in response to our administered FFQ when the children were aged 3 years( 9 ). We observed some small differences according to the child's eating behaviour for individual nutrients (nibbling frequency, restriction of types of foods), but there were no differences according to the weight status of the child. The most consistent pattern of association appeared to be in relation to the number of meals eaten by the child away from home during the 3-month period covered by the FFQ. Unsurprisingly, higher correlations were observed among children who ate at home (Ca intakes, prudent diet scores); this pattern was also evident for the other nutrients considered, although the interactions were not statistically significant. Our findings differ from the study by Parrish et al. ( Reference Parrish, Marshall and Krebs 7 ), in which estimated nutrient intakes assessed by FFQ and three 24 h recalls were compared in sixty-eight children of pre-school age. In that study the authors assessed the differences in agreement between the assessment methods in children whose mothers were the sole provider of meals over the reference time period compared with those who were not. The authors did not find differences, and suggested that mothers who were not the sole provider of their children's meals were able to report as accurately as those who were. It is not clear whether these differing findings are explained by the different sizes of the groups studied or the setting in which the research was undertaken, and further work is needed. However, it would seem likely that proxy reporting of dietary intake might be expected to be poorer for children who routinely consume meals away from home( Reference Baranowski, Sprague and Baranowski 37 ) – an effect that may be more marked among children at older ages. Our findings suggest that establishing the balance of food consumed in the home/outside the home could be useful data to collect in future dietary studies of young children.
An unexpected finding in the present study was that there were higher correlations between the FFQ and FD estimates of energy intake in the children whose mothers had lower levels of educational attainment. The link between educational attainment and misreporting of children's diets is not clear. It has been hypothesised that educational attainment might affect a person's cognitive skill and therefore ability to recall and estimate portion size( Reference Vereecken, Covents and Maes 38 ). However, the few studies that have considered reporting error in relation to educational attainment of parents have returned inconsistent results. Andersen and colleagues found no significant differences by educational level when comparing absolute intakes of their FFQ with a 7 d FD( Reference Andersen, Lande and Trygg 33 ). However, Vereecken et al. ( Reference Vereecken, Covents and Maes 38 ) found that mothers with low educational attainment significantly underestimated their child's percentage of energy from fat in their FFQ compared with use of an online dietary assessment tool. This lack of consistency could be explained by variations in maternal work patterns and associated childcare arrangements that differ according to level of educational attainment. Our findings would be consistent with this suggestion, as when compared with other children, the children whose mothers were highly educated consumed their meals away from home more frequently, which in turn was associated with lower correlations between FFQ and FD estimates of energy intake.
Strengths and weaknesses
Strengths of the present study are that the FFQ was administered by trained research nurses and the size of the population studied. Our study was considerably larger than traditional validation studies in similar populations and addresses the recommendation from the US National Children's Study review that validation studies of dietary assessment methods in pre-school children need to include larger, more representative populations( 9 ). A limitation is that we did not have an FD returned by all SWS children who were followed up at 3 years, although the 892 children studied are from a wide range of backgrounds and represent many characteristics that are comparable with the wider UK population( Reference Inskip, Godfrey and Robinson 12 ). We would therefore hope that our findings should be applicable across the whole cohort. A further limitation may arise from our use of a 2 d FD as the reference method, which varied in terms of the combinations of weekdays and weekend days included. While estimates of energy intake by the FD were consistent with expected values, and widespread under-reporting in the FD seems unlikely, its short duration may be an important limitation in terms of its ability to capture the habitual diet of the children. This may be better described by the FFQ and it is possible therefore that in using a short FD we have underestimated the true level of agreement between these two dietary assessment methods.
Conclusion
In a large population of young children we have evaluated the use of a new FFQ. While there may be particular challenges in using FFQ to assess absolute nutrient intake at this age, we have shown that an FFQ can be used to provide sufficient information to rank the children effectively according to nutrient intake. FFQ may be particularly well suited to the assessment of dietary patterns – and in our study, in the description of children's quality of diet and their compliance with healthy eating guidance.
Acknowledgements
Sources of funding: The study was supported by the Medical Research Council, the University of Southampton, the British Heart Foundation and the Food Standards Agency. M.J. and K.M.G. are supported by the National Institute for Health Research through the NIHR Southampton Biomedical Research Centre. Conflicts of interest: None of the authors had a conflict of interest. Authors’ contributions: H.M.I., K.M.G., S.M.R. and C.C. designed and ran the SWS. The data were analysed by M.J., G.N. and S.R.C.; C.M.F. was responsible for the dietary data. M.J. and S.M.R. wrote the first draft of the manuscript; all authors contributed to the interpretation of the data. Acknowledgements: The authors thank all the families who participated in the SWS and the SWS research and computing staff.


