


In 2016, approximately 12 % of US households (41·2 million people) experienced food insecurity, or lack of consistent access to enough food for an active, healthy life( Reference Coleman-Jensen, Rabbitt and Matthew 1 ). Studies have found that food insecurity is related to increased likelihood of obesity( Reference Adams, Grummer-Strawn and Chavez 2 , Reference Townsend, Peerson and Love 3 ). Further, adults who experience food insecurity are at increased odds of stroke, arthritis, diabetes, chronic heart disease, hypertension and heart attack compared with their food-secure counterparts. The US Department of Agriculture (USDA) recommends that food insecurity be assessed among all populations as it is often considered ‘a direct measure of well-being’ and has many potential health consequences( Reference Nord and Prell 4 ). Research suggests that food-insecure adolescents and young adults are at high risk for diminished academic performance, less healthy dietary intake and poorer mental, social and overall health( Reference Jyoti, Frongillo and Jones 5 – Reference Rose 7 ).
Multiple factors associated with the college experience may make college students particularly vulnerable to food insecurity. When students transition to college, they may be faced with a new-found independence, financial burdens and stressors( Reference Cason and Wenrich 8 – Reference Pancer, Hunsberger and Pratt 10 ). All or part of the responsibility of financial provision may fall upon the student. Annual increases in tuition costs may enhance these financial burdens and other factors like increased living costs or reliance on financial aid may also contribute to food insecurity in this population( 11 – Reference Maroto, Snelling and Linck 13 ).
In recent years, research studies have begun to assess prevalence of food insecurity among college students. In these studies, food insecurity prevalence among college students in the USA ranged from 14 to 59 %( Reference Gaines, Robb and Knol 12 – Reference Payne-Sturges, Tjaden and Caldeira 21 ). A recent systematic review found that the average food insecurity rate among college students was 42 %( Reference Bruening, Argo and Payne-Sturges 22 ). These numbers are problematically high, but it is important to note that a wide variety of food insecurity assessment techniques were used in these studies, including the USDA ten-item Adult Food Security Survey Module (AFSSM)( Reference Gaines, Robb and Knol 12 , Reference Maroto, Snelling and Linck 13 , Reference Chaparro, Zaghloul and Holck 16 , Reference Morris, Smith and Davis 18 , Reference McArthur, Ball and Danek 20 ), the eighteen-item USDA Household Food Security Survey Module (HFSSM)( Reference Payne-Sturges, Tjaden and Caldeira 21 ), the six-item short form of the USDA HFSSM( Reference Bruening, van Woerden and Todd 15 , Reference Mirabitur, Peterson and Rathz 17 , Reference Patton-Lopez, Lopez-Cevallos and Cancel-Tirado 19 ), or brief one- to two-question instruments( Reference Bruening, Brennhofer and van Woerden 14 , Reference Thomas 23 ), which may have contributed to the variability in findings.
In selected studies, financial-related factors, i.e. receiving financial aid or student loans( Reference Gaines, Robb and Knol 12 , Reference Morris, Smith and Davis 18 , Reference Lin, Peters and Ford 24 ), familial financial support( Reference Payne-Sturges, Tjaden and Caldeira 21 ) or increased spending( Reference Chaparro, Zaghloul and Holck 16 , Reference McArthur, Ball and Danek 20 ), were significantly associated with prevalence of food insecurity. Students who received financial aid were at an increased risk of food insecurity( Reference Gaines, Robb and Knol 12 , Reference Morris, Smith and Davis 18 , Reference McArthur, Ball and Danek 20 ), while those who received familial financial support were at a decreased risk of food insecurity( Reference Payne-Sturges, Tjaden and Caldeira 21 ). Both generalized( Reference McArthur, Ball and Danek 20 ) and specific categorical( Reference Chaparro, Zaghloul and Holck 16 ) higher monetary expenditures, i.e. monthly spending and eating out or shopping, respectively, were associated with increased likelihood of food insecurity. While these significant relationships have been found, it is difficult to assess socio-economic factors in this population for several reasons. College students may have varying levels of financial dependence on their families. For example, students from higher socio-economic status backgrounds may spend less on essential expenses (housing, tuition, food) than students from lower socio-economic status backgrounds because of familial financial support that may cover the expenses. In addition, these socio-economic factors are highly linked; thus, efforts to appropriately assess specific financial factors of interest may be challenging in a college population. One important financial factor that has been understudied to date is the relationship between experiencing food insecurity prior to college and experiencing food insecurity during college, which may be an essential factor to address the identified high rates of food insecurity. A college education may prove to beneficial to breaking out of a possible cycle of poverty; however, food insecurity may still persist as a factor to the cycle in the collegiate environment.
In addition to financial factors, several studies identified that students experiencing food insecurity were more likely to have lower grade point averages (GPA)( Reference Maroto, Snelling and Linck 13 , Reference Morris, Smith and Davis 18 – Reference McArthur, Ball and Danek 20 ), potentially identifying a relationship that may hinder academic achievement. When comparing undergraduate and graduate students, studies at large, public universities identified a significantly increased likelihood of food insecurity among undergraduate students compared with graduate students( Reference Mirabitur, Peterson and Rathz 17 , Reference McArthur, Ball and Danek 20 ); however, these findings were not consistent across all studies( Reference Chaparro, Zaghloul and Holck 16 ).
In 2014–2016, the general population in the Southeast USA had the highest rate of food insecurity (14 %) compared with other US regions (Midwest, 12 %; West, 12 %; Northeast, 11 %)( Reference Coleman-Jensen, Rabbitt and Matthew 1 ); however, it is unknown if these higher regional rates are consistent among college populations. Currently, the two published studies at other large, public universities in the Southeast region found inconsistent rates of food insecurity, 14 and 46 %, respectively( Reference Gaines, Robb and Knol 12 , Reference McArthur, Ball and Danek 20 ). The potential negative impacts of food insecurity( Reference Rose 7 , Reference Maroto, Snelling and Linck 13 , Reference Chaparro, Zaghloul and Holck 16 , Reference Morris, Smith and Davis 18 – Reference McArthur, Ball and Danek 20 ), coupled with higher rates of food insecurity in the general population in the Southeast( Reference Coleman-Jensen, Rabbitt and Matthew 1 ) and inconsistencies in rates identified in previous research with Southeastern college populations, demonstrate the need to assess food insecurity prevalence among students at additional universities in the Southeast region. Further, more research is needed to confirm which factors increase the likelihood of experiencing food insecurity, particularly experiencing food insecurity before college, as this has been understudied to date. Food insecurity has been related to factors such as finances( Reference Gaines, Robb and Knol 12 , Reference Chaparro, Zaghloul and Holck 16 , Reference Morris, Smith and Davis 18 , Reference Patton-Lopez, Lopez-Cevallos and Cancel-Tirado 19 ) and GPA( Reference Maroto, Snelling and Linck 13 , Reference Morris, Smith and Davis 18 , Reference Patton-Lopez, Lopez-Cevallos and Cancel-Tirado 19 ) in several studies, and to factors such as housing( Reference Maroto, Snelling and Linck 13 , Reference Morris, Smith and Davis 18 ), employment( Reference Patton-Lopez, Lopez-Cevallos and Cancel-Tirado 19 ) and race( Reference Maroto, Snelling and Linck 13 , Reference Morris, Smith and Davis 18 ) in a small number of studies. Additional analyses are needed to enhance our understanding of these important relationships. The present study aims to address these gaps in the literature by assessing the rates of food insecurity among college students enrolled in a large public university system in one state in the Southeast USA and identifying factors that increase the likelihood of experiencing food insecurity among students.
Methods
Participants and recruitment
Students enrolled at three campuses of a large university system in one state in the Southeast USA were recruited to participate in the study via a series of three emails. The emails were sent to all enrolled students (total n 38 614)( 25 ) through campus-wide systems at each school over three weeks in September–October 2017. The first email explained the online survey and invited students to participate via the web link, which was unique to each campus. The following two emails, sent one and two weeks after the first email, reminded students to take the survey and contained the web link( Reference Lin, Peters and Ford 24 ). The survey remained open for data collection for a total of four weeks( Reference Trespalacios and Perkins 26 ). Participation was incentivized by offering respondents an optional opportunity to take part in a draw for one of eight $US 100 gift cards by entering their email in a separate form that was not linked to the survey. Participants who completed the survey who were not college students (n 5), did not complete the AFSSM (n 695) and were below the age of 18 years (n 51) were excluded from analysis, resulting in a final sample of 4842. Since the AFSSM asks about food insecurity experiences in the last 12 months, freshmen were not eligible as their past 12 months were likely not spent in the college environment. Informed consent was provided on the first screen of the survey.
Survey development
The online survey was developed in partnership with a consortium of researchers from universities across the Southeast USA to assess food insecurity status among college students (http://www.hunger-research.sog.unc.edu/content/about). The survey collected information on food security status, academic standing/success, health status, and demographic and socio-economic indicators. Prior to implementation, pilot testing of the survey was completed with a sample of thirty-six students from two colleges in the Southeast region who were similar to the target population due to their geographic location in the Southeast and college enrolment. Students were asked to complete the survey via the web link and discuss the questions as a group with an emphasis on readability and relevance of the questions to a college population, as well as acceptability of survey delivery method. Feedback from nutrition and public health experts was sought to assess content validity in the adaptation of selected questions( Reference Hager, Quigg and Black 27 ). Survey questions were modified based upon their feedback prior to the start of data collection.
Food security
Food security status was assessed using the AFSSM, a ten-item questionnaire from the USDA that is considered the gold standard for assessing food security status among adults( 28 ). This questionnaire focuses on experiences within the last 12 months with questions about anxiety related to food supply, experience of running out of food or money to buy food, inadequate food intake due to lack in either quantity or quality, and experiencing hunger or weight loss due to reduced food intake. The responses were coded based on established protocols( 28 ). Scored responses were summed on a scale of 0–10, delineating the food security status category. A score of 0 was classified as high food security, and a score of 1–2 was marginal food security. Classification of food insecure included the low food security category (score of 3–5) and very low food security category (score of 6–10). For the purpose of the present analysis, the food security categories were dichotomized to food secure (high and marginal food security) and food insecure (low and very low food security).
In addition, students were asked about their food security status before coming to college through two questions adapted from a previously validated food security status screener( Reference Hager, Quigg and Black 27 ). The statements were as follows: ‘Before I came to college, we (my parent/guardian and/or I) worried whether our food would run out before we had money to buy more’ and ‘Before I came to college, the food we (my parent/guardian and/or I) bought just didn’t last and we didn’t have money to get more’. Responses were ‘often’, ‘sometimes’ and ‘never’, with an affirmative response to either question indicating food insecurity status before attending college and a response of ‘never’ indicating no previous food insecurity. These adaptations were assessed and reviewed through content and face validation with experts in the field.
Demographics, academic factors and health-related factors
Four questions were used to collect demographic information from the students. The questions included gender, age, race and ethnicity. To collect information related to academic factors, students were asked to report their year in school (‘sophomore’, ‘junior’, ‘senior’, ‘graduate’, ‘other’) and identify as a part- or full-time student. Additionally, students were asked to self-report their GPA on a 4·0 scale. Similar to previous studies, the self-reported GPA variable was categorized using the following ranges to capture academic achievement levels ‘<3·00’, ‘3·00–3·49’, ‘3·50–3·84’ and ‘3·85–4·00’. Students were asked to identify, ‘yes’ or ‘no’, if they participated in an on-campus meal plan.
Socio-economic factors
Students were asked to select any of following terms to best describe their income source: ‘parent/family support’, ‘spouse/partner/significant other support’, ‘scholarship/grant (that you don’t have to pay back)’, ‘private or federal loan (that you do have to pay back)’, ‘one or more part-time jobs’, ‘one full-time job’, ‘personal savings’ and ‘other.’ This variable was dichotomous with either a ‘yes’ or ‘no’ response in each category. For the purpose of analysis, ‘parent/family support’ and ‘spouse/partner/significant other support’ were combined to one variable, ‘familial financial support’. Additionally, students were asked about their monthly expenditures from a set of questions adapted from the literature( Reference Chaparro, Zaghloul and Holck 16 ). This included asking respondents to report their monthly expenditures on housing and cellular phones, groceries, eating out, shopping, transportation and entertainment. In addition, respondents were asked to report how much they spent on large one-time expenditures for the semester, e.g. tuition. Responses included various dollar amount categories, tailored to each expenditure item. For analysis, scores from housing, cell phone, groceries and transportation categories were summed to create an ‘essential expenditures’ category (mean=7·96, sd=3·90, minimum=0, maximum=19, Cronbach’s α=0·68). Scores from eating out, shopping and entertainment were summed to create a ‘non-essential expenditures’ category (mean=4·07, sd=2·44, minimum=0, maximum=15, Cronbach’s α=0·72).
Statistical analyses
Summary statistics were assessed to check for outliers and missing data. Outliers were evaluated to determine if they were errors in responses or true outliers. Responses deemed errors were dropped from the data set, while true outliers were retained, and sensitivity analyses were conducted to determine the impact of the outliers. Descriptive statistics were used to assess characteristics of the sample and food security status levels. Bivariate analyses were completed using χ 2 tests and ANOVA tests to assess associations between the dependent variable of food security status and independent variables (food insecurity before college, familial financial support, part-time job, full-time job, personal savings, loans requiring repayment, participation in a meal plan, scholarships not requiring repayment, year in school, self-reported GPA, essential expenditures and non-essential expenditures). The variables that were significant in the bivariate analyses were included in the multivariate logistic regression model, including academic factors (self-reported GPA and year in school), participation in a meal plan and financial factors (income sources and monthly expenditures). Additionally, similar to the previous literature( Reference Maroto, Snelling and Linck 13 , Reference Chaparro, Zaghloul and Holck 16 , Reference Patton-Lopez, Lopez-Cevallos and Cancel-Tirado 19 , Reference Thomas 23 ), factors controlled for included age, race, ethnicity, gender and campus location. Students who had missing responses for the variables in the multivariable model were excluded from analysis (n 457). The missing responses were visually inspected and appeared to be missing at random( Reference Irony, Li and Silverman 29 ). The Hosmer–Lemeshow test was completed to assess goodness-of-fit; and assumptions of multivariate logistic regression (that the variables are independent, sample size is large and the dependent variable is binary) were checked( Reference Stommel and Stommel 30 ). Data were analysed using the statistical software package IBM SPSS Statistics for Windows version 24.0. Statistical significance for all tests was determined at α ≤ 0·05 level.
Results
Among eligible students (n 38 614), 5593 responded to the survey. After applying the exclusion criteria mentioned above, the final sample size was 4842 (12·5 % response rate). As seen in Table 1, the majority of students were undergraduates (72·0 %) and enrolled full-time (91·0 %). The mean self-reported GPA of students was 3·41 (sd 0·6), with 31·5 % of respondents having a self-reported GPA between 3·50 and 3·84. The mean age of students was 23·6 years (sd 6·7) years. Most students identified as White (81·4 %), not Hispanic or Latino (95·3 %) and were female (70·1 %).
Table 1 Participant demographics and characteristics of college students at a large public university system in the Southeast USA (n 4842) by food security status, 2017
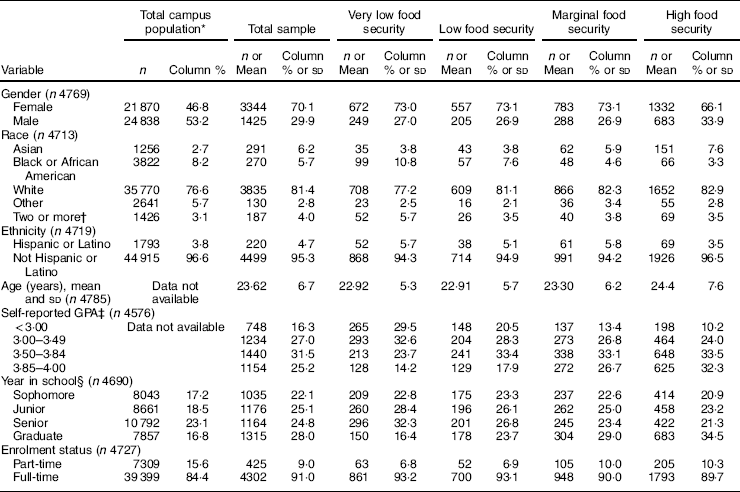
* Data from Fall 2017 enrolment period( 31 – 33 ); certain variables (mean age, self-reported GPA) could not be calculated based on how the data are provided from the universities within this university system.
† Two or more races refers to anyone who may identify with more than one race.
‡ Self-reported GPA is self-reported grade point average.
§ Sophomore, junior and senior are all classifications for undergraduate students based upon completed academic hours. Typically, sophomore standing is the equivalent to the second year of university, junior the third year, and senior the fourth and final year of university.
According to the scores from the AFSSM, 19·5 % of students were classified as very low food secure and 16·1 % as low food secure; taken together, 35·6 % of students were classified as food insecure. A total of 64·4 % of students were classified as food secure with 42·0 % classified as high food secure and 22·4 % as marginal food secure.
Chi-square analyses were used to assess associations of demographic, financial and academic variables with food security status (Table 2). Students who were food insecure before college (P<0·001), did not receive familial financial support (P<0·001), had part-time or full-time jobs (P<0·001), relied on personal savings (P=0·001), received loans requiring repayment (P<0·001), participated in a meal plan (P=0·001), received scholarships not requiring repayment (P=0·021), were undergraduates (P<0·001), had decreased non-essential expenditures (P<0·001) and had increased essential expenditures (P<0·001) were significantly more likely to be classified as food insecure.
Table 2 Bivariate analyses of food security status with demographic, financial and academic factors* among college students at a large public university system in the Southeast USA (n 4842), 2017
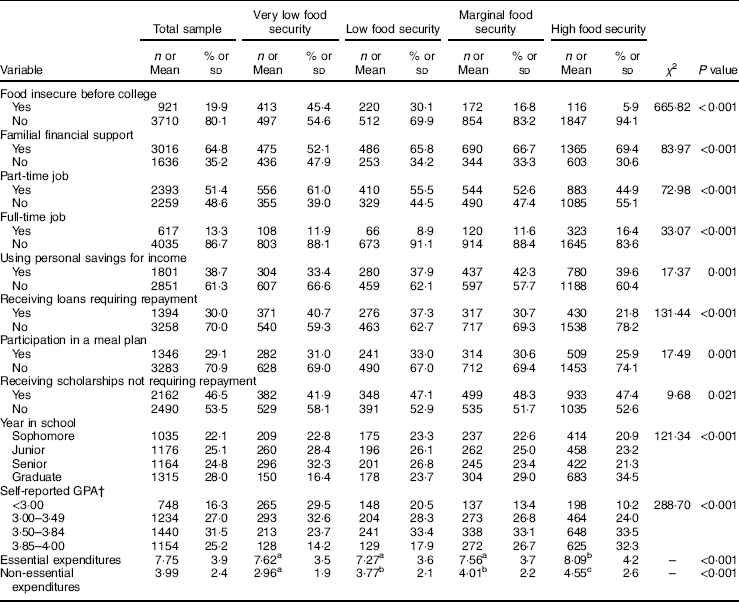
Essential expenditures include monthly expenditures on housing, groceries, transportation and cell phones; non-essential expenditures include monthly expenditures on shopping, entertainment and eating out.
a,b,cMean values within a row with unlike superscript letters were significantly different (Tukey post hoc test): P<0·01.
* Values are n and % for χ 2 analyses or means and sd for ANOVA (essential expenditures; non-essential expenditures).
† Self-reported GPA is self-reported grade point average.
Many of the variables included in the multivariate logistic regression were statistically significant (Table 3). The Hosmer–Lemeshow test indicated the model was a good fit (χ 2=4·70, P=0·789). While controlling for race, age, gender, ethnicity and holding all other variables in the model constant, previous food security status was the strongest correlate of food insecurity (OR=4·78; 95 % CI 4·00, 5·71), indicating that students with previous food insecurity were 4·78 times more likely to be food insecure than the students who did not experience food insecurity before college. Those who received a loan that had to be repaid were 1·42 times more likely to be food insecure compared with those who did not receive loans that had to be repaid (95 % CI 1·22, 1·66). Similarly, those who had not received familial financial support were 1·56 times more likely to be food insecure than those who had received familial financial support (95 % CI 1·33, 1·84). Students who had part-time jobs were 1·28 times more likely to be food insecure compared with those who did not have part time jobs (95 % CI 1·10, 1·50), while those without full-time jobs were 1·30 times more likely to be food insecure compared with those who had full-time jobs (95 % CI 1·00, 1·69). Additionally, students who used personal savings as an income source had an increased likelihood of food insecurity compared with those who did not (OR=1·21; 95 % CI 1·04, 1·40).
Table 3 Multivariate logistic regression of factors associated with food insecurity among college students at a large public university system in the Southeast USA, 2017
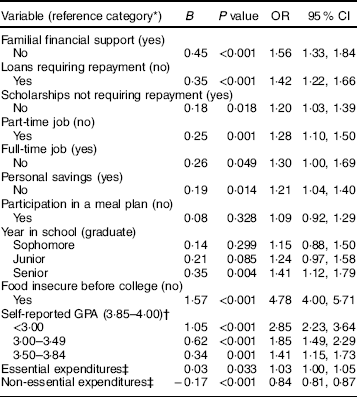
Total sample=4385, participants with missing data were dropped from the analysis.
Adjusted for campus attended, gender, race, ethnicity and age. α, P≤0·05.
* Reference category included for categorical variables.
† Self-reported GPA is self-reported grade point average.
‡ Essential includes monthly expenditures on housing, groceries, transportation and cell phones; non-essential includes monthly expenditures on shopping, entertainment and eating out.
Related to student spending, the present analysis found that as essential expenditures increased, the likelihood of being food insecure also increased (OR=1·03; CI 1·00, 1·05). Conversely, the likelihood of being food insecure decreased as non-essential expenditures increased (OR=0·84; CI 0·81, 0·87).
Students who were seniors were 1·41 times more likely to be food insecure than the reference group, graduate students (95 % CI 1·12, 1·79); however, there were no significant differences in odds of being food insecure between the reference group, graduate students, and other grade levels included in the analysis (juniors, sophomores). When compared with students with a self-reported GPA of 3·85–4·00, students with a self-reported GPA<3·00 were 2·85 times more likely to be food insecure (95 % CI 2·23, 3·64), followed by those with a self-reported GPA of 3·00–3·49 (OR=1·85; 95 % CI 1·49, 2·29) and those with a self-reported GPA of 3·50–3·84 (OR=1·41; CI 95 % 1·15, 1·73). No significant associations were found between students who participated in a campus meal plan v. those who did not.
Discussion
Among the college students in the present sample, 35·6 % reported being food insecure, which was more than double the average rate (13·4 %) of the general population in the same state( Reference Coleman-Jensen, Rabbitt and Matthew 1 ) and similar to other studies( Reference Maroto, Snelling and Linck 13 , Reference Bruening, Brennhofer and van Woerden 14 , Reference Chaparro, Zaghloul and Holck 16 – Reference Payne-Sturges, Tjaden and Caldeira 21 ). Contrary to one study in a state in the Southeast region where the food insecurity rates among college students were lower than the state average( Reference Gaines, Robb and Knol 12 ), the present study found a food insecurity rate much higher than the regional average, which was similar to another study in the Southeast region( Reference McArthur, Ball and Danek 20 ).
Results from the multivariate regression analyses indicated that students who were food insecure before entering college were nearly five times more likely to be food insecure in college when controlling for all other variables. This is the strongest factor that was identified in our analyses and is highly novel, as we are not aware of other studies that have examined previous food insecurity. These findings indicate that some of the high rates of food insecurity among college students could persist from food insecurity among students prior to college entry. Given that this may be first time that previous food insecurity has been explored in this population, additional research is needed to confirm these findings. Students with a lower self-reported GPA (<3·85) were significantly more likely to be food insecure than students in the highest self-reported GPA range (3·85–4·00), which is consistent with the literature( Reference Morris, Smith and Davis 18 , Reference Patton-Lopez, Lopez-Cevallos and Cancel-Tirado 19 ).
Results from the multivariate analyses showed that undergraduate seniors were significantly more likely to be food insecure compared with graduate students. This relationship was not statistically significant, however, when comparing undergraduate sophomores or juniors with the reference group of graduate students. These findings identified a similar relationship to other studies with undergraduate students at increased risk for food insecurity compared with graduate students( Reference Mirabitur, Peterson and Rathz 17 , Reference McArthur, Ball and Danek 20 ).
Similar to another study( Reference Payne-Sturges, Tjaden and Caldeira 21 ), students in the present study had a decreased likelihood of food insecurity when they received familial financial support, indicating a potential relationship between independence from familial financial support and food insecurity. Students in our sample who received loans that required repayment were more likely to be classified as food insecure, which supports similar findings in another study( Reference Morris, Smith and Davis 18 ). Conversely, students who received scholarships that did not require repayment were more likely to be food secure. Additionally, students who were employed part-time were significantly more likely to be food insecure than students who were not employed part-time. Students with full-time employment were less likely to be food insecure than students who were not employed full-time. Contrary to one study( Reference Chaparro, Zaghloul and Holck 16 ), as students in our study increased spending on non-essential items (including eating out, shopping and entertainment), they had a significantly lower probability of food insecurity. This may mean that students who were food secure had more disposable income that allowed them to make such expenditures, as they may have had support from parents or guardians to pay for all their essential needs. However, since this is inconsistent with previous studies, the relationship between spending habits and food insecurity status should continue to be studied. As students increased spending on essential items (including housing, large expenses, transportation, cell phones and groceries), they had a small but statistically significant increase in the likelihood of food insecurity.
Strengths and limitations
A strength of the present study is its novelty; it is the first study that the authors are aware of to assess previous food insecurity prior to coming to college. Additionally, this research fills an important gap in identifying food insecurity prevalence among college students in the Southeast USA as the results of other studies are inconsistent( Reference Gaines, Robb and Knol 12 , Reference McArthur, Ball and Danek 20 ). Within the survey, the use of the AFSSM contributes to the strength of the research, as the AFSSM is considered the gold standard for measuring food security status among adults( 28 ).
One limitation of the study was the cross-sectional design, inhibiting causal inferences to be deduced from the findings. Additional research is needed, particularly including intervention trials, to address food insecurity among college students. Since the study used a self-reported survey technique to collect data, recall and social desirability biases could be present in the results. This limitation is consistent with limitations in published research assessing food insecurity among college students( Reference Gaines, Robb and Knol 12 – Reference Bruening, Brennhofer and van Woerden 14 , Reference Chaparro, Zaghloul and Holck 16 – Reference Patton-Lopez, Lopez-Cevallos and Cancel-Tirado 19 , Reference Thomas 23 ). The response rate of our study is 12·5 %, which is a relatively small percentage of the overall university system population; however, this response rate is much higher than other similar studies that had response rates of 3·8–7·0 %( Reference Mirabitur, Peterson and Rathz 17 – Reference Patton-Lopez, Lopez-Cevallos and Cancel-Tirado 19 ). Additionally, the sample was non-random and may not be representative of the university system overall, resulting in selection bias. For example, there was a high percentage of female respondents (70·1 %) among the sample population, which is more than the percentage of the overall university system (46·8 %). When completing regression analyses, 9 % of the final sample was dropped due to missing responses; while this is a high percentage and an important limitation of the study, the overall sample size was still appropriate for these analyses. Lastly, the results may be biased as students with financial strains may have been more likely to participate in the survey in hope of winning the drawing for one of the $US 100 gift cards.
Conclusions
Overall, the students across this large public university system in the Southeast USA had high rates of food insecurity (35·6 %). These findings support similar findings at other universities, with an average food insecurity rate of 42 % among college students( Reference Bruening, Argo and Payne-Sturges 22 ). Future research is needed to further explore the relationship between food security status during college and previous food insecurity to determine what factors in the college setting may be exacerbating pre-existing food insecurity. As this relationship has been newly discovered, it may be beneficial to screen for food security status during the financial aid review process to identify students who may need additional support or resources to successfully complete their studies. Additionally, future research is needed to define the multiple dimensions of socio-economic effects on food security status, particularly among the college students who may have varying sources of support that can be difficult to measure. As predictors associated with food insecurity are being established, future studies should explore interventions, programming and policies that can influence those factors to help reduce food insecurity rates.
Acknowledgements
Acknowledgements: This research was conducted in partnership with the Southeastern Universities Consortium on Hunger Poverty and Nutrition. The authors would like to acknowledge Deidre White, John Abel, Phil Showalter and Sally Badoud for their support of this project and their assistance in the dissemination of the survey at the corresponding campuses. They would also like to thank the student participants who were willing to share their information as part of this survey. Financial support: This research received no specific grant from any funding agency in the public, commercial or not-for-profit sectors. Conflict of interest: None. Authorship: R.W. was responsible for the designing and implementing the study; collecting, managing and analysing the data; and drafting the manuscript. M.S. was responsible for providing significant input on study design and survey content development; and was actively engaged in manuscript drafting and review and dissemination of results to relevant stakeholders. S.C. provided significant input on study design and survey content; and gave significant feedback on manuscript drafts. E.A.S. provided direct oversight of and input on the study and survey design; oversaw data collection, cleaning and analysis; aided in the manuscript development, drafting and revision process; and also serves as the corresponding author for this manuscript. Ethics of human subject participation: This study was conducted according to the guidelines laid down in the Declaration of Helsinki and all procedures involving human subjects were approved by the University of Tennessee, Knoxville Institutional Review Board. Written informed consent was obtained from all subjects.


