Electrolytic disturbances are the most fundamental and foremost pathogenic sign of most diseases, and are common in both the general population and hospitalized patients. A number of recent studies suggest that electrolyte disorders are directly related to adverse outcomes of increased morbidity and mortality( Reference Sajadieh, Binici and Mouridsen 1 – Reference Mohan, Gu and Parikh 3 ). In the general population, electrolyte disturbances are chronic and mild compared with those in hospitalized patients who often have acute and severe cases. Nevertheless, electrolytic disturbances are associated with poor health and outcomes. Therefore, it is important to know whether electrolytic disturbances are associated with the risk factors leading up to certain chronic diseases which eventually can become life-threatening. And in knowing this, to mitigate these risk factors through control of serum electrolyte levels to possibly prevent or delay the development of, or to ameliorate, these diseases and their complications.
Hypertension is a highly prevalent and modifiable risk factor for a variety of chronic and potentially life-threatening diseases, such as CVD and renal failure. Yet, it has relatively low awareness rate due to mild non-specific symptoms and is poorly controlled due to low treatment compliance. Hypertension is a complex syndrome influenced by multiple genetic and environmental factors. A number of epidemiological studies have suggested that there is a significant relationship between electrolyte levels and blood pressure( Reference Kim and Choi 4 , Reference Gijsbers, Dower and Mensink 5 ), as well as between salt intake and blood pressure( Reference He, Marciniak and Visagie 6 – Reference Shi, Krupp and Remer 8 ). However, the association of serum electrolyte levels with increased blood pressure is unclear in populations with high salt intake. Hence, our objective was to evaluate the frequency of hypertension in electrolyte disturbances and to determine which electrolytes were associated with hypertension in a general Chinese population with high salt intake. We examined six commonly tested electrolytes, namely serum sodium, potassium, chloride, total calcium, phosphate and magnesium, and their association with incidental hypertension (IH) and previously diagnosed hypertension (PDH).
Methods
Study population
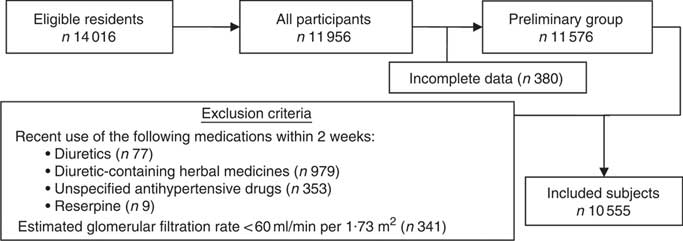
A representative sample of rural residents was selected from Liaoning Province, China between January 2012 and August 2013 as part of the Northeast China Rural Cardiovascular Health Study (NCRCHS). This population has been documented to have high daily salt intake (mean 9·7 g/d) and more than half of the population (51·1 %) is hypertensive( Reference Li, Guo and Zheng 9 ). The random sampling method used has been described previously( Reference Li, Guo and Zheng 9 ). All permanent residents aged ≥35 years were eligible to participate, excluding residents with pregnancy, malignant tumour or mental disorder. A participation rate of 85·3 % (11 956/14016) was achieved. In the present study, the exclusion criteria were: recent use (two weeks before study inception) of diuretics (n 77), recent use of diuretic-containing herbal medicines (n 979), recent use of antipsychotics (n 9), recent use of unspecified antihypertensive drugs (n 353) and estimated glomerular filtration rate (eGFR) <60 ml/min per 1·73 m2 (n 341)( 10 ).
The present epidemiological study was approved by the Ethics Committee of China Medical University (Shenyang, China). All procedures were performed in accordance with the ethical standards. Written informed consent and confidentiality agreement was obtained from all participants.
Data collection
Information on personal and family medical history, dietary habits, smoking, alcohol consumption and recent medications were self-reported and obtained using a questionnaire during an in-person interview with cardiologists and/or trained nurses. Height and weight were measured with all participants shoeless and in lightweight clothing to the nearest 0·5 cm and 0·1 kg, respectively. BMI was calculated as weight (in kilograms) divided by the square of height (in metres).
Estimation of daily salt intake
Daily salt intake was estimated by averaging the annual amount of salt consumption in one household by the number of household members. Specifically, the questionnaire queried the amount of cooking salt added to meals and the amount of salted or preserved foods consumed. Then the estimated total salt consumption by the family per year was divided by the number of family members to estimate the individual participant’s salt intake. Although 24 h urine sodium is a more accurate estimation of salt intake, urine samples were not collected as part of the NCRCHS.
Classification of hypertension status
Blood pressure was measured three times in the same arm at 2 min intervals after at least 5 min of quiet sitting using a calibrated automatic electronic sphygmomanometer (HEM-907; Omron, Tokyo, Japan). The participants were advised to avoid caffeinated beverages and exercise for at least 30 min prior. Measurements were taken by cardiologists or trained nurses while the participants were seated with the arm supported at the level of the heart. The mean of the three blood pressure measurements was calculated and used in the analysis.
Participants were stratified by hypertension status into three groups: (i) non-hypertensive, defined as having systolic blood pressure (SBP) <140 mmHg, diastolic blood pressure (DBP)<90 mmHg, no history of hypertension and no history of any antihypertensive treatment; (ii) incident hypertension (IH), defined as having no history of hypertension and no history of antihypertension medication, but being found to have a mean SBP≥140 mmHg and/or a mean DBP≥90 mmHg; and (iii) previously diagnosed hypertension (PDH), defined as having a history of hypertension and/or a history of taking antihypertensive drugs. The IH group is minimally confounded by the effects of antihypertension medication and recall bias from the questionnaire in cases that participants could not accurately recall whether or not they took antihypertension medication.
Blood collection and biochemical tests
Fasting blood samples were collected from all participants in the morning after at least 12 h fasting. Blood samples were obtained from the antecubital vein into vacutainers and centrifuged. All samples were frozen at −20°C until analysis at a central certified laboratory.
Serum electrolytes, fasting plasma glucose, lipid profile (i.e. TAG, total cholesterol, LDL-cholesterol and HDL-cholesterol), serum creatinine and uric acid were analysed using an Olympus AU640 autoanalyzer (Olympus, Kobe, Japan). Assay references for serum electrolytes were as follows: sodium 137·0–147·0 mmol/l; potassium 3·50–5·30 mmol/l; chloride 99·0–110·0 mmol/l; total calcium 2·17–2·57 mmol/l; phosphate 0·81–1·52 mmol/l; magnesium 0·78–1·28 mmol/l. Electrolyte disturbances were based on Chinese textbook clinical references( 11 ): sodium 135–145 mmol/l; potassium 3·5–5·5 mmol/l; chloride 95–105 mmol/l; total calcium 2·25–2·58 mmol/l; phosphate 0·97–1·61 mmol/l; magnesium 0·8–1·2 mmol/l.
For fasting plasma glucose, the intra- and inter-assay CV were 0·62 and 1·44 %, respectively.
Dyslipidaemia was defined according to the National Cholesterol Education Program Adult Treatment Panel III criteria( 12 ). Hypercholesterolaemia was defined as serum total cholesterol greater than 6·21 mmol/l (240 mg/dl). Hypo-HDL-cholesterolaemia was defined as serum HDL-cholesterol lower than 1·03 mmol/l (40 mg/dl). Hyper-LDL-cholesterolaemia was defined as serum LDL-cholesterol higher than 4·16 mmol/l (160 mg/dl). Hypertriacylglycerolaemia was defined as serum TAG greater than 2·26 mmol/l (200 mg/dl).
The eGFR was estimated using the CKD Epidemiology Collaboration (CKD-EPI) equation( 10 ): eGFR=141×min(SCr/κ, 1) α ×max(SCr/κ, 1)−1·209×0·993Age×1·018 (if female)×1·159 (if black), where SCr is serum creatinine (mg/dl), κ is 0·7 for females and 0·9 for males, α is −0·329 for females and −0·411 for males.
Statistical analysis
Continuous variables were expressed as mean values and sd, while categorical variables were described as frequencies or percentages. Comparisons between variables were analysed by Student’s t test, the χ 2 test or one-way ANOVA as appropriate. Post hoc analysis was carried out with Fisher’s least-significant difference test. Pearson correlations and regression analysis were used to examine the relationship between serum electrolyte levels and other covariates such as blood pressure. Correlation analysis between all electrolytes is shown in the online supplementary material, Supplemental Table 1.
Logistic regression analysis was used to generate OR and 95 % CI of studied variables for hypertension (IH or PDH). Model 1 was adjusted for age (categorical: 35–44, 45–54, 55–64, ≥65 years of age), gender and BMI. Model 2 included factors in model 1 and fasting plasma glucose, TAG, total cholesterol, LDL-cholesterol, HDL-cholesterol, current smoking, current drinking, diabetes mellitus, stroke, CHD, eGFR, daily salt intake and the other five electrolyte levels. The significance of linear trends across serum electrolyte groups was tested by assigning the median value for the group to each participant and considering this value as a continuous variable.
Generalized linear regression was performed to evaluate the relationship between serum electrolyte levels and blood pressure in two groups of participants based on whether or not they had a history of antihypertension medication and to compare the β coefficients of each serum electrolyte between these two groups. Other adjusted factors in the model included the other five serum electrolytes, the other four antihypertension medications, age, gender, BMI, eGFR, serum uric acid, glucose, glycated Hb, TAG, LDL-cholesterol, HDL-cholesterol and total cholesterol.
P<0·05 was considered statistically significant. All statistical analyses were performed using the statistical software package IBM SPSS Statistics for Windows version 22·0.
Results
Characteristics of study participants
A total of 10 555 participants (5000 males, 5555 females) met the inclusion criteria (Fig. 1) and their baseline characteristics are shown in Table 1. In this study population, overall frequency of hypertension was 47 %, of whom 66·5 % were unaware of being hypertensive. Hypertension was more prevalent in male participants (52 v. 48 %; P<0·05), however, they were less clinically aware than female participants (29 v. 62 %; P<0·05). There were 3287 in the IH group and 1655 in the PDH group. The mean age of hypertensive participants was significantly higher than that of the non-hypertensive (P<0·001), and the mean age in the PDH group was significantly higher than in the IH group (57·6 v. 56·1 years; P<0·001). Interestingly, salt intake was not significantly different between the three groups (P=0·91).

Fig. 1 Diagram showing selection of the study population
Table 1 Characteristics of the study participants according to hypertension status: rural adult residents (n 10 555) with high salt intake, Liaoning Province, China, 2012–2013 (Northeast China Rural Cardiovascular Health Study)

SBP, systolic blood pressure; DBP, diastolic blood pressure; eGFR, estimated glomerular filtration rate based on the CKD-EPI equation.
P values are from Student’s t test for characteristics reported as means and 95 % CI, or from the χ 2 test for those reported as percentages.
*P<0·05 compared with non-hypertensive group.
**P<0·001 compared with non-hypertensive group.
In the study population, 56·4 % of participants had at least one form of electrolyte disturbance. The most prevalent electrolytic disturbances, in descending order, were hypocalcaemia (26·7 %), hypophosphataemia (20·4 %), hypomagnesaemia (13·6 %) and hyperchloraemia (10·9 %). Other less common electrolyte disturbances include hypernatraemia (2·2 %) and hypercalcaemia (1·3 %). Ninety participants had hypokalaemia, thirty-nine participants had hyperphosphataemia, thirteen had hyponatraemia, ten had hyperkalaemia, seven had hypermagnesaemia and six had hypochloraemia.
In the total cohort (or PDH group only), 301 participants were on calcium channel blocker, 267 participants were on angiotensin-converting enzyme inhibitor/angiotensin II receptor blocker medication, thirty-four were on beta-blocker, ninety-eight had previously taken herbal medicine, sixty-two were unable to recall their antihypertension medication, and none were on diuretics.
Comparison of serum electrolyte levels between hypertension groups
Five out of six serum electrolyte levels were significantly different between hypertensive and non-hypertensive groups. Notably, serum total calcium was consistently higher in both hypertensive groups than in the non-hypertensive group (P<0·001) and was significantly higher in IH than PDH (P<0·001). Although serum sodium was significantly higher in both hypertensive groups (P<0·05), there was no difference between IH and PDH (P=0·71). Two electrolytes – chloride and phosphate -- displayed inconsistent relationship between hypertensive and non-hypertensive groups. When compared with non-hypertensive, serum chloride was higher in IH (103 v. 102 mmol/l; P<0·001) but was lower in PDH (102·1 v. 102·3 mmol/l; P<0·05). Conversely, serum phosphate was significantly higher in PDH but was significantly lower in IH compared with the non-hypertensive group (P<0·05). Both serum potassium and magnesium were significantly lower only in PDH when compared with other groups (P<0·05).
Frequency of hypertension in electrolyte disturbance groups
Electrolyte disturbances were categorized based on clinically hyper/hypo levels of serum electrolytes. For each electrolyte disturbance group, approximately 50 % of participants were hypertensive. Specifically, 62·3 % of hypercalcaemic participants were hypertensive, 55·6 % in hypokalaemia, 53·9 % in hypernatraemia, 49·3 % in hyperchloraemia, 47·2 % in hypomagnesaemia, 47·0 % in hypophosphataemia and 39·4 % in hypocalcaemia. For less common electrolyte imbalances, the frequency of hypertension was 25/39 in hyperphosphataemia, 8/10 in hyperkalaemia, 4/13 in hyponatraemia, 4/7 in hypermagnesaemia and 4/6 in hypochloraemia. On comparing between hypertensive groups, there was more IH than PDH within each electrolytic disturbance group. Remarkably, 62 % (86/138) of hypercalcaemic participants were hypertensive, of whom fifty-six were IH.
Odds of hypertension in electrolyte disturbances
To evaluate the odds of hypertension in each electrolyte disturbance, logistic regression analysis was performed (Table 2). Noticeably, hypercalcaemia was significantly associated with higher odds of both IH (OR=1·70; P<0·01) and PDH (OR=2·25; P<0·001), and hypocalcaemia was associated with lower odds of both IH (OR=0·68; P<0·001) and PDH (OR=0·85; P=0·02). Among the other electrolyte disturbances, only one had a significant association with higher odds of PDH: hypokalaemia (OR=1·82; P=0·04). Disturbances in serum magnesium were not significantly associated with hypertension.
Table 2 Multiple linear regression analyses for the associations between hypertension status and studied variables among rural adult residents (n 10 555) with high salt intake, Liaoning Province, China, 2012–2013 (Northeast China Rural Cardiovascular Health Study)
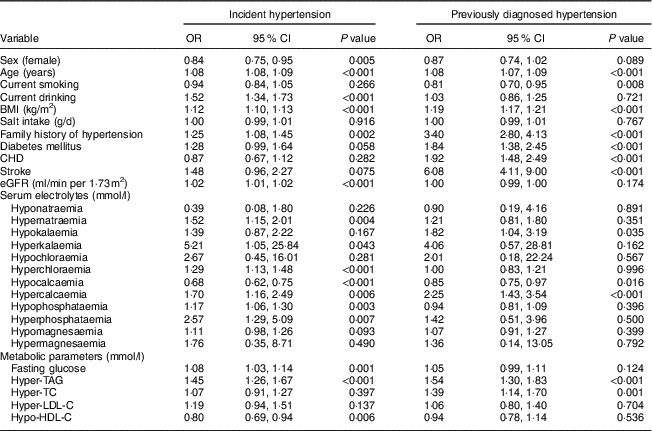
eGFR, estimated glomerular filtration rate; TC, total cholesterol; LDL-C, LDL-cholesterol; HDL-C, HDL-cholesterol.
Relationship between blood pressure and electrolytes
The mean SBP and DBP with 95 % CI for each stratified serum electrolyte group are shown in Fig. 2.

Fig. 2 Mean systolic blood pressure (■) and diastolic blood pressure (●) across serum electrolyte groups, with their 95 % CI represented by vertical bars, in rural adult residents (n 10 555) with high salt intake, Liaoning Province, China, 2012–2013 (Northeast China Rural Cardiovascular Health Study)
Linear regression analysis adjusted for confounding factors showed serum sodium, total calcium and phosphate were related to both SBP and DBP (Table 3). In addition, serum potassium was related only to DBP and serum magnesium was related only to SBP.
Table 3 Multiple linear regression models for blood pressure measurements for the entire cohort of rural adult residents (n 10 555) with high salt intake, Liaoning Province, China, 2012–2013 (Northeast China Rural Cardiovascular Health Study)

Results of generalized linear regressions modified for the effect of antihypertension medication on DBP and SBP are shown in the online supplementary material, Supplemental Table 2 and Supplemental Table 3, respectively. Participants who took an angiotensin-converting enzyme inhibitor or an angiotensin II receptor blocker had a stronger negative relationship between serum potassium levels and both DBP (P=0·001) and SBP (P<0·001) than participants who did not take these medications. Participants who took herbal medication (which may contain diuretics or other drugs) at least two weeks prior to the study had a negative relationship between serum sodium and both DBP and SBP. Herbal medication also had a stronger negative relationship between serum chloride and SBP. Participants who took a calcium channel blocker had a reversed and positive relationship between serum magnesium and SBP compared with those who did not. The effect of beta-blockers (n 34) on the regression of serum electrolytes v. blood pressure was not analysed due to low numbers.
Frequency of hypertension across stratified electrolyte groups
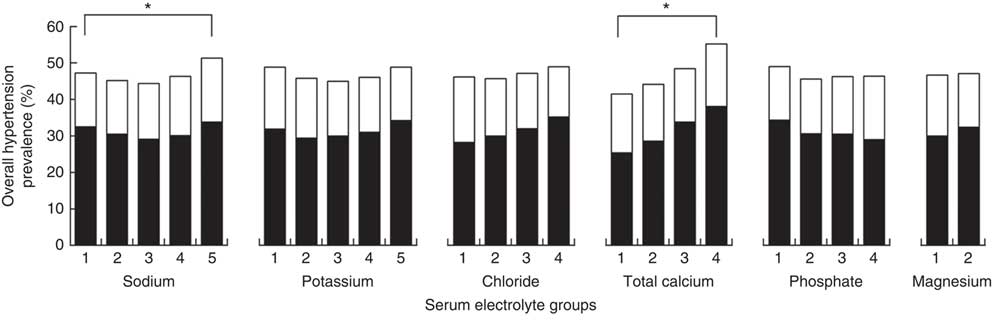
The frequency of hypertension stratified by IH and PDH is shown in Fig. 3. After stratification based on frequency, only sodium and total calcium had significant differences in hypertension frequency between stratified groups (both P<0·001). Participants in the highest calcium quartile had significantly higher frequency of hypertension (55 %) than all other quartiles. In the highest quintile of sodium, frequency of hypertension (51 %) was higher than all other quintiles.

Fig. 3 Frequency of incident hypertension (![]() ) and previously diagnosed hypertension (
) and previously diagnosed hypertension (![]() ) across serum electrolyte group in rural adult residents (n 10 555) with high salt intake, Liaoning Province, China, 2012–2013 (Northeast China Rural Cardiovascular Health Study). *P<0·05
) across serum electrolyte group in rural adult residents (n 10 555) with high salt intake, Liaoning Province, China, 2012–2013 (Northeast China Rural Cardiovascular Health Study). *P<0·05
Odds of hypertension across stratified electrolyte groups
Higher serum total calcium was associated with higher odds of IH (P trend=0·001) and PDH (P trend 0·001) across the quartiles after adjusting for factors in model 2 (Table 4). Participants in the highest quartile of serum calcium had 58 % higher odds of developing IH (OR=1·58) and 64 % higher odds of PDH (OR=1·64) than those in the lowest quartile.
Table 4 Odds ratios of hypertension by baseline serum electrolyte levels among rural adult residents (n 10 555) with high salt intake, Liaoning Province, China, 2012–2013 (Northeast China Rural Cardiovascular Health Study)

Model 1 was adjusted for age (categorical: 35–44, 45–54, 55–64, ≥65 years of age), gender and BMI.
Model 2 was adjusted for factors in model 1 and fasting plasma glucose, lipid profile, smoking, drinking, diabetes mellitus, stroke, CHD, estimated glomerular filtration rate, daily salt intake and other electrolytes.
Higher serum phosphate levels had increasingly lower odds of IH (P trend<0·001), the highest quartile of serum phosphate had 25 % lower odds than the lowest quartile (OR=0·75). Serum phosphate had no significant association with PDH across the quartiles in either model.
There were significantly lower odds of IH (OR=0·86; P=0·006) and PDH (OR=0·77; P<0·001) in the higher serum magnesium group.
There were no significant associations in both IH and PDH odds across the quintiles of serum sodium.
Although there was a significant linear trend in the odds of hypertension across serum potassium quintiles, a U-shaped trend was more evident. Odds of IH were the lowest in the third quintile at 28 % lower than the first quintile, and the odds of PDH were lowest in the fourth quintile at 28 % lower than the first quintile.
Higher serum chloride was associated with lower odds of PDH across the quartiles after adjusting for all covariates (P trend=0·001). Participants in the highest quartile of serum chloride had 36 % lower odds of PDH than those in the lowest quartile (OR=0·65).
Discussion
The present study is the first to examine the association of six common electrolytes with both IH and PDH in a large Chinese cohort from a region with high salt intake. In the studied region, the general population has an average daily salt intake of 9·7 g/d and more than half of the population (51 %) is hypertensive( Reference Li, Guo and Zheng 9 ). In the present study, we found several significant associations between serum electrolytes and hypertension.
First, we found that serum total calcium levels were positively associated with both IH and PDH, and that hypocalcaemia and hypercalcaemia were associated with lower and higher odds of hypertension, respectively. Calcium imbalances were the only electrolytic factors consistently associated with odds of hypertension in our study cohort. Although serum phosphate was also found to be linearly associated with IH, this relationship was inversed. This may be a reflection of the calcium phosphate product. Previous studies that examined the association between serum calcium and hypertension have shown mixed results. Studies that reported a positive association between serum calcium and blood pressure or hypertension( Reference Yao, He and Jin 13 – Reference Rinner, Spliet-van Laar and Kromhout 18 ) excluded females or persons with cardiac disease, stroke or diabetes, while those that reported an inverse or no association were performed in selected cohorts, such as diabetic( Reference Behradmanesh and Nasri 19 ), pregnant( Reference Ephraim, Osakunor and Denkyira 20 – Reference Mohieldein, Dokem and Osman 22 ) or small cohorts( Reference Yao, He and Jin 13 , Reference Takale, More and Sontakke 23 – Reference Strazzullo, Nunziata and Cirillo 25 ). Our study included patients who were otherwise excluded in previous studies (previous medical history of hypertension, CVD, CHD, stroke and diabetes mellitus) and had findings that are consistent with several large studies: the National Health and Nutrition Examination (NHANES) III (3437 hypertensives, 8968 normotensives)( Reference Sabanayagam and Shankar 14 ), the Tromsø study (12 865 men, 14 293 women)( Reference Jorde, Sundsfjord and Fitzgerald 15 ), a Belgian study (4167 men, 3891 women)( Reference Kesteloot and Joossens 16 ), a British study (7735 men)( Reference Phillips and Shaper 17 ), and others( Reference Fields, Burt and Cutler 26 , Reference Staessen, Sartor and Roels 27 ). This suggests that serum total calcium might be a risk factor for hypertension. In contrast to serum total calcium, serum ionized calcium has been shown to be inversely associated with blood pressure or hypertension in several studies( Reference Indumati, Kodliwadmath and Sheela 28 – Reference Kunutsor and Laukkanen 32 ); however, ionized calcium was not measured in the present study. Calcium’s effect on blood pressure is most prominent in its influence on muscle contraction and vascular resistance( Reference Weber 33 , Reference Level, Lasseur and Delmas 34 ). The relationship between overt hypercalcaemia and hypertension may manifest with low serum ionized calcium, elevated parathyroid hormone levels or an increase in renal calcium excretion, which reveals other underlying aetiologies related to parathyroid hormone metabolism( Reference Yagi, Aihara and Kondo 35 , Reference Cappuccio, Kalaitzidis and Duneclift 36 ). In contrast, studies have shown that low calcium intake is related to higher blood pressure in the general population( Reference Wang, Manson and Buring 37 – Reference da Silva Ferreira, Torres and Sanjuliani 39 ), including pregnant women( Reference Imdad, Jabeen and Bhutta 40 ), and that calcium supplementation lowers blood pressure. On the other hand, some studies have also shown that high calcium intake is a risk for cardiovascular mortality( Reference Wang, Chen and Ouyang 41 , Reference Chung, Tang and Fu 42 ). This U-shaped relationship between calcium intake and hypertension( Reference Wang, Chen and Ouyang 41 , Reference Richardson and Baird 43 ) suggests that a reduction in calcium intake may exacerbate the calcium-related aetiologies for hypertension. Therefore, an adequate calcium intake may have protective effects on blood pressure regulation.
Furthermore, we found that participants with higher serum magnesium levels had lower odds of both IH and PDH. However, several studies on serum magnesium showed no association with blood pressure or hypertension( Reference Rinner, Spliet-van Laar and Kromhout 18 , Reference Afsar and Elsurer 44 , Reference Joosten, Gansevoort and Mukamal 45 ). In contrast, studies on urinary magnesium such as the PREVEND( Reference Joosten, Gansevoort and Mukamal 45 ) and the CARDIAC study( Reference Yamori, Sagara and Mizushima 46 ) have shown an inverse association with risk of hypertension, and this relationship remained after adjustment for confounding factors. Moreover, the protective effect of magnesium intake against hypertension may be more apparent in hypomagnesaemic persons( Reference Guerrero-Romero and Rodríguez-Morán 47 ). In a meta-analysis, magnesium supplementation decreased SBP by 3–4 mmHg and DBP by 2–3 mmHg; however, the included studies did not specify the baseline serum magnesium levels( Reference Kass, Weekes and Carpenter 48 ). Similar to phosphate, the pathophysiological mechanism of magnesium mainly includes calcium–magnesium antagonism.
Another finding is the association of hypochloraemia and lower quartiles of serum chloride with higher odds of PDH. Our findings are supported by the NHANES study, which found that lower serum chloride, corresponding to higher anion gap, is associated with higher blood pressure in a normotensive cohort( Reference Taylor, Forman and Farwell 49 ). Furthermore, in a Glasgow study on treated hypertensive patients, lower serum chloride was associated with higher baseline blood pressure( Reference McCallum, Jeemon and Hastie 50 ). There is increasingly more evidence that chloride may be even more important than sodium in blood pressure regulation in populations with high salt intake( Reference McCallum, Lip and Padmanabhan 51 ).
In addition, serum sodium and potassium displayed a non-linear association with hypertension, which is supported by Mente et al.( Reference Mente, O’Donnell and Rangarajan 52 ). Our results are also consistent with a Xinjiang study( Reference Hu, Xu and Liang 53 ) conducted in another region of high salt intake in China. A high dietary sodium chloride intake has also been shown to increase the pressor response to both noradrenaline and angiotensin II, and thus contribute to salt sensitivity. The research of Dahl et al.( Reference Diz 54 ) recognised and made it putative that the effects of high salt intake are not necessarily immediate. When an entire population eats salt excessively, hypertension will develop among those genetically susceptible. Therefore, epidemiological studies of salt v. blood pressure will not show a relationship of salt to hypertension. This was termed the saturation effect.
The present study has the advantages of a large sample size with high frequency of hypertension in a population with high salt intake, and the availability of six serum electrolytes measurements. However, the cross-sectional nature of our study cannot determine a causal effect between electrolytes and hypertension. Another major limitation is the method of daily salt intake estimation. Although participants were interviewed individually on salt intake, the questions were household-based and hence could only reflect the average salt intake per household according to each participant’s response. This response may also differ between members of the same household. Although bias due to unmeasured confounding factors, such as serum bicarbonate, plasma renin, albumin, parathyroid hormone, vitamin D, dietary intake of electrolytes and urinary electrolyte excretion could not be excluded, selection bias was low due to the population-based nature and high participation rate of the study. The excluded participants were largely hypertensive; therefore, the present study’s results may be an underestimation of the effects in the previously diagnosed hypertensive group. Furthermore, as data collection occurred independently of the research question, electrolyte measurements were not recorded to the smallest decimal, therefore serum magnesium could only be analysed as two stratified groups. Even though we were unable to assess the relationship of albumin-corrected calcium with hypertension, the upper range of the lowest total calcium quartile (2·24 mmol/l) was just below the clinical lower limit for normal serum calcium (2·25 mmol/l). As essential hypertension accounts for approximately 95 % of all types of hypertension in the general population( Reference Carretero and Oparil 55 ), our results largely reflect this group even though the distinction was not made with secondary hypertension. Finally, it is important to emphasize that 24 h urine samples and intracellular electrolyte concentrations may correlate best with physiological effects, but are difficult to obtain in large epidemiology studies. As only a small number of participants had very high glucose levels, serum sodium was not corrected for serum glucose.
Conclusion
In conclusion, serum total calcium, magnesium and chloride levels displayed the most significant association with IH and/or PDH. In the clinical setting, patients with IH may have electrolyte disturbances, such as hypercalcaemia, which may indicate other underlying aetiologies. Further prospective studies are also needed to evaluate the relationship of chronic serum electrolyte imbalances with the development of hypertension.
Acknowledgements
Financial support: This study was supported by grants from the ‘Twelfth Five-Year’ project funds (National Science and Technology Support Program of China, grant number 2012BAJ18B02). The National Science and Technology Support Program of China had no role in the design, analysis or writing of this article. Conflict of interest: The authors declare that there is no conflict of interest regarding the publication of this paper. Authorship: Conception and design of the study: H.G., Y.S.; generation, collection, assembly, analysis and/or interpretation of data: D.W., Y.C.; drafting or revision of the manuscript: D.W., Y.C., H.G., Y.S.; approval of the final version of the manuscript: D.W., Y.C., H.G., Y.S. Ethics of human subject participation: This study was conducted according to the guidelines laid down in the Declaration of Helsinki and all procedures involving human subjects were approved by the Ethics Committee of China Medical University (Shenyang, China). Written informed consent was obtained from all subjects.
Supplementary material
To view supplementary material for this article, please visit https://doi.org/10.1017/S1368980019000260