


Madam
The paper by Chepulis et al.( Reference Chepulis, Mearns and Hill 1 ) published online by this journal contains errors, inconsistencies, unsubstantiated statements and a lack of evidence to support its conclusions. The following comments refer to the different sections of the paper as published.
Abstract
There is an error in the abstract and on p. 4 of the paper, which reports that New Zealand had the highest percentage of beverages with added sugar while the UK had the lowest with 9 %. The UK figure should be 39 %. The erroneous figure was seized upon by the New Zealand media to demonstrate how far behind New Zealand was from the UK and to highlight the potential impact of a sugar tax.
Objective and introduction
The paper’s objective is to compare a range of elements of beverages available in supermarkets from four countries. The authors however note that ‘different methods for collection of data were used between the countries, which may have influenced the comparability of data’ (p. 8). We consider this a major impediment to achieving the overall objective of comparison.
The statement is made (p. 2) that ‘these larger product sizes distort the consumer perception of what a “normal” serving size should be and encourage higher consumption’ and the authors provide a reference to a report (Australian Health Survey: Nutrition First Results – Food and Nutrients, 2011–12) by the Australian Bureau of Statistics (ABS)( 2 ). This ABS report does not include discussion of product sizes, distortion, consumer perceptions or the encouragement of higher consumption.
Methods
The definitions of fruit juice used in the paper do not align to the definitions that regulate products within each country. In the Australia New Zealand Food Standards Code( 3 ), a ‘fruit juice’ does not contain water (unless reconstituted to previous normal levels). Rather, a diluted fruit juice becomes a ‘fruit drink’. The paper defines ‘fruit juices’ as products where fruit juice is the first ingredient or the majority ingredient. This is incorrect for Australia and New Zealand. As a result, many products in Australia and New Zealand have been misallocated for consideration as fruit juices with the potential to skew the results for Australia and New Zealand.
The paper states (p. 2) that ‘for each product, the following data were recorded from the product nutrition labels’ (current author’s underlining) and proceed to list a wide range of data unrelated to nutrition. The paper should refer to the data being drawn from product labels.
The authors state (p. 3) that ‘different pack sizes of the same product (within a country) were considered duplicates and removed from the data set’. It is not clear which pack size was retained and whether this was the largest or the smallest. Since differing pack/container sizes were analysed as a part of the paper, this has the potential to skew the results and conclusions.
Data analyses
The use of a reference tool from the USA when no US products are assessed in the paper is justified on the basis that this is ‘due to a lack of equivalent guidelines in all countries in question’ (p. 3). It is correct that there are no equivalent guidelines. However, Canada has reference amounts in law( 4 ) and accompanying serving sizes are provided in a table produced by the Canadian Food Inspection Agency( 5 );
Carbonated and non-carbonated beverages: 375 ml
Juices and fruit drinks: 250 ml
Sports drinks and water: 600 ml
These align with the amounts in the paper but they do not align with the amounts in the US Code (Title 21, Part 101.12)( 6 ). It appears the values in the paper are Canadian ones. The US Food and Drug Administration (FDA) serving size for fruit and vegetable juices is 240 ml (the paper says 250 ml) and for carbonated and non-carbonated (non-fruit) beverages, 360 ml (the paper says 375 ml).
The statement is made (p. 2) that ‘container sizes frequently exceed the reference amounts for beverages as specified by the [FDA]’. This statement is incorrect as the reference amounts do not stipulate container sizes (current author’s underlining) in any way (the FDA gives reference amounts customarily consumed by eating occasion, i.e. serving size).
Various terms are used in the paper related to sugar. The only definition provided is that of the UK Scientific and Advisory Committee (SACN)( 7 ) of ‘free sugars’, described in the paper as ‘all monosaccharides (e.g. glucose and fructose) and disaccharides (e.g. sucrose) added by the manufacturer as well as all naturally occurring sugars in honey, syrups, fruit juices and juice concentrates’ (p. 3). SACN did not refer to juice concentrates. With such an array of terms, there is difficulty in determining what the authors mean when they use each term.
The paper states (p. 3) that: ‘Taxation categories were <5 g sugar/100 ml (no tax), 5–8 g sugar/100 ml (18 % tax per litre) and >8 g sugar/100 ml (24 % tax per litre)’. The tax is in pence per litre (current author’s underlining), not per cent( Reference Barber 8 ). This means that the top tax rate above 8 g sugar/100 ml is 24 p per litre, not 24 % per litre. This error is repeated in the caption for Fig. 1.
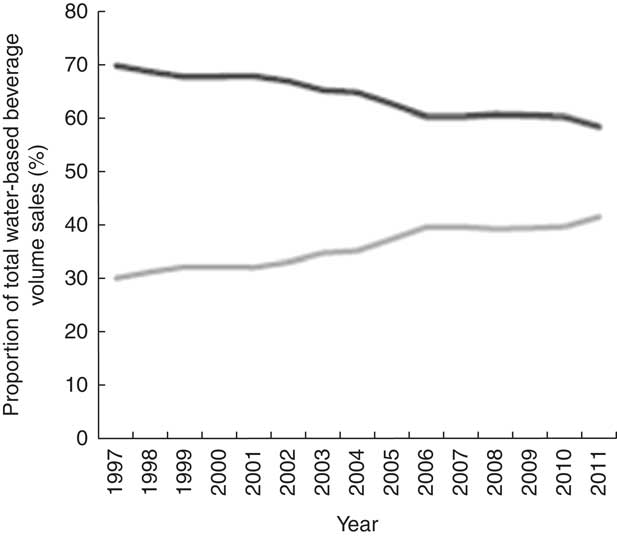
Fig. 1 Trends in sales of non-sugar water-based beverages (![]() ) and sugar-sweetened water-based beverages (
) and sugar-sweetened water-based beverages (![]() ), Australia, 1977 to 2011. From Levy and Shrapnel(
Reference Levy and Shrapnel
16
)
), Australia, 1977 to 2011. From Levy and Shrapnel(
Reference Levy and Shrapnel
16
)
Container sizes are not serving sizes, but the authors appear to be implying they are or that container sizes are in some way regulated (and that these regulations are being ignored). This is misleading. Container sizes do not exceed regulations because no such regulations exist. There are good waste management, consumer cost minimisation and efficiency of production reasons for providing more than a single serving in a container. None the less, many beverage companies in New Zealand have moved to provide single serving size products due to consumer demand.
Results
The paper reports on significant differences between countries for the sugar content of beverages, reporting that the differences for water are ‘F (df 3)=4·0, P=0·009’. This is incorrect. These data from Table 1 are for fruit juices. The data for water are F (df 3)=0·57, P=0·637.
Discussion
The first statement is incorrect: ‘Across the four countries, SSB [sugar-sweetened beverages] dominate the non-alcoholic beverage market’ (p. 7). In total 4157 beverage products were surveyed and 1805 contained added sugar. As a result, 43 % of the non-alcoholic beverages on the market had added sugar and therefore they do not ‘dominate’ the non-alcoholic beverage market.
The paper states (p. 7) that ‘multiple studies support strong associations between availability, purchasing and consumption of SSB’ and references two papers. One paper by Brisbois et al. ( Reference Brisbois, Marsden and Anderson 9 ) makes no statement about container size and concludes that availability and consumption are not predictors of the contribution of sugar to energy intake from beverages. The second paper, a personal view by Popkin and Hawkes( Reference Popkin and Hawkes 10 ), refers to portion size reduction but only in relation to the failed implementation by New York City and to limited portion sizes of fruit juice in schools in the USA, drawing no conclusion from either of these occurrences.
The paper then states (p. 7) that a wastage of 30 to 40 % is predicted to occur between availability and consumption, but (p. 7) that ‘generally the higher the availability of SSB, the higher the population consumption’. The reference to wastage is from the paper by Brisbois et al. ( Reference Brisbois, Marsden and Anderson 9 ), which notes that food waste has been estimated to have increased by 50 % since the 1970s and that a 40 % waste adjustment factor may still be too low. Brisbois et al.’s paper concludes that ‘availability data suggests that added sugars intakes have been stable or modestly declining as a percent of total energy over the past three decades’. Availability and consumption are not predictors of the contribution of sugar to energy intake from beverages.
The paper states that a study on proxy SSB and fruit juice availability deduced that in 2010 New Zealand ‘had the highest consumption of fruit juices at an average of 0·83 servings per day’ (p. 7). Fruit juice in New Zealand features in the Food and Nutrition Guidelines for Healthy Children and Young People ( 11 ) (the NZ Nutrition Guidelines), which advise that a cup (250 ml) of juice can be counted as a serving of the fruit and vegetable food group. This is a major reason fruit juice consumption in New Zealand has been high. In any event, fruit juice has the lowest rate of sugar added from the five categories in the study( Reference Chepulis, Mearns and Hill 1 ).
The paper (p. 8) states that ‘it is clear from these findings that the current nutrient composition of SSB, their high availability … is not conducive to reducing intakes of added sugar’. This statement has no basis in fact and no evidence identifies or supports the level of availability.
The paper states (p. 8) that: ‘This is particularly applicable in NZ and Australia, which consistently had the highest proportion of SSB for each of the five categories included in the present study’. This is incorrect as Canada had the second highest percentage of sugar added to fruit-based drinks.
The paper (p. 8) refers to the New Zealand Ministry of Health’s food and activity guidelines for both children and adults as not recognising fruit juice as a fruit serving. This is incorrect. The NZ Nutrition Guidelines did, and still do, refer to fruit juice as counting as a serving of fruit in several places.
The paper (p. 8) refers to the impact of taxation in Mexico as generating a decrease in purchases of SSB of 5 % in the first year and a 12 % decrease in the second year. The second-year decrease reported in the paper was the result of an observational study only and does not reflect the actual impact. The graph used in the paper showed that from mid-2012, consumption of SSB was already trending down and the taxation did not alter that trend. Sales data for Mexico from Neilsen (purchased by the New Zealand Food & Grocery Council) showed that there was ‘no consistent or even noticeable change [in sales of SSB] following January 2014 upon the introduction of the tax’( Reference Rich 12 ).
The paper purports (p. 9) that it ‘offers some relevant comparisons about potential effects of fiscal v. self- or informal regulation of the beverage industry with regard to SSB’. Since there is no evidence that fiscal impacts are positive, this statement is incorrect and misleading. It is also contrary to the authors’ conclusion (p. 9) that, in the absence of consumption data, the impacts of taxation and reformulation cannot be determined.
Conclusion
The paper states (p. 9) that certain beverages are ‘heavily marketed and readily available’. No evidence for either statement is provided in the paper.
The conclusion is then made (p. 9) that: ‘Self-regulation by the food and beverage industry is not working’. There is no basis to this statement. The only mention of ‘self-regulation’ in the paper is in relation to a ‘suggestion’ that it is not working because ‘consumption of fruit juices does not align with the most recent guidance in the NZ Ministry of Health’s food and activity guidelines’. The Ministry of Health’s NZ Nutrition Guidelines do currently allow fruit juice to be counted as a serving of fruit and vegetables and, without any earlier comparative data and in the absence of consumption data, there is no evidence to support the statement that self-regulation is not working.
The absence of any information or evidence associated with marketing, price relativities and availability means the statement (p. 9) that ‘policies are urgently required … [to control the] … marketing, composition, price and availability … as a strategy to address factors that contribute significantly to the current obesity epidemic’ is incorrect and unsubstantiated. In fact, the paper makes repeated references to ‘marketing’ and ‘marketed’ (eight in total), yet marketing was not part of the data and there is no substantiation in the paper for marketing being described as it is as ‘aggressively’, ‘heavily’ or ‘active to certain sectors’ (p. 1, 2 and 9).
Closing comments
Chepulis et al.’s paper( Reference Chepulis, Mearns and Hill 1 ) nevertheless shows that in New Zealand, almost one in two beverages (non-dairy) available in the supermarket do not contain (current author’s underlining) any added sugar. We also know that:
1. a government survey( 13 ) found that only 1·1% of an average child’s energy intake came from SSB;
2. New Zealanders choose to drink water a third of the time while soft drinks are chosen less than 4 % of the time (based on Neilsen data);
3. the consumption of water has grown by 21 % since 2010 while the consumption of soft drinks continued to trend downwards by 4·2 % over the same period( 14 ); and
4. manufacturers are responding to consumer demand for low-sugar alternatives by reformulating their products, offering smaller pack sizes and promoting low- and no-calorie soft drinks( 15 ).
These trends are replicated in Australia. Over 15 years, from 1997 to 2011, the sales of non-alcoholic, water-based beverages increased by 26 % with an annual growth rate of 1·7 %. This growth rate was driven by increasing sales of non-sugar beverages, which increased by 73 % with an annual growth rate of 4·9 %( Reference Levy and Shrapnel 16 ), as can be seen in Fig. 1.
New Zealand may already have reached the tipping point where no-added-sugar drinks dominate the market; and, if milk drinks are added to the category of ‘no-added-sugar’ drinks, most being unflavoured, New Zealand would certainly already be there.
Acknowledgements
Financial support: This research received no specific grant from any funding agency in the public, commercial or not-for-profit sectors. Conflict of interest: K.R. is employed as the CEO of the New Zealand Food & Grocery Council (NZFGC). The NZFGC is funded by members from the food and beverage manufacturing sector in New Zealand including manufacturers of beverages sold in supermarkets. Authorship: K.R. is the exclusive author of the letter. Ethics of human subject participation: Not applicable.

