

Unhealthy diet is the leading preventable risk factor contributing to the burden of disease in Australia and globally( 1 ). The Australian Dietary Guidelines (ADG)( 2 ) provide evidence-based recommendations that aim to promote the potential benefits of healthy eating, improve community health and well-being, and reduce the risk of diet-related disease( 2 ). However, less than 7 % of Australians consume a diet consistent with these guidelines( 3 ).
A range of factors affect dietary choices, including price, availability, accessibility and promotion of foods( Reference Lee, Ralston and Truby 4 ). These factors can contribute to population food insecurity, that is having inconsistent physical, social and economic access to sufficient, safe and nutritious food that meets dietary needs and food preferences for an active and healthy life( 5 ). Perceived low affordability has been reported as a key barrier to the purchase of ‘healthy’ foods, particularly in low socio-economic groups, although well-defined data in this area are lacking( Reference Williams 6 – Reference Lee, Mhurchu and Sacks 8 ). It has been suggested that food is affordable when no more than 30 % of household income is required for its purchase( Reference Burns and Friel 9 ). Price elasticity studies have reported that consumers are more sensitive to price differences between close substitute foods (for example, white v. wholemeal bread) than to price changes between less similar foods, further suggesting that cost may play a role in the choice between healthy and unhealthy diets( Reference Hawkes 10 ).
Different approaches have been utilised to monitor food prices in Australia, such as Consumer Price Indexes( Reference Burns, Sacks and Gold 7 ) and supermarket price surveys( Reference Lee, Mhurchu and Sacks 8 , Reference Williams, Reid and Shaw 11 ) tallying and comparing the price of highly selected individual food items. A variety of ‘food basket’ methods that assess the cost of diets, rather than foods, have also been developed within Australia for a variety of purposes at state, regional and community levels( Reference Williams, Reid and Shaw 11 ). These methods have the potential to measure the cost of a healthy diet; however, dissimilarity of metrics is a recognised barrier to the production of comparable data( Reference Seal 12 ) that would help pinpoint areas of high food insecurity and better inform policy and practice in relation to food pricing and affordability.
A stepwise food price and affordability monitoring framework has been developed by the International Network on Food and Obesity/non-communicable disease Research, Monitoring and Action Support (INFORMAS) network( Reference Lee, Mhurchu and Sacks 8 ). The framework advocates ‘minimal’, ‘expanded’ and ‘optimal’ monitoring approaches, including measurement indicators of affordability, stratification by region and socio-economic status (SES), and representative sampling. This approach provides potential for robust national data benchmarks and international comparisons. To assist in the development of national food price and affordability monitoring tools, protocols and methods for use in Australia consistent with the INFORMAS framework, we conducted a systematic review to determine similarities and differences in the metrics and results between recently and/or currently used tools and protocols for monitoring Australian ‘healthy’ food prices and affordability.
Methods
The systematic review was conducted based on the PRISMA (Preferred Reporting Items for Systematic Reviews and Meta-Analyses) statement( 13 ) and included peer-reviewed and grey literature published from 1995 to 2015 (Fig. 1).
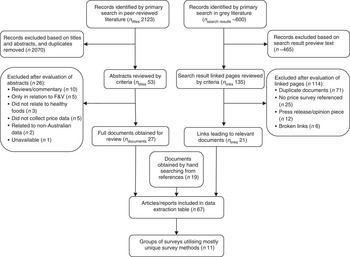
Fig. 1 PRISMA (Preferred Reporting Items for Systematic Reviews and Meta-Analyses) diagram showing the flow of studies (F&V, fruit and vegetables)
Seven electronic databases were searched: Informit Health; MEDLINE, PubMed; EMBASE; CINAHL; Web of Science: Science Citation Index and Conference Proceedings Citation Index; and the Cochrane Library. Grey literature was searched using Google.com.au advanced searches, limited to the web address extensions of .gov.au, .org.au, .net.au and .com.au. The search terms used were ‘health*’, ‘food’, ‘diet*’, ‘cost/price/afford*’, ‘healthy food’ and ‘healthy diet’, with additional location limiting to Australia where necessary. Following identification of pertinent results, reference lists were reviewed and hand searching identified other known documents. Search results for the same journal article or web links to the same report were excluded as duplicates. However, discrete journal articles and reports that related to the same collected data set were included.
The initial search results were reviewed against the inclusion criteria of relating to ‘healthy’ food and diet price assessment tools, protocols, methods and results using methods of retail pricing and being pertinent to Australia (at a national, state, regional or local community level). ‘Healthy food price assessment’ was defined as the costing or pricing of a list, or basket, of foods that represent a ‘healthy’ diet for one or more persons. Thus studies relating to comparative pricing of selected individual ‘healthy’ and ‘unhealthy’ foods were not included( Reference Ferguson, O’Dea and Chatfield 14 ). Articles and reports relating to household food expenditure methods, interventions to alter purchasing habits and dietary improvement modelling were excluded. Additionally excluded were: reviews, commentaries, press releases and opinion pieces; surveys solely relating to fruit and vegetables (F&V); and surveys where no price data were collected. Poster presentations were also excluded due to their providing insufficient information in relation to the survey methods.
Copies of three reports identified through hand searching( Reference Leonard, Zlotkowski and Harrison 15 – Reference Lowry 17 ) and reports of the Northern Territory Market Basket (NTMB) surveys for 1998–2002 and 2013 were not publicly accessible, so were excluded from the analysis.
The systematic search identified thirty-nine reports and twenty-four journal articles which described fifty-nine discrete healthy food pricing surveys undertaken within Australia. Some of these surveys were reported in the grey literature as well as in one or more published journal articles. In addition, some journal articles described a time series of surveys.
The contents of the journal articles and reports were analysed to determine all available information relating to the basket contents (the food pricing tool), representative households, source of household income, sampling of stores for the survey, timing of data collection, process instructions for data collection (e.g. brands or generic brands, missing item protocols), data analysis methods and reported results.
Due to the broad scope of the review, large volumes of data were identified from the reports and articles. The data were transcribed into separate tables according to the type of information listed above. Within each table, the survey data are ordered by the food pricing tool, then geographical reach and then time. Two summary tables are included in the body of this manuscript; the remaining data are included in the online supplementary material due to the large size of the data sets.
Results
Food pricing tool
Analysis of the fifty-nine discrete surveys (Table 1) identified six ‘major’ food pricing tools (defined as those used in multiple areas and at multiple time periods) and five ‘minor’ food pricing tools (defined as those used in only one survey area or at one time period). Surveys were conducted to assess food prices for different purposes at various geographic levels: statewide, regional or local. Each survey area included one or more local government areas, with one or more stores included within each local government area. All state/territory-wide surveys used a major food pricing tool by definition. The two food pricing tools developed most recently, the Revised Queensland Healthy Food Access Basket (HFAB)( 18 ) and the Healthy and Sustainable (H&S) basket developed by Friel et al.( Reference Friel, Barosh and Lawrence 19 ), included more contemporary methodology than the other food pricing tools.
Table 1 Summary of the major food pricing tools (n 5) and minor food pricing tools (n 6) used in Australia

* Major: food pricing tools used across multiple survey areas and multiple time periods.
† Minor: food pricing tools used in one survey area or at one time period, with some minor variations.
Table 2 shows that all of the food pricing tools, with the exception of the H&S basket( Reference Friel, Barosh and Lawrence 19 ), measured the price of a ‘healthy’ basket of food items developed to reflect a ‘healthy’ diet, which was informed by the principles of the national dietary guidelines( Reference Williams, Reid and Shaw 11 , 20 – 24 ). Model B of the Core Food Groups( Reference Cashel and Jeffreson 25 ) of the 1992 ADG( 26 ) was used by all these tools except the Revised QLD HFAB( 18 ), which adjusted the basket contents to meet new modelling( 27 ) developed to inform the revision of the ADG in 2013( 2 ).
Table 2 Contents and representative households of the food pricing tools used in Australia

LGA, local government area; NHMRC, National Health and Medical Research Council; RDI, Recommended Dietary Intake; ARIA, Accessibility/Remoteness Index of Australia; ABS, Australian Bureau of Statistics; F&V, fruit and vegetables; AGHE, Australian Guide to Healthy Eating; UHT, ultra-heat-treated; NRV, Nutrient Reference Value; EAR, Estimated Average Requirement; AI, Adequate Intake; SDT, suggested dietary target; P:M:S, polyunsaturated:monounsaturated:saturated fat; ADG, Australian Dietary Guidelines; GHGE, greenhouse gas emissions.
* See Table 1 for explanation of food pricing tool abbreviations.
The Western Australia Food and Cost Survey (WA FACS) food pricing tool( Reference Pollard and Landrigan 28 ) conceptually falls within the group that measured a single ‘healthy’ basket, although the tool included a very comprehensive list of foods for pricing that produced a database encompassing the contents of similar ‘healthy’ baskets, such as the QLD HFAB, to potentially enable comparison with the results of surveys using these food pricing tools.
All tools, except the H&S basket and the Revised QLD HFAB, described ‘healthy’ baskets that included several ‘unhealthy’ non-core or discretionary foods (energy-dense, nutrient-poor foods not required for health that are high in added sugar, saturated fats, salt and/or alcohol( 2 )), such as sugar and oil( 20 , 24 ), to adjust the energy content of the basket, and also included commonly consumed discretionary foods, such as sausages( Reference McIntyre 21 ), cake( Reference Williams, Reid and Shaw 11 , Reference Meedeniya, Smith and Carter 23 ) or chocolate( Reference Meedeniya, Smith and Carter 23 ). Thus most ‘healthy’ baskets do not constitute a diet consistent with current ADG recommendations. This was acknowledged by authors of one of the Australian food pricing tools( 20 ), but not others.
In addition, five of the major( Reference Williams, Reid and Shaw 11 , 18 , 20 , Reference Palermo and Wilson 22 , Reference Pollard and Landrigan 28 ) and one of the minor( Reference Meedeniya, Smith and Carter 23 ) food pricing tools included a separate, arbitrary group of ‘unhealthy’ foods, such as soft drinks, meat pies or chocolate, to try to compare pricing with the ‘healthy’ basket. These items were highly selective and few in number, and were not reported as intending to constitute an ‘unhealthy diet’.
In contrast to these single basket approaches, the H&S basket( Reference Friel, Barosh and Lawrence 19 ) developed both a ‘typical’ basket and a ‘healthy and sustainable’ basket. The contents of the ‘typical’ basket was informed by dietary patterns observed from the 1995 Australian National Nutrition Survey( 29 ). To create the ‘healthy and sustainable’ basket, many of the ‘typical’ basket items were substituted with foods aligning both with the ADG (2013) and selected environmental sustainability principles, such as consideration of environmental impacts of production processes (carbon footprint, water usage, biological diversity). Therefore the H&S study did not include tinned and frozen foods and excluded other foods considered healthy in the ADG, such as sweet potato, cauliflower and capsicum, due to their environmental impact compared with other vegetables.
Different research groups often adapted food pricing tools for use outside the original geographical locations for which they were developed without reporting detailed rationale. For example: the Victorian Healthy Food Basket (VHFB) is based upon the QLD HFAB, with unspecified contents varied to include ‘local food choices’ and to ‘ensure availability’( Reference Palermo and Wilson 22 ); subsequent application of the VHFB tool in Tasmania included unspecified ‘local food choices’( Reference Le, Murray and Long 30 ); and contents of the QLD HFAB were adjusted for unspecified local cultural differences for use in inner-city Melbourne, Victoria( Reference Renzaho 31 ).
Household composition
Identification of a reference household for the survey area population is required in order to inform the quantity of foods in the basket to be costed. Six different household structures were described across the eleven food pricing tools, ranging from a household of two adults, three children and an older female, to a household of a single male. Three of the major( Reference Williams, Reid and Shaw 11 , 20 , 24 ) and three of the minor( Reference McIntyre 21 , Reference Meedeniya, Smith and Carter 23 , Reference Barosh, Friel and Engelhardt 32 ) food pricing tools included one household, whereas the other food pricing tools included between two and five different households.
The ages and gender of the adults and children within the reference households varied, which has implications for household nutritional requirements and food quantities. However, gender( Reference McIntyre 21 , Reference Meedeniya, Smith and Carter 23 , Reference Pollard and Landrigan 28 , Reference Davidson 33 ) and ages( Reference McIntyre 21 , Reference Meedeniya, Smith and Carter 23 ) of all reference household members were not consistently reported. A common rationale for selection of reference household composition was inclusion of a variety of age groups( 20 , Reference McIntyre 21 , Reference Meedeniya, Smith and Carter 23 ) and a cross-section of people with specific nutrient requirements( 24 ). Some food pricing tools selected reference households that were considered to reflect the usual characteristic families of the survey area( Reference Williams, Reid and Shaw 11 , Reference Palermo and Wilson 22 , Reference Kettings, Sinclair and Voevodin 34 ). No rationale was reported in relation to household composition for three of the food pricing tools( Reference Pollard and Landrigan 28 , Reference Barosh, Friel and Engelhardt 32 , Reference Davidson 33 ).
Availability
All of the food pricing tools assessed availability of all basket items. Four of the major( 18 , 20 , 24 , Reference Le, Murray and Long 30 ) and one of the minor( Reference Meedeniya, Smith and Carter 23 ) food pricing tools assessed availability of specific F&V. Two major food pricing tools( 20 , Reference Pollard and Landrigan 28 ) also measured the availability of food items considered a ‘better nutritional choice’ than common items, such as wholemeal bread or reduced fat milk. (See online supplementary material, Supplemental Table 1.)
Authors suggested that availability of healthy foods should be reported, as poor availability can indicate food insecurity( 20 , Reference McIntyre 21 , 24 , Reference Pollard and Landrigan 28 ). Similarly, measurement of availability of ‘better nutritional choices’ in remote and very remote areas was considered desirable( 20 ).
Quality assessment
Subjective assessment of F&V quality in stores was undertaken in four major( 24 , Reference Pollard and Landrigan 28 , Reference Le, Murray and Long 30 , 35 , Reference Chapman, Kelly and Bauman 36 ) and two minor( Reference McIntyre 21 , Reference Meedeniya, Smith and Carter 23 ) food pricing surveys. Only the WA FACS tool attempted to assess meat quality( Reference Pollard and Landrigan 28 , Reference Pollard, Savage and Landrigan 37 ).
Household income
In order to determine the level of affordability of the ‘healthy’ baskets, most surveys, at least once, included estimation of reference household income. (See online supplementary material, Supplemental Table 2.) Indicative household income was calculated from Australian welfare data( 38 ) in four food pricing surveys( 18 , Reference Meedeniya, Smith and Carter 23 , 24 , Reference Davidson 33 ). Three others included estimation of paid employment income( Reference Friel, Barosh and Lawrence 19 , Reference Marshall, Morrison and Martin 39 , Reference Sorbello and Martin 40 ) and both methods were applied with three major( Reference Williams, Reid and Shaw 11 , Reference Palermo and Wilson 22 , Reference Pollard and Landrigan 28 ) and one minor( Reference Kettings, Sinclair and Voevodin 34 ) food pricing tools.
Calculation of the welfare income appeared to be based on the assumption that none of the adults in the households were employed. While limited information was reported, it appears that only the main fortnightly welfare payments, such as unemployment benefits and the aged pension, were usually included from published sources( 41 , 42 ). In contrast, the Revised QLD HFAB food pricing tool included all possible annual payments in addition to the main payments( 18 ).
Store selection
Store sample selection tended to be influenced by the survey rationale. Statewide or territory-wide surveys aimed to investigate the effect of locality and remoteness on food price and availability, regional surveys looked more at the effect on price by SES within the survey area, and local area surveys often focused on food security. Hence, the methods used for selecting participating stores varied widely, and were independent of the food pricing tool used. (See online supplementary material, Supplemental Table 3.) Further, different store sampling techniques were used in different time periods for otherwise similar surveys; for example, the QLD HFAB statewide surveys changed from convenience sampling (2000, 2001, 2004) to representative sampling in 2006 and 2010( 43 ).
No nationally representative food price surveys have been conducted across the whole of Australia. Only statewide surveys of Queensland( 18 , 43 , 44 ), Western Australia( Reference Pollard and Landrigan 28 , Reference Pollard, Savage and Landrigan 37 ) and Tasmania( Reference Murray, Ahuja and Auckland 45 ) utilised representative sampling techniques. In these studies towns or stores were stratified according to the Socio-Economic Indexes for Areas (SEIFA)( Reference Murray, Ahuja and Auckland 45 ) or Accessibility/Remoteness Index of Australia (ARIA) classifications( 18 , Reference Pollard and Landrigan 28 , Reference Pollard, Savage and Landrigan 37 , 43 , 44 ), then locations were randomly selected within these stratifications. SEIFA ranks statistical areas of Australia by a range of socio-economic variables including household income, education, employment, occupation and housing( 46 ). ARIA provides a geographical measure of remoteness based upon the access to a service centre of a defined population size( 47 ). The Queensland and Western Australia surveys determined sample sizes to detect differences of 10 % between remoteness categories at P<0·05 and 90 % power, and oversampled very remote localities. The Tasmania survey oversampled stores in the lowest SEIFA tertile.
Other statewide surveys (in New South Wales, Northern Territory and early Queensland studies) used convenience sampling; these also selected the largest store in each included town, or district( 20 , 24 , Reference Burns, Gibbon and Boak 48 ), within the survey area. All of the regional surveys used convenience sampling, with occasionally some grouping based on SEIFA classifications, prior to including all stores( Reference Barosh, Friel and Engelhardt 32 ), a store from each major supermarket chain( Reference McIntyre 21 , Reference Wong, Coveney and Ward 49 , Reference Ward, Coveney and Verity 50 ) or the largest store( Reference Williams, Reid and Shaw 11 , Reference Tsang, Ndung’u and Coveney 51 ) within those localities.
One regional survey in south-western Victoria( Reference Burns, Gibbon and Boak 48 ) included all food outlets in towns with a population of more than 100 residents. One statewide survey in New South Wales simply selected supermarkets based on the preferences of volunteer data collectors( Reference Chapman, Kelly and Bauman 36 ) and one regional survey of rural and regional Victoria utilised convenience sampling based on the placement locations of student data collectors( Reference Palermo, Walker and Hill 52 ).
Local area sampling methods mainly included every supermarket within the bounds of the survey area( Reference Le, Murray and Long 30 , Reference Renzaho 31 , Reference Davidson 33 , Reference Marshall, Morrison and Martin 39 , Reference Sorbello and Martin 40 , Reference Trezise 53 – Reference Bradley 59 ). Two local methods included one supermarket from both of two major chain stores from each locality within the local area( Reference McIntyre 21 , Reference Kettings, Sinclair and Voevodin 34 ). Two reports of local area surveys did not provide any information regarding the criteria for store selection( Reference Thomson 60 , Reference Stirrat 61 ).
Data collection periods occurred in all months except January. In surveys across multiple localities, data were collected within a maximum three-month window. To reduce potential effects of seasonality, time series data were usually collected in the same months. However, one survey (NTMB) deliberately altered the timing of the data collection period in one year to try to test for seasonality effects( 62 ).
Data collection protocols
Brands
Studies noted that the use of specified common brands helped ensure both consistency of data collection in all stores on all occasions and comparability over different time periods. The most common protocols (four of the major( Reference Williams, Reid and Shaw 11 , 18 , 20 , Reference Palermo and Wilson 22 ) and all minor food pricing tools) specified recording the price of the cheapest brand (not generic) for each food item. Generic brand prices were collected separately, or included as the cheapest brand in four major( Reference Williams, Reid and Shaw 11 , 18 , 20 , Reference Pollard and Landrigan 28 ) and three minor( Reference Friel, Barosh and Lawrence 19 , Reference Davidson 33 , Reference Kettings, Sinclair and Voevodin 34 ) methods. The WA FACS protocols( Reference Pollard and Landrigan 28 ) included collection of multiple brand name prices and a generic brand price for each food item, to increase the likelihood of collecting at least one price in each store. The collection of sale prices was excluded from all but two major( Reference Pollard and Landrigan 28 , Reference Murray, Ahuja and Auckland 45 ) and one minor( Reference Davidson 33 ) food pricing tool. (See online supplementary material, Supplementary Table 4.)
Size
Product size protocols were reported for all major and three minor( Reference McIntyre 21 , Reference Meedeniya, Smith and Carter 23 , Reference Kettings, Sinclair and Voevodin 34 ) food pricing tools; a ‘standard or medium size’ was reported for one of these minor tools( Reference Kettings, Sinclair and Voevodin 34 ). Product size protocols were not reported for the remaining two minor tools( Reference Friel, Barosh and Lawrence 19 , Reference Davidson 33 ).
If the specified product size was not available, data collectors were instructed to select the next smallest size for four of the major( Reference Williams, Reid and Shaw 11 , 18 , 20 , Reference Palermo and Wilson 22 ) and one minor( Reference Meedeniya, Smith and Carter 23 ) food pricing tools. Instructions to choose either a smaller or larger size were reported for two major( 24 , Reference Pollard and Landrigan 28 ) and one minor( Reference McIntyre 21 ) food pricing tools. Missing item protocols were not reported for the remaining three minor food pricing tools( Reference Friel, Barosh and Lawrence 19 , Reference Davidson 33 , Reference Kettings, Sinclair and Voevodin 34 ).
Data analysis protocols
To derive the cost of the ‘healthy’ basket, each food pricing survey determined the unit price of each food item and multiplied the unit price by the quantity required for each reference household. (See online supplementary material, Supplemental Table 5.) Analysis of the cost of ‘healthy’ meals was not reported in any of the food pricing surveys reviewed.
If an item was not available at a store, an average price of that item in similar locations was calculated. Similar locations were defined as stores: in the same ARIA category( 20 ); in the same local area( Reference Lade 57 ); of the same type( Reference Sorbello and Martin 40 ); in the total sample. Details of analysis protocols for missing items were not reported for most surveys( Reference Williams, Reid and Shaw 11 , 18 , Reference Pollard and Landrigan 28 , Reference Davidson 33 , Reference Kettings, Sinclair and Voevodin 34 ).
Reporting of results of food pricing surveys
As presented above, the food pricing surveys undertaken around Australia utilised a wide variety of tools, protocols and methods; consequently, a range of non-comparable findings have been reported. Reported results included: entire basket price; cost of food groups within the basket; cost of extras or ‘less healthy’ foods; availability of basket items; availability and variety of F&V and/or better nutritional choices; and F&V quality scores. Those surveys that described household income also reported on affordability of the total basket and food groups. (See online supplementary material, Supplemental Table 6.)
Cross-sectional results
Depending on the purpose of each survey and its geographic reach, results were stratified by ARIA and/or SEIFA/SES classifications, or reported for districts, local government areas, census collection districts or suburbs. In general, studies stratified by ARIA reported ‘healthy’ diet basket prices between 20 and 60 % higher in very remote areas compared with major cities. However, no association between location and basket price was found where studies stratified results by SEIFA/SES classification. On the other hand, the study using the H&S diet basket( Reference Barosh, Friel and Engelhardt 32 ) reported that the cost difference between the ‘healthy’ and the ‘typical’ basket was greater in disadvantaged areas.
Generally it was reported that between 25 and 40 % of the income of welfare-dependent family households was required to purchase the diet baskets, with a lower amount, about 18 % of income, required for single older person households.
Where assessed, it was reported generally that availability and quality of F&V and availability of ‘better nutritional choices’ were lower in remoter locations, and that more items were missing in small supermarkets and convenience stores than major supermarkets.
Time series results
Reports of temporal changes were possible in surveys utilising the same methods in the same area over time. While annual price differences occasionally decreased (usually due to recovery of prices of fresh produce following natural disasters( 63 )), as would be expected long-term trends showed increasing diet basket prices.
Affordability of the ‘healthy’ diet basket was reported over four years in Western Australia( Reference Pollard and Landrigan 28 ); over seventeen years in Northern Territory( 24 ); over ten years in Illawarra, New South Wales( Reference Williams, Reid and Shaw 11 ); and over three years in a local area in Victoria( Reference Givoni and Palermo 54 ). No significant trends in affordability were reported in the Northern Territory and Illawarra surveys; however, the shorter Western Australia and local Victoria surveys found affordability decreased slightly but significantly over time for welfare-dependent families.
Only in the Northern Territory( 62 ) was improved availability and quality of F&V reported over time.
Comparison between survey areas
Few comparisons of results across different geographical areas have been reported, even where technically possible in the WA FACS survey( Reference Pollard and Landrigan 28 ). Surveys using the Illawarra Healthy Food Basket (IHFB) tool in the Illawarra region( Reference Williams, James and Kwan 64 , Reference Williams, Hull and Kontos 65 ) compared results with Queensland( 43 , 66 ); however, only proportional changes over a similar time period could be reported due to methodological differences.
Discussion
The present review identified that six major and five minor food pricing tools and a wide range of protocols have been applied on a statewide, regional and local area basis in fifty-nine surveys in Australia. The reviewed surveys measured the cost of a basket of ‘healthy’ foods representing ‘healthy’ diets and have been able to provide answers to questions relating to relative price in different locations (more expensive in rural and remote areas than in capital and regional cities), relative price in disadvantaged areas (not significantly different), relative price over time (food prices increased) and affordability over time (relatively consistent). However, without comparison with the cost and affordability of currently consumed (‘unhealthy’) diets( Reference Burns, Sacks and Gold 7 ), it is challenging for these data to help inform potential policy approaches( Reference Lee, Mhurchu and Sacks 8 ). Measurement of the cost of a typical ‘unhealthy’ diet was not undertaken by any of the reviewed surveys except the H&S basket( Reference Barosh, Friel and Engelhardt 32 ). The price and availability of some ‘better nutritional choices’ or ‘unhealthy’ food items were included in some food pricing tools, but these measurements are insufficient to represent a ‘current’ or ‘unhealthy’ diet for comparison purposes( Reference Lee, Mhurchu and Sacks 8 ).
Governments have the potential to manipulate food prices to encourage consumption of ‘healthy’ foods via policies such as: taxation systems (tax liabilities on ‘unhealthy’ foods or tax exemptions of ‘healthy’ foods); agricultural or transport subsidies; or direct subsidies to high-risk populations such as provision of vouchers for healthy foods( Reference Lee, Mhurchu and Sacks 8 ). However, robust and relevant data are needed to inform policy action in relation to food pricing and taxation to improve the relative cost of healthy foods. Core to the INFORMAS stepwise food price and affordability monitoring framework( Reference Lee, Mhurchu and Sacks 8 ), at all levels, is measurement of the size and direction of the price differential between ‘healthy’ and ‘less healthy’ foods, meals or diets. Optimally, this approach utilises ‘healthy’ diets derived according to national dietary guidelines and ‘less healthy’ diets derived from national dietary intake data( Reference Lee, Mhurchu and Sacks 8 ). Use of this approach across Australia to provide a relationship between the price differential and SEIFA or ARIA stratification has the potential to provide the necessary data to inform policy.
While there were some similarities between the tools and protocols applied in the surveys, there were also many differences, even when the same food pricing tool was used in different survey areas or at a different time period. Methodological differences were found in: selection of ‘healthy’ basket contents; reference household composition; inclusion of availability and/or quality measures; household income sources; store sampling methods; season of data collection; and data collection protocols and analysis. As has been identified previously, it is not possible to compare results across different surveys, even when the same food pricing tool has been applied( Reference Burns and Friel 9 , Reference Seal 12 , Reference Palermo 67 ).
Lack of comparability of survey results is often due to alterations in a chosen food pricing tool to accommodate local population differences. The rationale for these alterations and selection of replacement foods were not clearly reported and appeared quite subjective. Additionally, the items within the food pricing tools were selected according to various criteria to represent a ‘healthy’ diet and it is difficult to see how alterations for local preferences will provide additional policy-relevant data.
The review found that ten of the eleven identified food pricing tools do not fully align with the principles of the 2013 ADG( 2 ), as discretionary foods and/or commonly consumed unhealthy foods were included within the defined ‘healthy’ basket. The H&S basket food pricing tool( Reference Barosh, Friel and Engelhardt 32 ) does align with the most recently revised ADG( 2 ) but specifically incorporates more exacting environmental sustainability principles, which appear to increase diet costs.
All of the food pricing tools, with the exception of the Revised QLD HFAB and the H&S basket, are based upon outdated dietary guidelines. The Revised QLD HFAB tool is also consistent with the healthy diet tool proposed under the optimal approach of the INFORMAS food price and affordability monitoring framework( Reference Lee, Mhurchu and Sacks 8 ).
In contrast to the measurement of basket item availability, the availability of F&V and ‘better nutritional choices’, and food quality, were not consistently measured by the surveys. Other studies looking at F&V quality and availability alone were identified during the literature search; however, these have not been included as they did not represent a complete diet. A separate review of these studies may be required.
Affordability of healthy foods has been assessed inconsistently. Determination of affordability requires calculation of household income, which will vary according to composition of the household and assumptions made regarding the working status and income source of household members. The use of government welfare payments, minimum wage levels or median household income to estimate household income also requires application of arbitrary assumptions. Therefore, comparisons will be challenging until methods are standardised. However, given the well-established social gradient of health associated with dietary quality, measuring the affordability of ‘healthy’ diets in relation to household income would provide a useful benchmark( Reference Lee, Mhurchu and Sacks 8 ). When assessed, affordability of the ‘healthy’ baskets was just below or over the suggested 30 % of household income level( Reference Burns and Friel 9 ). For comparison, it would also be useful to assess affordability of actual dietary intake( Reference Lee, Mhurchu and Sacks 8 , 68 ).
A narrative review that considered food pricing and affordability studies centred on whole diet costs conducted in New Zealand, Canada, the USA and the UK identified similar methodological concerns as described in our systematic review of the situation in Australia( Reference Lee, Mhurchu and Sacks 8 ).
There have been repeated calls for a nationally representative survey of the price and affordability of healthy foods in Australia since 2004, in order to highlight areas experiencing potential food insecurity due to high food prices( Reference Williams 6 , Reference Burns and Friel 9 , Reference Seal 12 , Reference Palermo 67 , Reference Lee, Kane and Ramsey 69 ). This will require the development of standardised tools and protocols that overcome many of the challenges identified in the current review( Reference Lee, Mhurchu and Sacks 8 , Reference Seal 12 ).
Such methods, aligning with the ‘optimal’ INFORMAS approach, are being finalised currently( Reference Lee, Kane and Ramsey 69 ). As an example of how these methods could be used to inform policy, they were used to investigate the impact of the potential extension of the 10 % goods and services tax( 70 ) to basic healthy foods (that are currently exempt from the goods and services tax) in Australia. The study showed that the price differential between healthy (recommended) and current (less healthy) diets would increase markedly if this policy change was implemented as proposed( Reference Lee, Kane and Ramsey 69 , 70 ). Finalisation and application of these methods has the potential to overcome many of the identified problems of the previous ‘healthy’ food price assessment methods undertaken in Australia.
Limitations
The present review was limited to those documents which were available from online searching. Additional food and diet pricing surveys may have been excluded if the reports were unavailable publicly. However, to our knowledge all of the major food pricing surveys, as well as many smaller, local surveys, have been located and analysed. Analysis of the food pricing survey was also limited to the reported information. In several instances details of data analysis or data collection methods were not reported.
Conclusions
Many ‘healthy’ food pricing surveys have been conducted in Australia. However, assessment methods vary across all metrics and most do not fully align with the recommendations of the current ADG. None have been applied nationally. Survey results are not comparable due to differences in the tools, protocols and methods and there is a need for a standardised national approach. Assessment of the price, price differential and affordability of a healthy diet (recommended) and current (unhealthy) diets would provide more robust and meaningful data to inform health and fiscal policy in Australia. The INFORMAS ‘optimal’ approach provides a potential framework for development of these methods.
Acknowledgements
Financial support: No financial support from any funding agency in the public, commercial or not-for-profit sector was provided for the systematic literature review. Financial support to ensure successful publication of the manuscript and to present findings at the national Healthy Diets ASAP stakeholder meeting in February 2016 was provided by The Australian Prevention Partnership Centre through the National Health Medical Research Council partnership centre grant scheme (grant number GNT9100001) with the Australian Government Department of Health, NSW Ministry of Health, ACT Health, HCF, and the HCF Research Foundation. The Australian Prevention Partnership Centre had no role in the design, analysis or writing of this manuscript. Conflict of interest: None. Authorship: Both authors jointly formulated the research question and designed the study. M.L. undertook the literature search and analysis and drafted the manuscript with supervision provided by A.L. Ethics of human subject participation: The QUT University Human Research Ethics Committee assessed this research as meeting the conditions for exemption from Human Research Ethics Committee review and approval in accordance with section 5.1.22 of the National Statement on Ethical Conduct in Human Research (2007; exemption number 1500000435).
Supplementary Material
To view supplementary material for this article, please visit http://dx.doi.org/10.1017/S1368980016002160


