


Rising incomes and urbanisation lead to global dietary changes. Traditional diets are replaced by diets higher in energy, refined sugars, saturated fats and meats. Such dietary changes can increase the incidence of chronic diseases (e.g. type II diabetes and CHD)(Reference Tilman, Yang and Chen1). Replacing the current diets with healthier alternatives will have substantial public health and probably also environmental benefits(Reference Green, Milner and Dangour2,Reference Springmann, Godfray and Rayner3) .
Designing healthier diets is a rather complex process. The variety and adequacy of nutrient intake of the various subgroups of the population must be taken into account while considering dietary preferences of individuals.
Diet models have been developed to deal with the complexity of designing such alternative, healthier diets(Reference Buttriss, Briend and Darmon4–Reference Ribal, Fenollosa and Garca-Segovia6). These models are used to determine the optimal quantities of available food items that should be included in a diet of an individual to optimise specific criteria (e.g. improve healthiness or minimise cost) under specific nutritional and acceptability constraints(Reference Buttriss, Briend and Darmon4–Reference Ribal, Fenollosa and Garca-Segovia6).
Combining quantities of different food items to optimise a specific objective accounting only for nutritional constraints can result in optimal diets that are far from what people actually eat. Probably, such diets will not be accepted by individuals, which makes them less relevant. For that reason, in diet models, acceptability constraints and minimisation of the deviation from observed diets (at population, sub-population or individual level) are used to improve the acceptance of optimised diets(Reference Gazan, Brouzes and Vieux7). Acceptability constraints have the form of upper and lower limits to the intake of specific food items(Reference Gerdessen and de Vries5,Reference Gazan, Brouzes and Vieux7,Reference Maillot, Vieux and Amiot8) and penalties for deviations from current energy intake and serving size(Reference Mertens, van’t Veer and Hiddink9). Defining acceptability constraints is a challenging process that often involves expert knowledge and a substantial degree of subjectivity. Similarly, minimising deviation of the calculated diet from an observed diet involves the implicit assumption that food items which are not consumed currently are also not preferred.
In the current study, to avoid defining such acceptability constraints explicitly and imposing additional implicit assumptions, instead of trying to compose new diets from available food items, we look within the existing diets of a certain population and identify the most healthy ones. These current ‘healthier’ diets are used as benchmark for the diets of other individuals in the population with less healthy diets. Benchmarking current diets instead of composing new diets from existing food items is definitely a novel viewpoint in diet modelling that can result in calculated diets that are not only healthier but also acceptable alternatives for the population under study.
A commonly used benchmarking technique in operations research literature is data envelopment analysis (DEA)(Reference Cooper, Seiford and Kaoru10). DEA has been used in many fields like banking, health care, agricultural economics, transportation and education(Reference Zhou, Yang and Chen11–Reference Chilingerian and David Sherman15). In general, the aim of DEA is to identify decision-making units that convert inputs (i.e. less-is-better criteria) into outputs (i.e. more-is-better criteria) in the most efficient way. Within the DEA context, the diet of an individual is seen as a decision-making unit that can be evaluated based on the intake of multiple less-is-better ‘unhealthy’ nutrients and more-is-better ‘healthy’ nutrients. Despite the broad variety of applications of DEA, it has not been used to benchmark healthier diets.
The objective of this research is to propose a DEA-based framework that can be used to benchmark current diets based on their nutrient intakes and to provide guidelines for improving less healthy diets in a way that is acceptable by the studied population.
Methods
In this section, first we present the main structure of existing diet models and we discuss important limitations and challenges. We use an illustrative example to present DEA as a novel approach for benchmarking and re-designing healthier diets. Finally, we use this simple example to propose a mathematical programming model that enables to account for acceptability considerations in diet modelling.
Diet models for designing healthier diets
Existing diet models are often mathematical programming models that aim to compose an alternative optimal diet for a specific individual or group of individuals(Reference Mertens, van’t Veer and Hiddink9). A schematic representation of a mathematical programming model that focuses on optimising diets is presented in Fig. 1a.
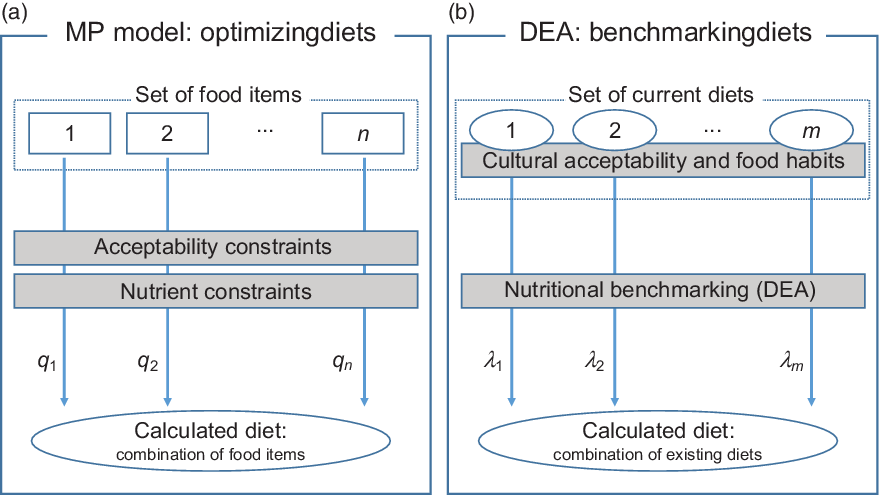
Fig. 1 Schematic representation of the differences between current mathematical programming (MP) diet models, which focus on optimising diets by deciding on optimal intakes of available food items, and the proposed benchmarking approach, which focuses on identifying efficient current diets and combines them to healthier alternatives
The main components of mathematical programming diet models are (i) the decision variables ( $\({q_i}\;\forall \;i\; \in \;\left( {1 \ldots n} \right)\)$) which are the quantities of available food items i that should be included in the calculated diet in order to achieve a specific objective, (ii) the objective function which is an indicator to be optimised expressed as a function of the decision variables (e.g. the objective function could be the minimisation of the cost or the CO2 emissions of the diet; or even the minimisation of the differences between food intakes of an observed and a calculated diet), (iii) the nutritional constraints that are used to either impose the dietary guidelines to the calculated diet (through hard constraints) or to calculate deviations between nutrient (and food) intakes of the calculated diet and the dietary guidelines through soft constraints (i.e. constraints that can be violated but violation of these constraints is associated with a penalty in the objective function which is minimised) and (iv) the acceptability constraints which aim to facilitate acceptance of the diet by imposing restrictions on food item quantities following current consumption patterns. Without acceptability constraints, the calculated diet might comprise of food items that do not necessarily form a realistic diet.
Defining acceptability constraints is often based on expert knowledge and information on current meals. This restricts the set of feasible diets in an arbitrary and subjective way which introduces an important level of bias to the optimal food item intakes of the calculated diet.
To avoid formulating explicit acceptability constraints and imposing the current diet as a reference, we propose an alternative diet optimisation method based on nutritional benchmarking. Nutritional benchmarking is defined as the comparison of diets based on their nutrient (and/or food item) intakes. The objective is to identify for each individual that belongs to the same population group combinations of current diets that are healthier or at least as healthy as the current diet. The proposed method is summarised in Fig. 1b. Because the new calculated diet is a combination of other current diets, acceptability considerations are taken into account implicitly. The resulting diet is not a mix of individual food items but a mix of food items that either have been chosen together in meals or have been declared in dietary surveys by individuals in the sample. The diets that are used to compose all diets of the population under study are identified based on nutritional benchmarking and DEA(Reference Cooper, Seiford and Kaoru10).
DEA with a simple example
This section illustrates the basic concepts of DEA based on a simple two-dimensional example. DEA aims to compare decision-making units based on their capacity to convert multiple inputs into multiple outputs(Reference Cooper, Seiford and Kaoru10). In the specific case of a diet problem, the decision-making units are individual diets and outputs are the more-is-better nutrients like vitamins, fibre and protein, while inputs are the less-is-better nutrients like saturated fat and Na. The objective is to identify those diets that have a higher ratio of more-is-better nutrients content per unit of less-is-better nutrient.
To demonstrate the method graphically, we assume that diets are evaluated based only on two nutrients that is, dietary fibre (as the more-is-better nutrient) and Na (as the less-is-better nutrient). Figure 2 involves six individual diets with the same energy intakes labelled with letters (A, B, C, D, E and F) and their performance with respect to dietary fibre and Na content (e.g. diet C contains 60 units of dietary fibre and 20 units of Na).
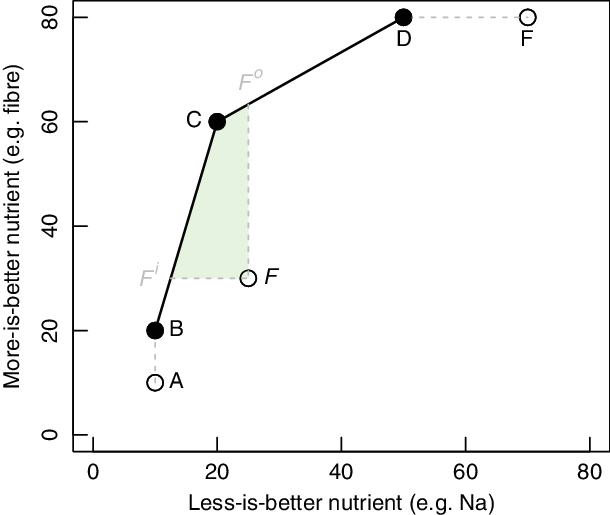
Fig. 2 A two-dimensional illustrative example of data envelopment analysis for benchmarking diets
DEA aims to compare each diet with all other diets in the sample and identify those that are efficient that is, those diets that for a certain level of less-is-better nutrients contain the highest (compared to all others) level of more-is-better nutrients or those that for a certain level of more-is-better nutrients contain the lowest level of less-is-better nutrients. From Fig. 2, it is visible that diets B, C and D are DEA-efficient because for their intake of Na there is no linear combination of all other diets with higher or the same intake of fibre. The line segments BC and CD are called the DEA-efficient frontier. The DEA model assigns to DEA-efficient diets an efficiency score of 1. It is assumed that all other (inefficient) diets can be projected to the efficient frontier and either increase more-is-better nutrients for the same amount of less-is-better nutrients, that is, output-oriented DEA model (OO DEA) or decrease the amount of less-is-better nutrients for the same level of more-is-better nutrients, that is, input-oriented DEA model (IO DEA). All inefficient diets (i.e. diets A, E and F) receive an efficiency score of < 1. The efficiency score can be interpreted as the distance to the efficient frontier. The lower the efficiency score of a certain diet, the larger the distance of the diet to the efficient frontier.
In our illustrative example of Fig. 2, diet A is not efficient because it can be replaced by diet B which has the same Na content but higher dietary fibre content. Diet E is inefficient because it can be replaced by diet D which has a lower Na content for the same dietary fibre content. Finally, diet F is inefficient because by combining diet B and C we create a new diet on the efficient frontier that is, diet F i that has the same dietary fibre level for substantially less Na (IO DEA model). In the IO DEA model, diets B and C are called the peers of diet F. Similarly, diet F can be replaced by diet F o and increase level of dietary fibre for the same level of fat (OO DEA model). In the OO DEA model, the peers of diet F are diets C and D.
In practice, the healthiness of a diet is determined by more than one more-is-better nutrient and more than one less-is-better nutrient, which makes an informative graphical representation of the problem impossible. To deal with the multi-dimensionality of the problem and benchmark current diets, we solve a sequence of linear programming models, that is, the IO DEA and the OO DEA models presented in online Appendix A. The decision variables of the DEA models are the proportion of each diet of the sample in the calculated diet, and the objective function is an efficiency score that represents the distance of the evaluated diet from the efficient frontier. The orientation of the DEA model (IO DEA or OO DEA) determines the direction of measuring the distance to the efficient frontier. The result of the optimisation is a set of healthier diets which are combinations of other diets that belong to the same group. This enables to account for acceptability of the diets without imposing additional acceptability constraints or minimising the deviation from the observed diet. In the next step, we identify the healthier diet that minimises the deviation from the current food item intakes.
Minimising deviation from current food intake (MINDV model)
The IO DEA and OO DEA models identify the subset of diets that are DEA-efficient. For each inefficient diet, an alternative healthier diet is calculated as a linear combination of its peers. The new ‘efficient’ and healthier alternative is identified by minimising the distance to the DEA-efficient frontier. For example, for diet F, a new diet F i is calculated that is healthier (less Na for the same dietary fibre level). However, the new healthier diet (F i) might include food items completely different than the current diet. Using DEA to compare and benchmark diets that belong to the same subgroup (i.e. comparison between similar peers) can reduce this problem.
Actually, all linear combinations of the efficient diets within the shaded area F iFF oC of Fig. 2 are healthier alternatives of the current diet F because they contain less Na and more dietary fibre than the current diet F. In line with existing diet optimisation models(Reference Gazan, Brouzes and Vieux7), we assume that the willingness of an individual to accept an alternative healthier diet increases with the resemblance (in terms of food item intakes) of this alternative healthier diet with the current diet of this individual. Therefore, within the set of healthier diets of the shaded area F iFF oC, we search for the diet that is most similar to the current diet in terms of food item intakes.
For this reason, we propose minimum deviation (MINDV) model, which combines the efficient diets, identified with the DEA models and calculate for each individual an alternative healthier diet which resembles as much as possible, in terms of food item intakes, the current diet. It is important to emphasise that similar to the DEA models the MINDV model combines existing diets instead of individual food items (current practice in diet optimisation). Because of this, the calculated diets are as close as possible to the current diet, but they also comprise of food item intakes in proportions that match current diets of individuals within the same group. To achieve this, we minimise the total absolute deviation between the food item intakes of the healthier alternative diet and the food item intakes of the current diet. We make sure that, compared to the current diet, the healthier alternative diets have lower or equal intakes of less-is-better nutrient and more or equal intakes of more-is-better nutrients. The mathematical formulation of the MINDV model is presented in online Appendix B.
Case study: designing alternative healthier diets in The Netherlands
To demonstrate how DEA can be used to benchmark diets and calculate alternative healthier diets, we used data from the Nutrition Questionnaires plus dataset of habitual diets of a general population of adult men and women in The Netherlands(Reference Brouwer-Brolsma, van Lee and Streppel16). Habitual diet was assessed by means of a FFQ from which the intake of foods and nutrients was calculated.
To make diets comparable, we defined six groups of individuals: (F1) females 20–40 years of age (n 206), (F2) females 41–50 years of age (n 203), (F3) females > 50 years of age (n 425), (M1) males 20–40 years of age (n 121), (M2) males 41–50 years of age (n 155) and (M3) males > 50 years of age (n 625).
The nutrient and food intakes of the diets are standardised to a diet of 8368 kJ (i.e. 2000 kcal). For example to normalise the nutrient and food intakes of a diet of 12 552 kJ (i.e. 3000 kcal), we multiplied average nutrient and food intakes of this diet with a factor of  ${2}\over{3}$. In the current study, for assessing the healthiness of a diet, we used the nine encouraged and the three discouraged nutrients used to calculate the Nutrient Rich Diet (9.3) index(Reference Drewnowski17,Reference Fulgoni, Keast and Drewnowski18) . The nine more-is-better nutrients are protein, fibre, Ca, Fe, Mg, K and vitamins A, D and E. The three less-is-better nutrients are Na, saturated fat and added sugars. Na intake was estimated from foods only, ignoring discretionary salt use during cooking and dining.
We defined sufficient levels of intake for all nutrients included in Nutrient Rich Diet 9.3 based on dietary reference intakes for Europe(19) and the USA(20). The sufficient levels for more-is-better nutrients that we chose to use in our model would be adequate to meet the nutrient requirements of 97·5 % of adult individuals in the population. The sufficient daily intake of protein was assumed to be 75 g, of Ca 1200 mg, of Fe 18 g, of Mg 420 mg, of K 4700 mg, of vitamin A 750 retinol equivalents (RE), of vitamin C 110 mg and of vitamin E 15 mg. We considered that increasing intakes above that sufficient level is of less importance, and thus improving the intakes of the other nutrients becomes a priority. Therefore, we capped nutrients at the sufficient intake level in the DEA model. However, we did not cap the intakes of dietary fibre assuming that more is better. For less-is-better nutrients, the lowest possible intake level was considered desirable. The mean and sd of nutrient intakes of selected nutrients, per group of individuals, are presented in Table 1.
Table 1 Used Nutrition Questionnaires plus variables per gender-age group of individuals
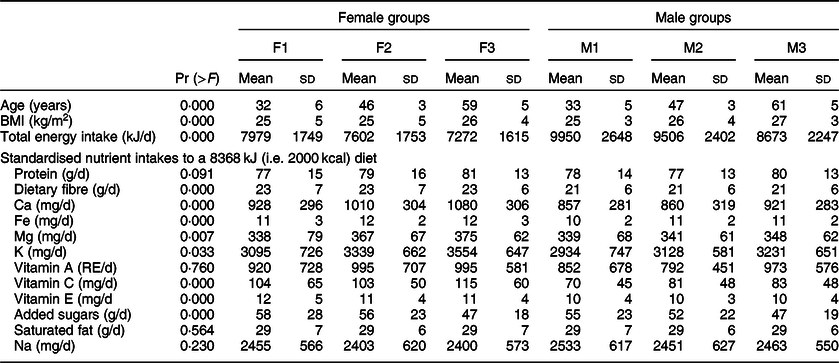
The P values of pairwise t test comparisons between the groups of individuals are presented in online Appendix C.
DEA was used to benchmark diets that belong to the same of the six consumer groups, that is, we only compared diets that belong to the same consumer group. We used both the IO DEA and the OO DEA models to identify the efficient diets. The MINDV model was used to combine DEA-efficient diets and compose for each current diet a new alternative diet that is healthier than the current diet but at the same time as similar as possible to the food group item (based on the Dutch food composition table(21)) intakes, expressed in percentage of the diet’s mass of the current diet.
Furthermore, to quantify the importance of DEA-efficient diets, we calculated the frequency that each DEA-efficient diet is used as peer of inefficient diets using the following equation (1):
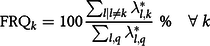 $${\rm{FR}}{{\rm{Q}}_k} = 100{{{\mathop \sum \nolimits_{l|l \ne k} \lambda _{l,k}^*}}\over{{\mathop \sum \nolimits_{l,q} \lambda _{l,q}^*}}}\;\% \quad\forall \;k $$
where FRQk is the frequency (%) of the efficient diet k as a peer, and  $\lambda _{l,k}^*$ is the weight (value from 0 to 1) of diet k in the efficient alternative of diet l.
Results
In this section, we present the results and main outputs of the proposed DEA-based framework which was applied on the Nutrition Questionnaires plus dataset(Reference Brouwer-Brolsma, van Lee and Streppel16). The variables of the Nutrition Questionnaires plus dataset which are used in the current study are summarised in Table 1.
We present the potential improvements on the nutrient intakes of the diets calculated with the three different models, and we present the corresponding changes in terms of food item intakes. We analyse the peers, which are the DEA-efficient diets that have been combined to design alternative healthier diets.
The potential to decrease less-is-better nutrients or increase more-is-better nutrients by replacing current diets with healthier alternatives as calculated by the IO DEA, OO DEA and MINDV models is presented in Fig. 3.
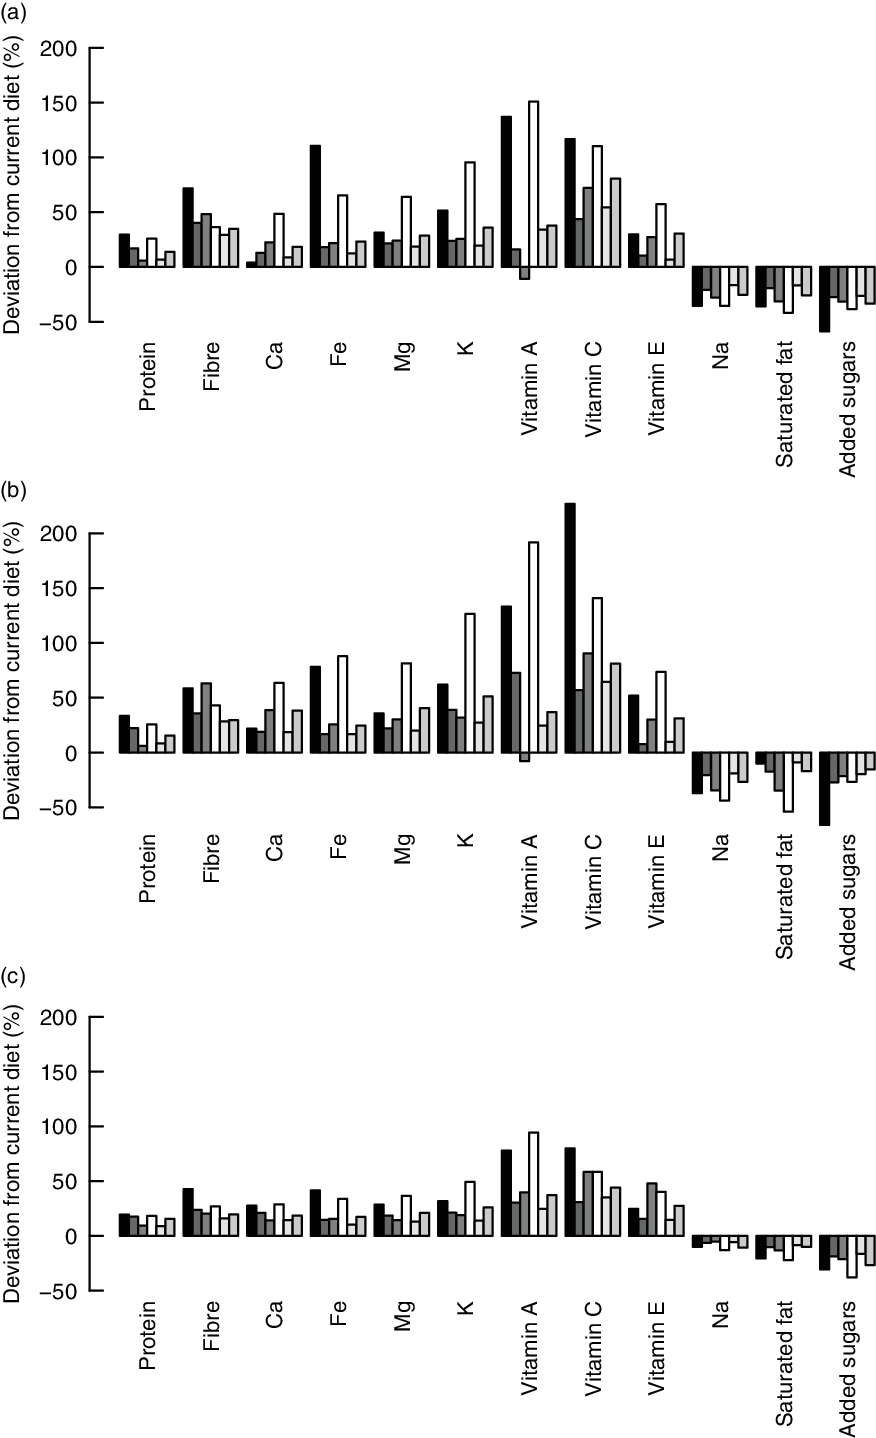
Fig. 3 Difference between efficient and observed nutrient intakes as calculated with the (a) input-oriented data envelopment analysis (DEA), (b) output-oriented DEA and (c) MINDV models. ![]() , F1;
, F1; ![]() , F2;
, F2; ![]() , F3;
, F3; ![]() , M1;
, M1; ![]() , M2;
, M2; ![]() , M3
, M3
The alternative diets calculated by the different models result in substantial improvements. All models resulted in alternative diets with lower levels of less-is-better nutrients and higher levels of more-is-better nutrients for all six consumer groups. Exception is the intake of vitamin A in the alternative diets of older females (group F3) which decreases marginally. The reason for this decrease is related to the capping of the intakes of more-is-better nutrients to their optimal levels and the high intakes of vitamin A in current diets. The vitamin A intake of the alternative healthier diets exceeds the optimal level (i.e. intake used for capping) of vitamin A, but it is, on average, lower than the intakes of the current diets.
As expected, the MINDV model results in the smallest improvements. The MINDV model aims to calculate diets that are as close as possible to current diets as long as they have at least the same level of more-is-better nutrients and at most the same level of less-is-better nutrients with the current diet. The results of all models show that the largest improvement can be achieved in diets of younger females and males (i.e. group of individuals F1 and M1).
To assess the nutrient adequacy of the calculated diets, we calculated the deviations of important nutrient intakes from dietary recommendations. All three models resulted in calculated improved diets with intakes of protein, vitamin A and vitamin C much higher than the intake which is considered adequate to meet the nutrient requirements of 97·5 % of adult individuals in the population (Fig. 4). The calculated diets, even though they comprise higher intakes of Fe than the observed diets, do not reach the dietary-specific requirements of Fe (Fig. 4). For some groups, the intakes of vitamin E, K and Ca are higher than the observed diets but still below the recommendations.
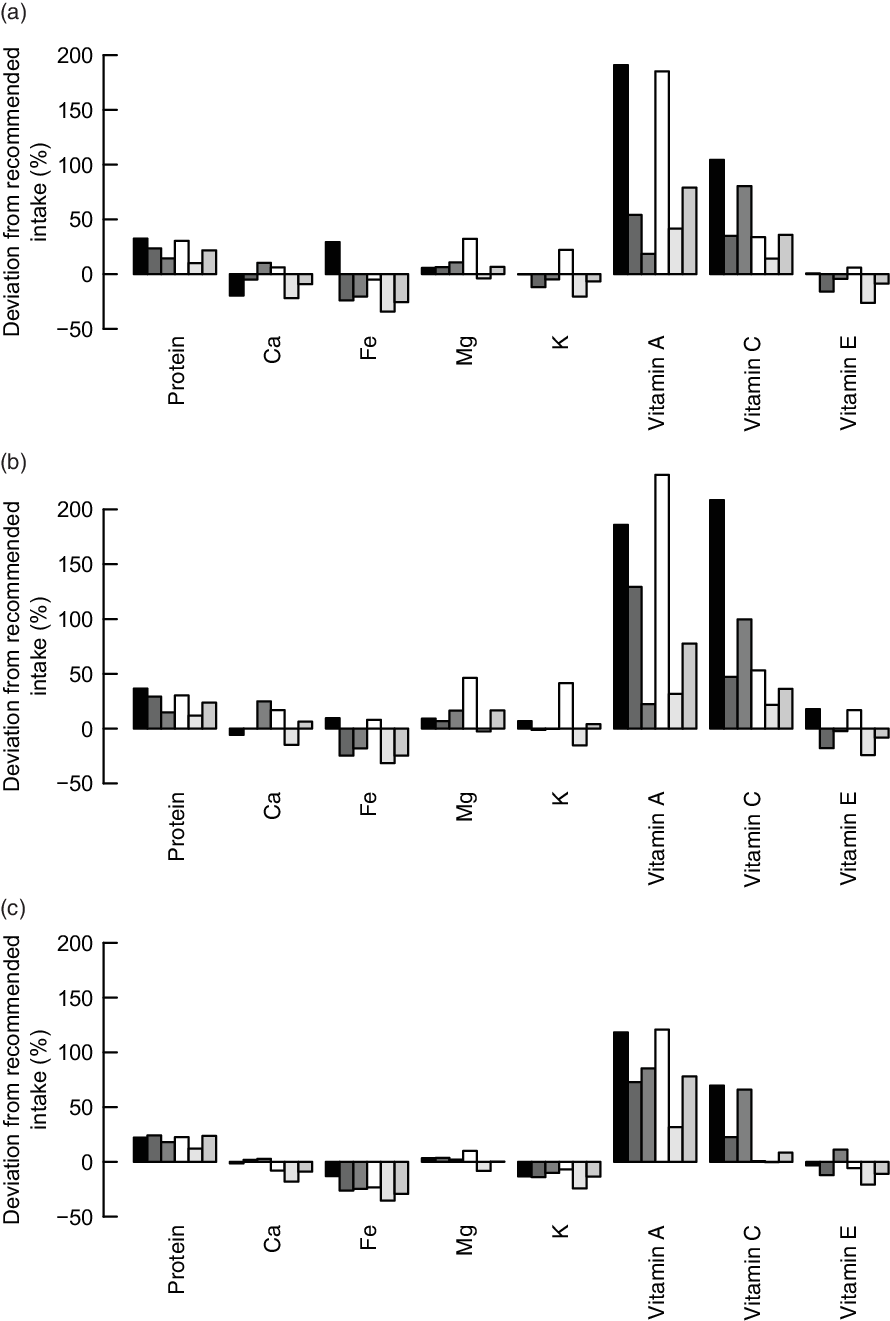
Fig. 4 Difference between the dietary nutrient requirements of 97·5 % of adult individuals in the population and the calculated improved nutrient intakes with the (a) input-oriented data envelopment analysis (DEA), (b) output-oriented DEA and (c) MINDV models. ![]() , F1;
, F1; ![]() , F2;
, F2; ![]() , F3;
, F3; ![]() , M1;
, M1; ![]() , M2;
, M2; ![]() , M3
, M3
The proposed alternative healthier diets can be further analysed to the level of intakes of specific food items. The food group item intake expressed as a percentage of the total intake (in g) of the observed diets, and the diets calculated with the IO DEA, OO DEA and MINDV models are presented in Fig. 5. We present result as a percentage of the total intake to enable for comparisons of the changes between the food items. The mass of the calculated diets might be different than the observed diets, but the energy intake of the diets is constant and equal to 8368 kJ (i.e. 2000 kcal).
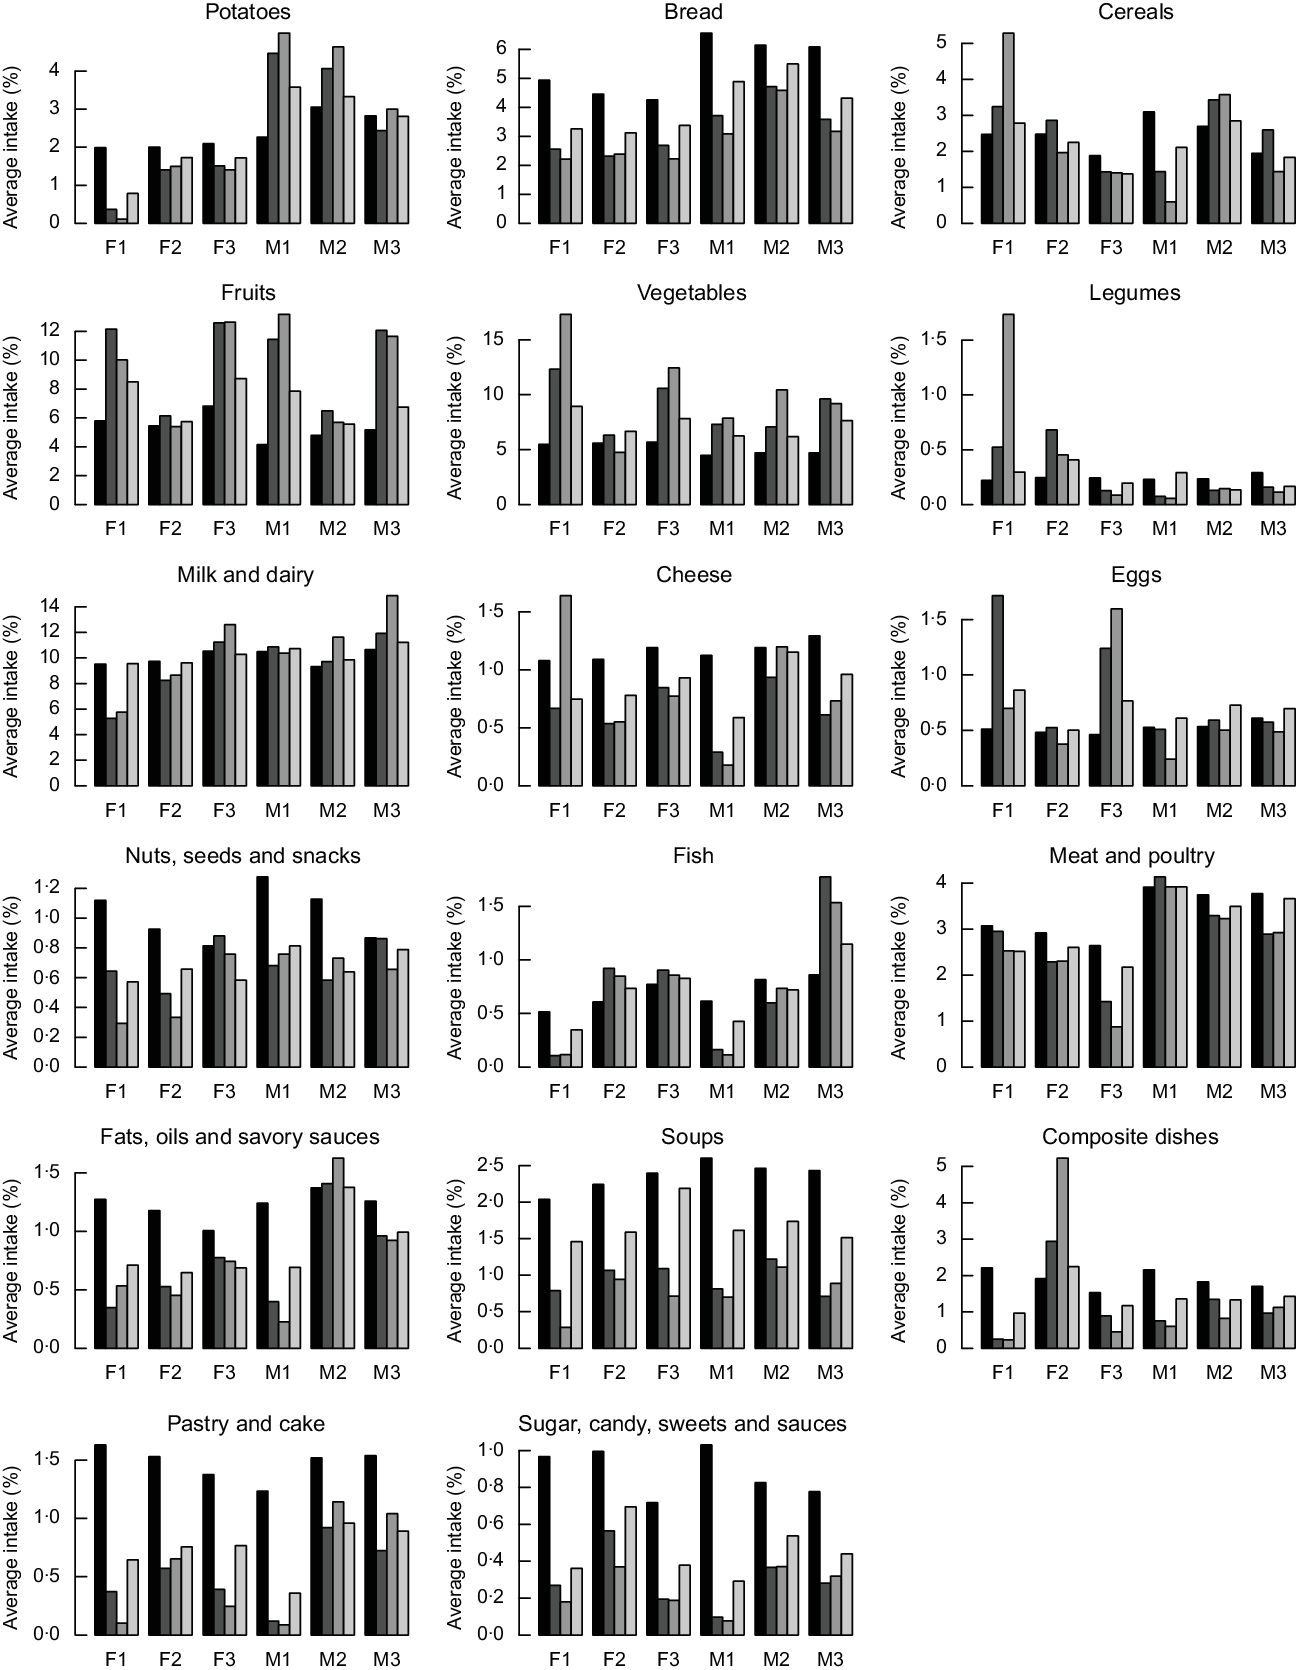
Fig. 5 Average daily intakes of important food groups (expressed in percentage of total weight of the diet) in the current (![]() ) and the calculated diets with the input-oriented data envelopment analysis (DEA) (
) and the calculated diets with the input-oriented data envelopment analysis (DEA) (![]() ), output-oriented DEA (
), output-oriented DEA (![]() ) and MINDV (
) and MINDV (![]() ) models
) models
In general, compared to the current diets, the alternative healthier diets calculated with the three models contain higher intakes of fruits and vegetables. Calculated healthier diets of younger males contain higher intakes of potatoes, milk and dairy, while healthier diets of females include lower intakes of potatoes and higher intakes of eggs. The quantities of fish increase in the improved diets of all groups except from those of younger males and females. This is because of the lower quantities of fish in current diets of younger individuals and different types of dishes. As expected, the most similar to the current diets in terms of food group item intakes are the diets calculated with the MINDV model.
Healthier diets also contain lower intakes of bread; nuts and snacks; fats and oils; soups, pastry and cakes; and sugar/sweets. Decrease of intakes of bread and the nuts, seed and snacks groups is not in line with existing dietary guidelines that recommend the increase of nuts, seeds and whole wheat bread. To investigate this contradiction between model’s results and dietary recommendations, we investigated the diet composition of the nuts, seed and snacks group. Figures 6 and 7 represent the average food item intake of the nuts, seeds and snacks food item group for females and males, respectively. In general and in line with the current dietary recommendations calculated, diets recommend decreased quantities of snacks but increased quantities of unsalted nuts and food items with high content of unsaturated (healthy) fats.
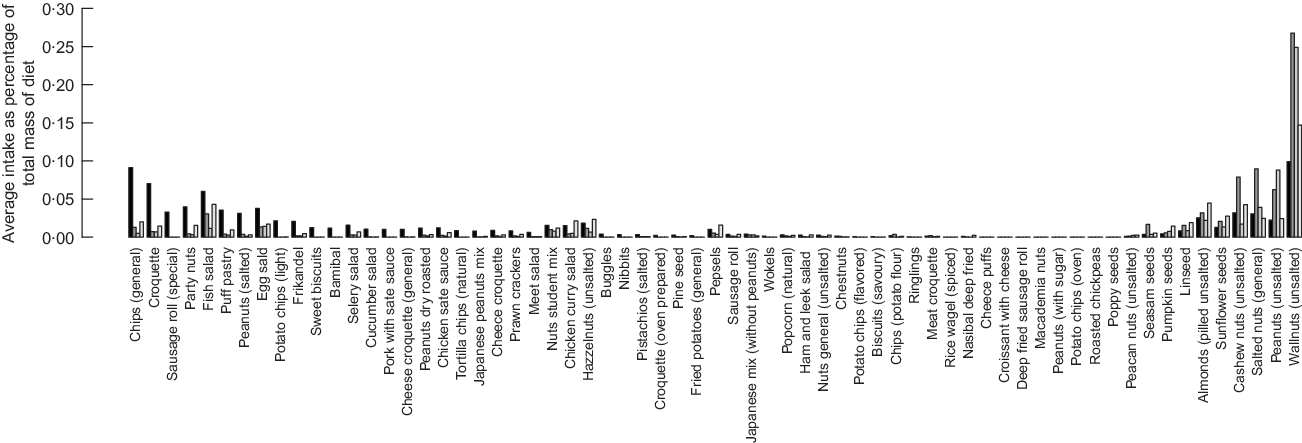
Fig. 6 Detailed average intake of food items that belong to the nuts, seeds and snack group for female consumer of the dataset. ![]() , Current diet;
, Current diet; ![]() , diet calculated with input-oriented data envelopment analysis (DEA) model;
, diet calculated with input-oriented data envelopment analysis (DEA) model; ![]() , diet calculated with output-oriented DEA model;
, diet calculated with output-oriented DEA model; ![]() , diet calculated with MINDV model
, diet calculated with MINDV model

Fig. 7 Detailed average intake of food items that belong to the nuts, seeds and snack group for male consumer of the dataset. ![]() , Current diet;
, Current diet; ![]() , diet calculated with input-oriented data envelopment analysis (DEA) model;
, diet calculated with input-oriented data envelopment analysis (DEA) model; ![]() , diet calculated with output-oriented DEA model;
, diet calculated with output-oriented DEA model; ![]() , diet calculated with MINDV model
, diet calculated with MINDV model
Identifying alternative diets that are important for improving the current diets of the population as a whole can provide valuable information to researchers and policy makers for designing healthier diets. To quantify the importance of an efficient diet, we used as indicator the frequency of this diet as a peer for other inefficient diets (Fig. 8). Benchmarked diets with higher frequency scores (calculated according to eq. 1) can provide guidelines for defining nutritional and policy goals.
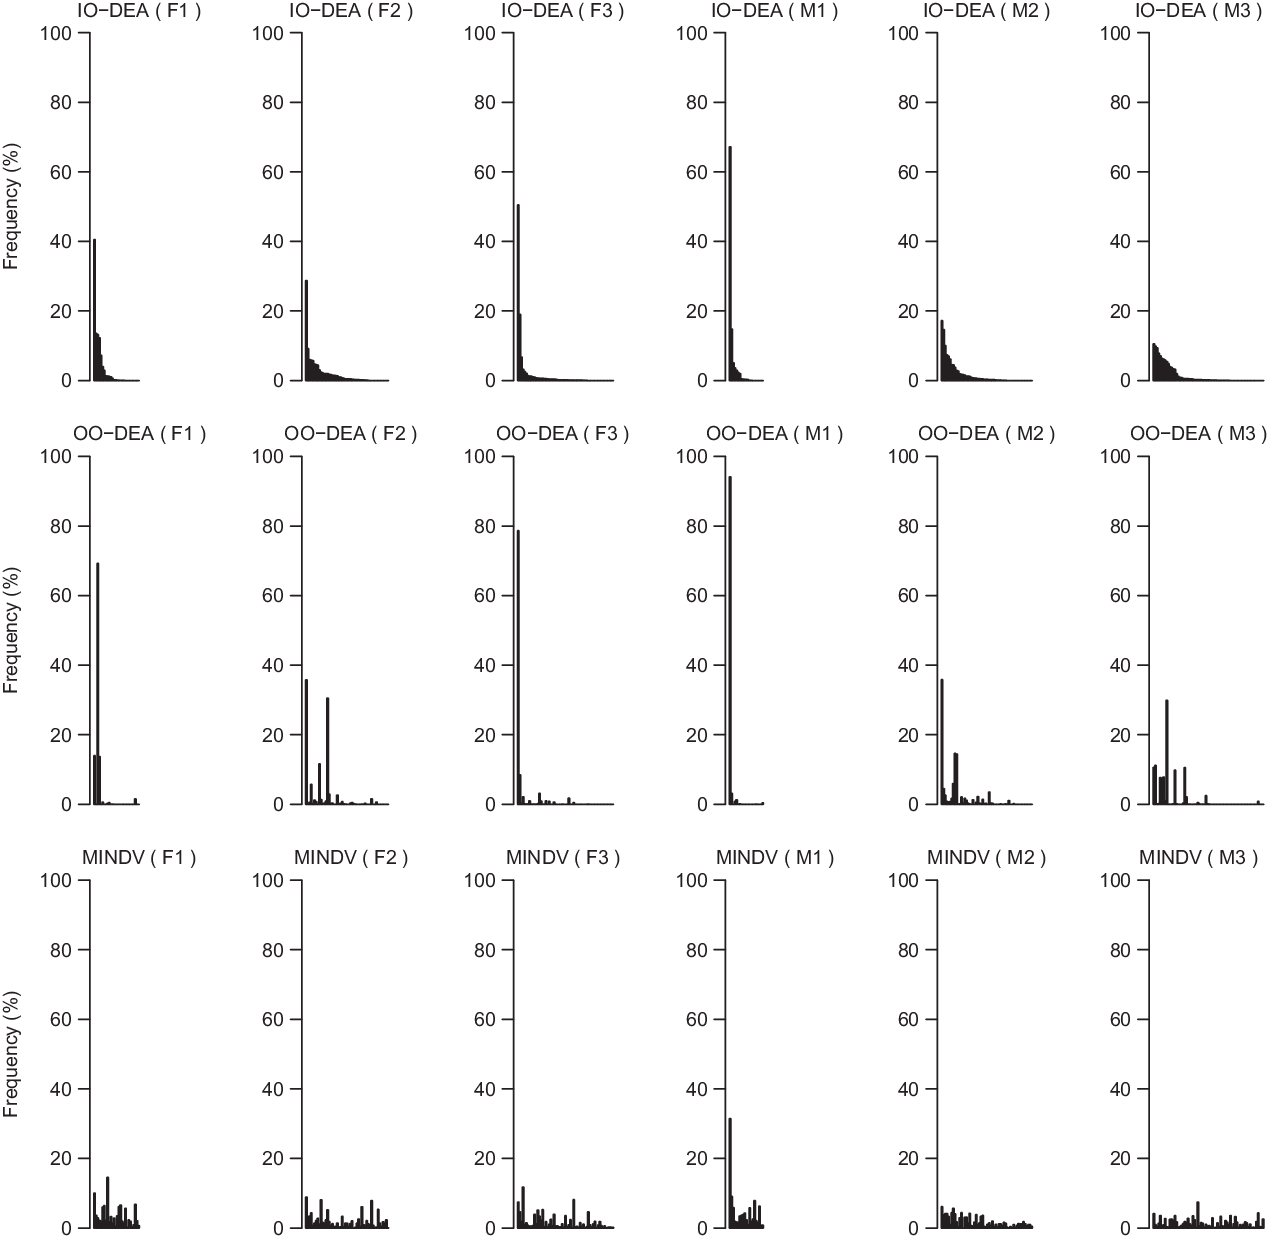
Fig. 8 Frequency of efficient diets (i.e. peers) as calculated by eq. 1 for different groups of individuals and model (i.e. input-oriented data envelopment analysis (IO DEA), output-oriented DEA and MINDV). To allow comparison between models, the peers have been shorted based on their frequency score in the IO DEA model
The highest frequency score (calculated according to eq. 1) in all three models is achieved by the most frequent peer of the M1 group. The food group intakes of this diet are presented in Fig. 9. This diet comprises larger shares of fruits and vegetables and lower intakes of meat, dairy products and bread compared to the average diet of the same consumer group.
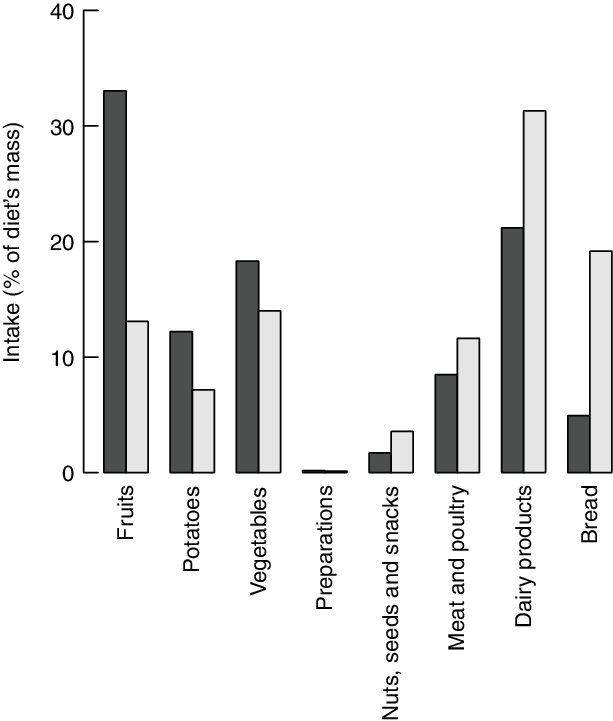
Fig. 9 Food group item intakes (percentage of total diet’s weight) of the diet that is used most frequently as peer of inefficient diets (i.e. the most frequent peer of group M1). ![]() , Frequent peer;
, Frequent peer; ![]() , average of group
, average of group
Discussion and concluding remarks
The proposed DEA-based algorithm enables the identification of existing healthier diets and provides a framework for quantification of potential improvement of the current diets. The advantage of the method, compared to existing diet models, is that the calculated diets are combinations of actual diets of peers. Because of this, the calculated diets are closer to the actual diets of the individuals that belong to the same group without the need to specify explicitly acceptability or other meal-related constraints.
Only as a next step, we demonstrated how the MINDV model can be used to identify for each current diet a healthier alternative diet that is as close as possible to the food item intakes of the current diet. In contrast to other diet optimisation models(Reference Gazan, Brouzes and Vieux7) that also minimise deviations between the food item intakes of the calculated and the observed diet, the MINDV model combines whole DEA-efficient diets instead of individual food items. The main decision variable of the MINDV model is the weight of a DEA-efficient diet in the calculated diet. This ensures that the proportions of food item intakes of the calculated diet are observed in the diets of others in the same group. In existing diet optimisation models that also minimise deviations between the food item intakes of the calculated and observed diets, the decision variables are the intakes of available food items. This implies that the food item intakes can be chosen in any proportion. In most cases where the current diet does not meet specific nutrient requirements (or for any reason the current diet cannot be reproduced), then the quantities of food items in the calculated diet are deviating from the current diet. In these cases, the calculated diet will not comprise necessarily of food items in proportions of actual diets unless acceptability constraints are added explicitly. The proposed DEA-based approach that we present in this manuscript extracts these constraints from the diets of (other) individuals that belong to the same group in an objective, transparent and reproducible way, which is a clear added value of the proposed method.
Similar to the combination of DEA-efficient diets calculated with the MINDV model, other combinations of the DEA-efficient diets can be used to identify healthier alternative diets that, instead of maximising acceptance, maximise environmental performance or minimise total cost. The resulting diets which maximise the environmental performance or minimise the cost of the diet will be also combinations of DEA-efficient diets and not combinations of unrelated available food items. Consequently, they will reflect the current cultural food habits and preferences. Because of these, the proposed method is an advanced decision support tool that can be used to address questions related to the quest for designing sustainable, healthy affordable and reliable diets(Reference Mertens, van’t Veer and Hiddink9).
As mentioned, the proposed diet modelling approach calculates diets as linear combinations of other observed diets. As a result, if the method is applied in datasets where unhealthy diets dominate, the calculated diets will be nutritionally improved but not necessarily nutritionally adequate (i.e. meeting all nutrient requirements). This was also shown by our case study for some nutrients (e.g. Fe) and groups of individuals. Of course, if nutritionally adequate diets are observed within the sample of benchmarked diets, these diets will become peers of other less healthy diets and the calculated diets will be also adequate from a nutritional point of view. Applying this method continuously over time can result gradually to diets that meetall dietary requirements. This is different than current diet optimisation models, where often nutritional adequacy of the calculated diets can be imposed by using hard constraints. With these models, a target diet is calculated, but it remains a question if such calculated nutritionally adequate diets will be acceptable by a population where such diets have not been chosen.
The proposed DEA-based approach can also be used to evaluate scenarios in future studies. Addressing what-if questions related to changes in prices or technologies or policies would be quite straightforward. New combinations of the benchmarked diets will be calculated for different scenarios. For example, a price change scenario of one or more food items can be evaluated by comparing the calculated diet for the current and future sets of prices. Assessing scenarios that involve new food items or diets will require to pre-design diets with different levels of the evaluated food items. The ‘healthiness’ of these hypothetical diets can then be evaluated using the proposed DEA-based approach.
The proposed method can exploit efficiently existing empirical datasets of the average nutrient intakes of individuals. It results in calculated diets that are linear combinations of other existing healthier diets. This can improve the potential for acceptance. In the case study presented in this manuscript, we aim mainly to demonstrate the proposed method, and for that reason we chose age and gender as the main grouping variables of the population. It has been shown that socio-economic factors such as age and gender explain food intakes of populations across Europe(Reference Mertens, Kuijsten and Dofkova22). Moreover, such grouping resulted in adequate numbers of observations in all groups. Adding additional grouping variables like socio-economic status and physical activity will result in quite homogeneous groups. The calculated diets with the proposed DEA method will still include higher intakes of more-is-better nutrients and lower intakes of less-is-better nutrients than the current diets, and they will have a fair chance of adoption. However, the improvement of the calculated diets will be more modest (not enough variation and space to optimise) compared to the current application of the model. Moreover, larger datasets would be required to ensure enough observations per group. On the contrary, applying the DEA method to the whole population (i.e. no sub-grouping) will result in much larger improvements, but the improved diets will be the result of combining diets from different age/gender groups which might decrease the acceptance rate. Because of this trade-off between magnitude of improvement and homogeneity of the groups, the choice of grouping variables should be research question and case specific. Sensitivity analysis on the impact of grouping variables can provide interesting quantitative evidence about the importance of certain grouping variables to the potential improvements.
The nutrients and food items that should be included in the evaluation of the quality of a diet are an open debate in the field of health and nutrition. The focus of this manuscript is to propose a new concept for diet modelling based on benchmarking of existing diets instead of composing diets from available food items. To avoid entering the discussion on which nutrients must be included in such a model, we decided to use the nutrients included in Nutrient Rich Diet 9.3 (without additions or exclusions), which has been commonly used to evaluate quality of diets in the field of public health and nutrition(Reference Fulgoni, Keast and Drewnowski18). The set of nutrients included in the DEA models allows to tailor the results of the analysis to the specific context of the application (i.e. type of disease, geographical region, etc.). However, the proposed method and the concepts introduced in this manuscript would remain the same. Adding additional nutrients in the DEA models would result in a larger set of efficient diets and consequently less potential improvement at group level. A selection of important nutrients (instead of using all available nutrients) is required to allow for substantial level of improvement. However, similar to the rationale of selecting specific nutrients in diet quality indices (e.g. food habits, available foods and type of disease), the justification of the nutrients that are used in DEA applications should also be provided.
The main dataset used in the current study includes information from FFQ and the Dutch food composition tables. We used the Nutrition Questionnaires plus dataset(Reference Brouwer-Brolsma, van Lee and Streppel16) which is specific for The Netherlands. However, similar datasets are available in many other European Union countries(23). We do not use any additional dataset or expert knowledge to define acceptability constraints. This enables applications of the method to larger geographical scales (like the European Union) which is an important advantage of the proposed method. We clustered the individual diets in six groups, and we applied the model within each of these groups. Even though the numbers of observations per group are higher than DEA applications in other fields of science(Reference Cooper, Seiford and Kaoru10), a larger sample size per group would enable a better representation of the variability within the population. This would imply even more possibilities for improvement in the calculated diets. Moreover, additional recalls per individual would enable a better representation of current diets and would make possible the estimation of CI around the observed intakes. This would allow the application of extensions of the basic DEA models to account for uncertainty and improve the robustness of the analysis(Reference Dyson and Shale24). Such information would also be beneficial for the majority of diet optimisation models which are currently by nature deterministic.
An important underlying assumption of DEA models is that data should be positive numbers. In the context of diet modelling, this will imply that diets with 0 intake of certain nutrients cannot be evaluated. This was not a problem in our dataset, but in case where some diets have zero intake of certain nutrient, data transformations can be applied(Reference Sarkis25,Reference Cook and Seiford26) .
In the current study, we capped the intakes of more-is-better nutrients to their sufficient level to account for an upper bound on the comparisons between diets. By capping, we impose that increasing nutrient intakes above the sufficient levels (i.e. RDAs) is of less importance than increasing the intake of the nutrients that are not yet at their RDA levels. This approach is valid for cases where intake above a certain level is not necessarily better but it is also not harmful. In cases where higher intakes would be harmful, existing extensions of the basic DEA models should be used(Reference Chen, Cook and Du27).
The outputs of the models provide specific guidelines for the appropriate food item intake that will result in a healthier alternative diet. At the same time, acceptance (or environmental or economic) considerations can be taken into account by identifying combinations of existing healthier diets that optimise specific indicators (e.g. deviation from the current diet). Such quantitative analysis can be used to evaluate ex-ante environmental and nutrition/public health-related policies at population or even higher (e.g. European Union) level.
Acknowledgements
Financial support: Financial support for this study was obtained from funding from the European Union’s H2020 Programme under Grant Agreement number 633692 (SUStainable Food And Nutrition Security (SUSFANS): Metrics, models and foresight for European sustainable food and nutrition security), from TiFN under Project Agreement number 15SD01 (SHARP-BASIC), from ZonMw under Grant Agreement number 91110030 (Nutrition Questionnaires plus study). Conflict of interest: There are no conflicts of interest. Authorship: A.K.: conception and design, develop model, analysis and interpretation of results, writing manuscript, final approval. J.C.G.: analysis and result interpretation, writing manuscript, final approval. A.I.: analysis and result interpretation, writing manuscript, final approval. J.M.G.: design research, nutritional verification of results, result interpretation, commenting/writing, final approval. J.M.B.-R.: design research, comment on model, result interpretation, commenting/writing, final approval. P.V.: design research, nutritional verification of results, result interpretation, commenting/writing, final approval. Ethics of human subject participation: None.
Supplementary material
For supplementary material accompanying this paper visit https://doi.org/10.1017/S1368980019004774.


