


The population is ageing throughout the world, especially in Western countries. By 2050, the number of older persons aged 60 years or over is expected to reach 2·1 billion(1), thus making it necessary to tailor health services to the specific characteristics and needs of the elderly population. If the increase in life expectancy is to be accompanied by good quality of life, the management of chronic diseases is insufficient; the social, economic, functional and mental problems of elderly people should also be addressed(Reference Arai, Ouchi and Yokode2). Ageing involves a greater risk of nutritional deficiency, either due to a decrease in protein and energy intake and/or a decrease in vitamins and minerals. This situation is further exacerbated by problems of tooth and taste loss. Gastrointestinal malabsorption is another factor that causes malnutrition and is sometimes accentuated due to the interaction of various drugs(Reference Eggersdorfer, Kraemer and Cordaro3). Therefore, the comprehensive care of elderly patients must also include the assessment of nutritional status, since malnutrition may lead to physical and psychological deterioration and hence a greater risk of morbidity and mortality, as well as increased health costs(Reference Camina-Martin, de Mateo-Silleras and Malafarina4).
In order to determine nutritional status in the elderly, it is necessary to perform a global assessment that includes the medical history of the patient’s eating habits, degree of autonomy to perform basic and instrumental activities of daily living, mood, cognitive status, chronic disease, pharmacological treatment and anthropometric measures(Reference Ravasco, Anderson and Mardones5). In primary health care, however, it is difficult to carry out nutritional assessments on a regular basis.
To simplify the detection of malnutrition, nutritional questionnaires are used as screening tools. The most widely used questionnaire for this population group is the Mini Nutritional Assessment (MNA), which showed a sensitivity of 96 % and a specificity of 98 %(Reference Guigoz and Vellas6,Reference Vellas, Guigoz and Garry7) in the original study. However, the MNA has recently been validated in the Spanish population(Reference Muñoz, Molina-Recio and Romero-Saldaña8) and obtained a much lower diagnostic accuracy (sensitivity 63·2 % and specificity 72·9 %) than reported in the original work. These results are consistent with those found in other MNA validation studies carried out in different countries(Reference Kuzuya, Kanda and Koike9–Reference Machado, Coelho and Veras11).
For these reasons, new tools for screening malnutrition in the over-65 population need to be developed to improve the diagnostic accuracy of the MNA questionnaire. In addition, the screening tools should be easy to use and interpret in any health care setting (primary health care, home care, nursing homes, etc.)(Reference Ravaglia, Forti and Lucicesare12).
The objective of this study is to propose malnutrition screening methods for use in the elderly population based on predictive multivariate models constructed with variables collected in the assessment of nutritional status. These methods aim to simplify and improve the diagnostic accuracy of other tools such as the MNA questionnaire.
Methods
Design, population and sample
This cross-sectional study was carried out in Cordoba, Spain.
From the population over 65 years of age attended in five medical quotas in three primary health centres, two urban and one rural, and three nursing homes (n 1725 patients), the minimum sample size was estimated. For a CI of 95 % and a power of 80 %, for an expected sensitivity and specificity of the new instrument of 85 % and taking Chang Method as Gold Standard (with 99 % of sensitivity and 95 % of specificity), the minimum sample size was 248 individuals. Based on the losses of a previous pilot study(Reference Muñoz, Molina-Recio and Romero-Saldaña8), the need to increase the number of subjects by 3 % was determined, obtaining a final sample size of 255 subjects. For the selection of the sample, a randomised sampling was carried out and stratified by age and type of patient (ambulatory/home/nursing home).
The inclusion criteria were: patient over 65 years of age, the possibility of obtaining information from the patient and/or primary caregiver and consent to participate in the study. The exclusion criteria were: existence of an incapacitating underlying disease (dementia, vascular accident, etc.) that prevented obtaining informed consent or information required for the study and not being able to locate a relative/caregiver who could act as surrogate.
Study and measurement variables
The outcome variable was nutritional status evaluated by the Chang method. This method was considered the most objective one, having significant advantages of reliability, reproducibility and specificity(Reference Linares Guerra, Bencomo and Santana13). This method determines the type and degree of malnutrition based on a score obtained from three types of variables: anthropometric (percentage of weight loss with respect to ideal weight, mid-upper arm circumference and triceps skinfold), biochemical (serum albumin level) and immunological (peripheral blood lymphocyte count). For purposes of analysis, the patients were classified according to the final score as malnourished (if a result indicating any type and degree of malnutrition was obtained) or normo-nourished.
The following independent or predictor variables were also included in the models:
-
— Sociodemographic variables: age (years), sex (male/female) and residence (in-home dependent/institutionalised/outpatient).
-
— Anthropometric variables: height (cm), weight (kg), BMI (kg/m2), calf circumference (cm), arm muscle circumference (cm) and waist circumference (cm).
-
— Clinimetric scales: depressive symptoms (Yesavage)(Reference Martínez, Onís and Dueñas14), cognitive impairment (Pfeiffer)(Reference Martínez, Dueñas and Onís15), instrumental capacity (Lawton and Brody)(Reference Lawton and Brody16), dependence in basic activities of daily life (Barthel)(Reference Mahoney and Barthel17) and nutritional status (Chang)(Reference Chang18,Reference Chang19) .
-
— Clinical analyses: Hb (g/dl), proteins (g/dl), iron (µg/dl), thyrotropin (mU/l), cholesterol (mg/dl), C-reactive protein (mg/l) and vitamin D (ng/ml).
-
— Other variables: number of diseases, number of prescription drugs taken and presence of most prevalent diseases.
All the measurements were performed by specially trained medical and nursing personnel in order to minimise the CV following the recommendations of the Anthropometric Standardization Reference Manual (Reference Stewart, Marfell-Jones and Olds20). Each variable was measured three times, and the mean value was calculated. Mid-upper arm circumference, calf circumference and waist circumference were determined in the non-dominant limb using a flexible tape measure. In addition, the triceps skinfold was measured using a Harpenden skinfold caliper with an accuracy of 0·2 mm. Weight and height were measured with an accuracy of 0·1 kg and 0·1 cm, respectively. A blood sample was subsequently taken to determine the analytical parameters. All data were collected from 2014 to 2016.
Two types of models were distinguished according to the nature of the predictor variables in the final model: non-invasive (without biochemical variables) or mixed (with biochemical variables, among others).
Statistical analysis
The quantitative variables are shown as means at a 95 % CI. The qualitative variables are reported in frequencies and percentages. To test the goodness-of-fit of the quantitative variables to a normal data distribution, the Lilliefors-corrected Kolmogorov-Smirnov test was performed. To test the hypothesis, ANOVA for the comparison of three means (parametric) or the Kruskal–Wallis test (non-parametric) was used. A post hoc analysis was carried out using the Bonferroni and Tukey tests, while the χ 2 test was used for the qualitative variables. Variables that showed a significant association with nutritional status were used to develop the models.
Given that the outcome variable was a dichotomous qualitative variable, two types of multivariate models were obtained:
-
— Binary logistic regression models adjusted for various qualitative and quantitative predictor variables. The models with invasive and non-invasive variables were compared. The adjusted OR was determined with a 95 % CI. Goodness-of-fit tests (–2 log-likelihood, goodness-of-fit statistic, Cox and Snell R 2, Nagelkerke R 2 and Hosmer-Lemeshow tests) were performed to assess the overall fit of the model.
-
— Discriminant analysis models adjusted only for quantitative predictor variables. The models with invasive and non-invasive variables were compared. Coefficients were obtained for each Fisher linear discriminant function (normo-nutrition and malnutrition). Box’s M test was used to check the equality of the matrices for both groups (normo-nourished and malnourished), and the Wilks’ lambda test was used to determine the discriminant capacity of the predictor variables.
Finally, receiver operating characteristic curves were used to compare the diagnostic accuracy of each multivariate model against the Chang method. The optimal cut-point, sensitivity, specificity and Youden index values were determined for each of the models.
For all the statistical analyses, an alpha error probability of <5 % (P < 0·05) was considered acceptable and a 95 % CI was calculated. SPSS (version 22.0) and EPIDAT (version 4.2) software were used to perform the analyses.
Results
Characteristics of the sample
Of the 255 patients enrolled, 248 (97·2 %) completed the study (one patient died during the study and the analytical data could not be completed for six of them).
Of the total number of patients in the study, 72·2 % (179) were women and the overall mean age of the sample was 81·3 years (95 % CI 80·2, 82·4). 51·5 % of the participants had no schooling, 31·4 % had completed primary school and 17 % had completed secondary or higher education. Regarding the level of dependency, 48·8 % of the patients were independent, 27·4 % were in-home dependents and 23·8 % lived in a nursing home. The mean number of illnesses was 3·9 (95 % CI 3·7, 4·1) with an average daily intake of 6·5 prescription drugs (95 % CI 6·1, 6·9). The prevalence of malnutrition according to the Chang nutritional status score was 29·6 %. A detailed description of the overall characteristics of the sample by age range is shown in Table 1.
Table 1 Descriptive characteristics of sample by age group
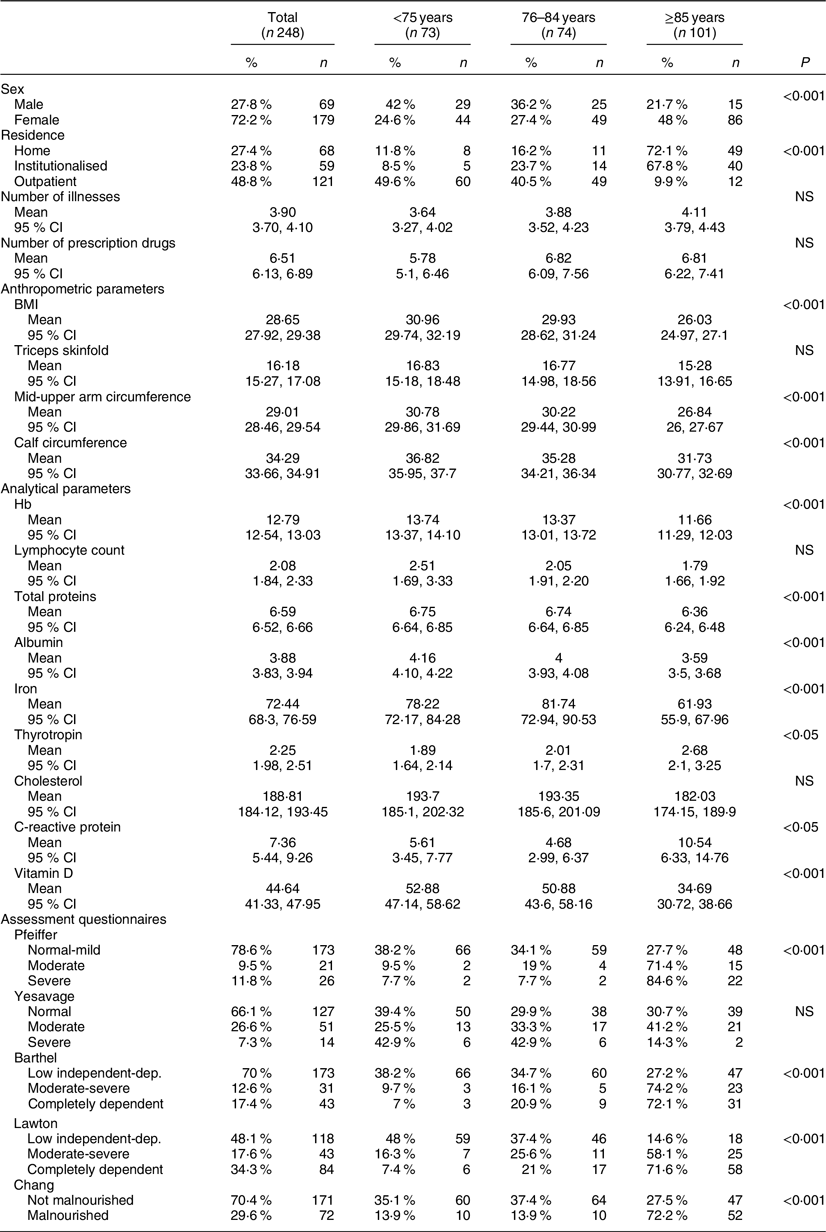
Data expressed in percentage % and absolute number in category; mean and 95 % CI; P = level of significance.
Design of models to detect malnutrition
Fourteen models for predicting risk of malnutrition were obtained from the adjusted binary logistic regression and discriminant analysis multivariate models. Of these, six were obtained by means of a discriminant multivariate analysis and eight by means of binary logistic regression. The sensitivity of the models ranged from 55·6 to 93·1 % and the specificity from 64·9 to 94 %. The maximum Youden index value was 0·77, and the minimum value was 0·49. Tables 2 and 3 show the models in addition to the main indicators of sensitivity, specificity, the validity index and the AUC.
Table 2 Multivariate models by discriminant analysis
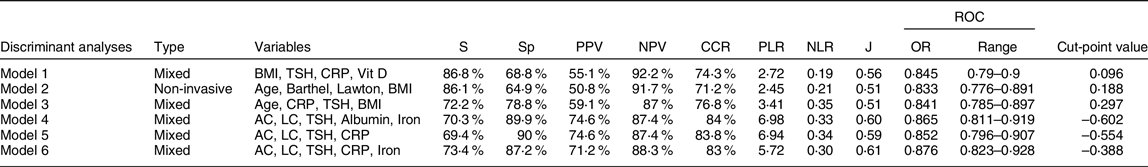
S, sensitivity; Sp, specificity; PPV, positive predictive value; NPV, negative predictive value; CCR, correctly classified cases; PLR, positive likelihood ratio; NLR, negative likelihood ratio; J, Youden index; ROC, receiver operating characteristic curve; TSH, thyroid-stimulating hormone; CRP, C-reactive protein; Vit D, vitamin D; AC, mid-upper arm circumference; LC, lymphocyte count.
Table 3 Multivariate models obtained by binary logistic regression
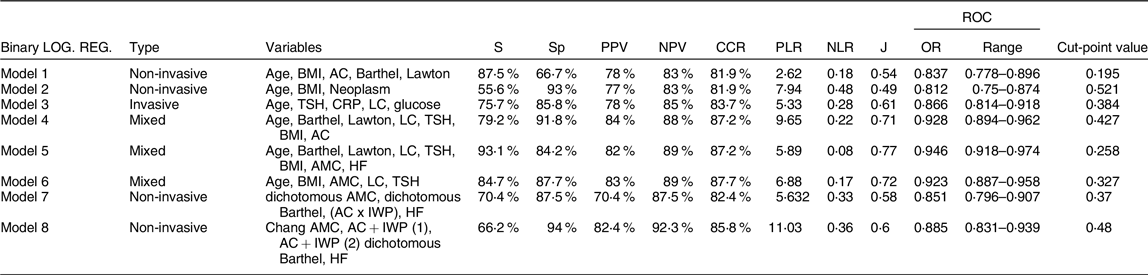
S, sensitivity; Sp, specificity; PPV, positive predictive value; NPV, negative predictive value; CCR, correctly classified cases; PLR, positive likelihood ratio; NLR, negative likelihood ratio; J, Youden index; ROC, receiver operating characteristic curve; AC, mid-upper arm circumference; TSH, thyroid-stimulating hormone; CRP, C-reactive protein; LC, lymphocyte count; AMC, arm muscle circumference; IWP, ideal weight percentage; HF, heart failure.
From non-invasive models, model 2 through discriminant analysis includes four variables (age, the Barthel and Lawton scales and BMI), obtaining an acceptable Youden index (0·51) and good sensitivity (86·1 %). By contrary, model 8, which was calculated by binary logistic regression, showed better Youden index (0·6) but worse sensitivity (66·2 %).
Of the mixed models, model 5 is integrated by eight variables showing the best Youden (0·77). Model 6, obtained by binary logistic regression with the predictor variables age, BMI, arm muscle circumference, lymphocytes and thyrotropin, showed a high sensitivity (84·7 %) and specificity (87·7 %).
The model 2 of discriminant analysis, as a non-invasive model, and model 6 of logistic regression, within the invasive ones, were considered the most practical. Finally, the canonical function of model 2 was obtained for its use in clinical practice. Figure 1 shows a summary diagram of the design of these models, and the coefficients of the discriminant equation from model 2 are also represented.
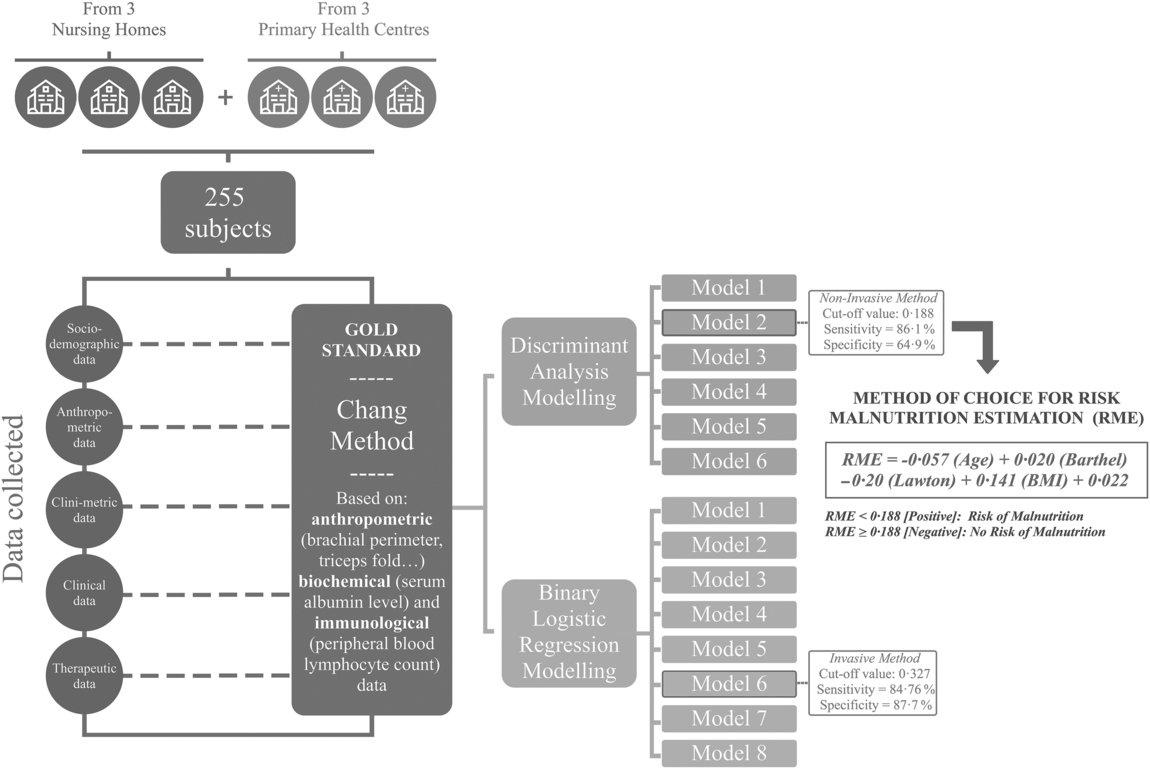
Fig. 1 Summary diagram of predictive models
Discussion
This study aims to determine the nutritional status of elderly patients by means of predictive models that are easy and quick to use in any social health care setting. For this purpose, fourteen multivariate models were obtained to detect malnutrition by combining several variables related to nutritional assessment.
In adults over 65 years of age, poor nutritional status can lead to a marked increase in morbidity and mortality, which is exponentially accentuated in the frail elderly due to chronic illnesses, functional dependence and inadequate intake(Reference Ulger, Halil and Kalan21). In a recently published prospective cohort study, it was observed that poor nutritional status is, on its own, an important prognostic factor of mortality, regardless of the cause. In addition, an association between malnutrition and mortality due to neoplasms and cardiovascular or respiratory disease has been reported(Reference Soderstrom, Rosenblad and Thors Adolfsson22).
The most frequent variables in the models with the greatest validity are age, BMI, arm muscle circumference, the Barthel and Lawton scales and the analytical parameters thyrotropin and lymphocyte count.
BMI, which is one of the most selected variables in all the models, has been used as a criterion to measure malnutrition in numerous studies. When the BMI value is below normal, it is strongly associated with malnutrition(Reference Soeters, Bozzetti and Cynober23). However, a recent meta-analysis has recommended increasing BMI cut-points to 23 kg/m2 to identify malnutrition in people 72 years of age and over(Reference Zhang, Pereira and Luo24). Similarly, the ESPEN consensus suggested a cut-off of 22 kg/m2 in people over 70 years of age(Reference Cederholm, Bosaeus and Barazzoni25). In our study, BMI is considered a continuous quantitative variable in the models that include this measurement.
However, age is one of the variables most strongly associated with malnutrition in our models. In a systematic review of 2499 publications by Fávaro-Moreira et al., the authors analysed variables that could be related to the development of malnutrition and found that age was among the most significant(Reference Fávaro-Moreira, Krausch-Hofmann and Matthys26).
Although the association between an individual’s loss of functional capacity and the risk of malnutrition is well known(Reference Kiesswetter, Pohlhausen and Uhlig27), level of dependency is rarely included in tools used to diagnose malnutrition. Dependency is only included in the Subjective Global Assessment questionnaire and in some questions of the MNA. In our study, the Barthel and Lawton scores have been found to be determinant variables in several of the models and in the most reliable non-invasive model.
As regards the analytical parameters, thyrotropin appears in nine models. An increase in this hormone could be due to an indirect effect given the decrease in the production of thyroid hormones in old age(Reference Kussmaul, Greiser and Haerting28,Reference Calsolaro, Niccolai and Pasqualetti29) . Lymphocyte count is the other most repeated analytical parameter (seven models). Several studies have confirmed the association between a decrease in lymphocytes and the risk of malnutrition(Reference Kaya, Acikgoz and Yildirim30,Reference Alvarez-Hernandez, Planas and Leon-Sanz31) .
In assessment equations, we selected model 2 from discriminant analysis (based on age, BMI, and Barthel and Lawton scales) for its accuracy and simplicity of application. That is, showing the same capacity to predict a state of malnutrition that others, this model does not require a blood test. We consider this an extremely important aspect due to the ease and speed with which it can be applied during a routine examination in primary care and the financial savings this would entail. In addition, the model includes variables that are usually considered when assessing elderly patients (Fig. 1).
Other studies have developed screening methods using variables to detect malnutrition, among them the mixed nutritional screening method (CIPA) for hospitalised patients that includes four parameters: intake control for 72 h, BMI, proteins and albumin(Reference Suarez, Benitez and Oliva32). Specific models have also been developed to assess malnutrition in diseases such as gastric adenocarcinoma using different variables (albumin, prealbumin and the CA-125 marker)(Reference Esfahani, Somi and Asghari33).
In addition to the MNA, there are other methods for diagnosing malnutrition, among them the Subjective Global Assessment(Reference Detsky, McLaughlin and Baker34), the Malnutrition Screening Tool(Reference Mueller, Compher and Ellen35) and the Malnutrition Universal Screening Tool(Reference Elia36). These are non-invasive screening tools that must be implemented by trained health personnel and are based on subjective criteria that can be interpreted in different ways depending on who performs the screening. In a recent study to validate the Malnutrition Screening Tool in Spanish, compared with a complete nutritional assessment, a sensitivity of 69·4 % and a specificity of 94·2 %(Reference Castro-Vega, Veses and Cantero37) were obtained as validity parameters for the tool. Malnutrition Universal Screening Tool was also evaluated in the same study and showed a sensitivity of 79·4 % and a specificity of 89·1 %. Although these findings are acceptable, we believe that the results of our study are more balanced and beneficial for the population and health professionals, as the proposed models eliminate possible subjective interpretations and do not require specific training to use them.
Limitations of the study
This study has two main limitations. First, some of the models include variables used in the Chang method. This method is considered the gold standard of nutritional screening, which could explain the high predictive capacity of these models. Second, the proposed model for analysing nutritional status has not been validated, so a validation study of the model on a different, larger sample size would be convenient.
Conclusions
The models proposed here simplify nutritional assessment in the elderly and, except for number 2 of those calculated by binary logistic regression, all of them showed a better diagnostic accuracy than the Spanish version of the MNA. In addition, the selected model can be performed by non-medical personnel, making it an accessible, easy and rapid tool in daily clinical practice. In any case, further studies will be necessary to consolidate these results.
Acknowledgements
Acknowledgements: Not applicable. Financial support: Development of predictive models for nutritional assessment in the elderly is part of a project supported by the Andalusian Health Service. File number: AP-0064-2016. Conflict of interest: None. Authorship: B.M.D.: study design, planning, data collection and write up of publication. J.M.I.: study design, planning, data collection and critical review of publication. M.R.S.: study design, data analysis and critical review of publication. R.M.L.: data collection and data analysis. A.P.A.L.: critical review of publication. G.M.R.: study design, data analysis and critical review of publication. All authors read and approved the final manuscript. Ethics of human subject participation: This study was conducted according to the guidelines laid down in the Declaration of Helsinki, and all procedures involving study participants were approved by the biomedical research committee of the Andalusian Public Health Service of Cordoba. Written informed consent was obtained from all subjects.


