


Chronic diseases in adulthood have their genesis in childhood( Reference McMahan, McGill and Gidding 1 , Reference McGill, McMahan and Herderick 2 ). Obesity in childhood and adolescence, characterized by excessive accumulation of TAG fatty acids within adipose tissue, is a strong risk factor for several chronic diseases in adulthood( Reference Reilly and Kelly 3 ). Since the 1980s, there has been a remarkable rise in the prevalence of overweight and obesity among children and adolescents in developed countries( Reference Ng, Fleming and Robinson 4 ). In Canada, the prevalence of overweight and obesity among youth aged 12–17 years doubled between 1978/79( Reference Shields 5 ) and 2009–2011( 6 ), and 30 % of children were considered overweight or obese in 2009–2011( 6 ).
Diet composition and energy intake have an important role in the deposition of fat( Reference Frayn, Coppack and Potts 7 , Reference Nelson and Tucker 8 ). Studies have revealed that adiposity occurs primarily with diets that are high in fat, high in sugar and low in fibre( Reference Nelson and Tucker 8 – Reference Miller, Niederpruem and Wallace 10 ). The chronic imbalance between dietary intake and oxidation of fat may lead to increases in the number and size of adipocytes( Reference Flatt 11 ). Conversely, supplementation with multivitamins and minerals has recently been shown to reduce appetite and thereby body weight and fat mass( Reference Major, Alarie and Doré 12 , Reference Major, Doucet and Jacqmain 13 ), highlighting the need to consider a broader spectrum of dietary factors rather than fat, sugar and fibre only.
Various investigators have sought to capture the broader spectrum of dietary factors into a single index to represent dietary quality( Reference Kourlaba and Panagiotakos 14 ). For example, the Healthy Eating Index summarized twelve food components into two dietary categories of adequacy and moderation( Reference Kennedy, Ohls and Carlson 15 ), and was recently updated to align with the key dietary recommendations of the 2010 Dietary Guidelines for Americans( Reference Guenther, Casavale and Reedy 16 ). The Diet Quality Index–International (DQII) considers a spectrum of dietary variety, adequacy, moderation and overall balance, and was developed to allow for international comparisons and to assess the risk for chronic disease( Reference Kim, Haines and Siega-Riz 17 ). Such indices have been utilized in a limited number of studies of dietary quality and adiposity in children and adolescents( Reference Meyerkort, Oddy and O’Sullivan 18 – Reference Lazarou, Panagiotakos and Matalas 22 ). No study has examined the association of dietary quality and prospective changes in adiposity. For the present study, we hypothesize that children with better dietary quality will gain less body fat over time.
Methods
Study population and procedures
Participants were drawn from the QUALITY (QUebec Adipose and Lifestyle InvesTigation in Youth) cohort, a familial study on the biological, genetic, behavioural, psychosocial and environmental determinants of obesity and cardiometabolic risk factors in Caucasian children and their evolution from childhood to adulthood( Reference Lambert, Van Hulst and O’Loughlin 23 ). Families were recruited through schools in the greater Montreal, Sherbrooke and Quebec City metropolitan areas between 2005 and 2008. Eligible families comprised a child aged 8–10 years at cohort inception and biological parents, at least one of whom was obese (BMI ≥30·0 kg/m2 and/or waist circumference ≥88 cm for women or ≥102 cm for men( Reference Grundy, Cleeman and Daniels 24 )). Children were excluded if they: (i) had type 1 or 2 diabetes; (ii) had any serious illness, psychological condition or cognitive disorder; (iii) were taking antihypertensive medication or steroids; and (iv) were following a very restricted diet (<2510 kJ/d (<600 kcal/d)). In 2005–2008, 630 children underwent comprehensive baseline examinations at the Clinical Research Units of either the Centre Hospitalier Universitaire (CHU) Sainte-Justine (Montreal) or the Institut universitaire de cardiologie et de pneumologie de Québec (IUCPQ) (Quebec City). In 2008–2011, 564 (89 %) children had their first follow-up study visit.
Measurements
Dietary quality
Dietary intake was assessed through three telephone-administered 24 h diet recalls on non-consecutive days (two weekdays and a weekend day) following the baseline clinic visit. After interviewing the child, trained dietitians asked a parent for details on food preparation and recipes. All three recalls were collected within 12 weeks of the baseline clinic visit; 98 % of participants had three recalls and 2 % had two recalls. Foods reported on the 24 h diet recalls were entered into the CANDAT nutrient analysis software (Godin London Inc., London, ON, Canada) and converted to nutrients using the 2007b Canadian Nutrient File. Data were entered and verified by trained data-entry staff and every tenth entry was audited for accuracy by a research dietitian. Age- and sex-specific dietary recommendations were used to calculate the DQII score( Reference Kim, Haines and Siega-Riz 17 , 25 ). The DQII has been used previously as a measure of dietary quality for children in Canada( Reference Veugelers, Fitzgerald and Johnston 26 – Reference Kim and Bae 28 ), the USA( Reference Kim, Haines and Siega-Riz 17 ), China( Reference Kim, Haines and Siega-Riz 17 ) and Korea( Reference Kim and Bae 28 ). It is a summary measure of dietary quality representing four categories of the diet, including variety, adequacy, moderation and overall balance. The overall DQII score constitutes the sum of the scores for each of these four categories and ranges from 0 to 100 (where 0=the poorest and 100=the highest dietary quality). Dietary variety (score 0 to 20) captures diversity in food choices and protein sources. Dietary adequacy (score 0 to 40) captures the adequate intake of food groups and nutrients (vegetables, fruit, grains, fibres, proteins, Fe, Ca and vitamin C). Dietary moderation (score 0 to 30) is scored on the basis of intake of total fat, saturated fat, cholesterol, Na and empty calorie foods. Lastly, overall balance (score 0 to 10) captures the proportion of energy from carbohydrates, protein and fat, as well as the fatty acid composition, according to accepted general guidelines for the proportion of energy from carbohydrate, protein, fat, and fat composition. More detail regarding the DQII can be found elsewhere( Reference Kim, Haines and Siega-Riz 17 ).
Adiposity
Fat mass was determined by dual-energy X-ray absorptiometry (Prodigy Bone Densitometer System, DF + 14664; GE Lunar Corporation, Madison, WI, USA)( Reference Goran 29 ). Measurements were taken with the child in the supine position on the scanning table, beginning at the top of the head and moving in a rectilinear pattern down the body to the feet. None of the participants required sedation. The adiposity measures of total and central body fat were computed as follows: percentage body fat (%BF) =[total fat mass (kg)]/[total mass (kg)] and percentage central body fat (%CBF) =[trunk fat mass (kg)]/[total mass (kg)], respectively( Reference Goran 29 ). Fat mass index (FMI) =[fat mass (kg)]/[height (m)]2 and central fat mass index (CFMI) =[trunk fat mass (kg)]/[height (m)]2 were estimated to account for differences in height( Reference Freedman, Wang and Maynard 30 ).
Anthropometrics
Anthropometric measurements were taken with the child dressed in light indoor clothing without shoes, using a calibrated stadiometer for height (measured at maximal inspiration) and an electronic scale for weight. Measurements were performed according to standardized protocols in duplicate or triplicate if the first two measurements differed by more than 0·2 cm for height or 0·2 kg for weight, and the two closest measures were averaged( Reference Lambert, Delvin and Levy 31 , Reference de Onis, Onyango and Van den Broeck 32 ). BMI was calculated as [weight (kg)]/[height (m)]2. BMI percentiles and Z-scores were calculated according to the 2000 US Centers for Disease Control and Prevention growth chart reference values( Reference Kuczmarski, Ogden and Guo 33 ). A child was categorized as being thin/normal weight, overweight or obese according to the cut-offs for BMI generated by the International Obesity Task Force for 2–18-year-olds( Reference Cole and Lobstein 34 ).
Potential confounders
Sex and baseline values of age, pubertal maturation, physical activity and total energy intake, as well as changes in pubertal maturation and changes in physical activity between baseline and 2-year follow-up, were considered as potential confounders of the association between diet quality and changes in body fat. Pubertal maturation was assessed by trained nurses, who assigned a Tanner stage according to pubic hair development in boys and breast and pubic hair development in girls( Reference Marshall and Tanner 35 , Reference Marshall and Tanner 36 ). Changes in Tanner stage between baseline and 2-year follow-up visits were categorized into two groupings (no change v. increase). Physical activity was measured using 7 d accelerometry (ActiGraph LS 7164 activity monitor; ActiGraph LLC, Pensacola, FL, USA) in the week following the clinic visit. Children were instructed to wear the accelerometer during daytime, except during bathing and aquatic activities. Days with observation of 10 h or more of wear time were considered in the analysis( Reference Trost, Loprinzi and Moore 37 ). Non-wear time was determined as at least sixty consecutive minutes of zero counts, with allowance for 1 to 2 min of counts between 0 and 100( Reference Colley, Garriguet and Janssen 38 ). Moderate-intensity physical activity (2296 to 4011 counts/min) and vigorous-intensity physical activity (≥4012 counts/min) were combined into one single category( Reference Trost, Loprinzi and Moore 37 ). Moderate-to-vigorous physical activity (MVPA) was categorized into two categories: <60 min/d v. ≥60 min/d of ≥2296 counts/min based on current guidelines( Reference Tremblay, Warburton and Janssen 39 ). Changes in MVPA between baseline and 2-year follow-up visits were categorized into three groupings (no change, increase to ≥60 min MVPA/d, decrease to <60 min MVPA/d).
Statistical analysis
The present study is based on 546 children who had complete data at baseline and follow-up visits (302 boys and 244 girls). Compared with these 546 children, those lost to follow-up or with incomplete dietary information were similar with respect to total body fat, central body fat and BMI. Differences in children’s characteristics between baseline and follow-up were tested using the paired t test or the χ 2 test. The distribution of DQII and each of its categories was summarized using means, medians and interquartile ranges. Changes in body fat according to DQII were depicted using the Lowess curves( Reference Jacoby 40 ) and least-squares regression lines. We analysed the relationship between DQII at baseline and the 2-year change in adiposity and anthropometric outcomes (BMI, FMI, CFMI, %BF, %CBF) using multivariable linear regression models while adjusting for sex, baseline values of age, outcome variables, Tanner stage, total energy intake, physical activity, as well as change in Tanner stage and change in physical activity between baseline and follow-up. All the outcome and exposure variables except for overall balance were analysed as continuous variables. Overall balance scores were positively skewed, with 74 % of the children having a score of 0 and the remainder having a score >2 (there were no children with a sore between 0 and 2). We therefore dichotomized overall balance to compare scores ≥2 with scores <2. All analyses were completed using the statistical software package Stata version 13. Statistical significance was set at P<0·05.
Results
Of the 546 participants with complete information, 244 (45 %) were girls and 302 (55 %) were boys. At baseline, children were on average 9·6 years of age and at follow-up 11·6 years of age (Table 1). Body fat indices and BMI increased during the 2-year follow-up. Over 2 years, FMI and CFMI increased on average by 18 % and 22 %, and %BF and %CBF increased by 9 % and 13 %, respectively (Table 1). These increases in total and central body fatness were not reflected in prospective changes in BMI Z-score or the proportion of children classified as thin/normal weight, overweight and obese (Table 1).
Table 1 Characteristics at baseline and 2-year follow-up of 546 Canadian children (244 girls and 302 boys) participating in the QUALITY (QUebec Adipose and Lifestyle InvesTigation in Youth) study
MVPA, moderate-to-vigorous physical activity; NA, not assessed.
*P<0·001.
† Differences between baseline and 2-year follow-up tested using the paired t test.
‡ Differences between baseline and 2-year follow-up tested using the χ 2 test.
§ Tanner stage values ranged from 1 to 4 at baseline and from 1 to 5 at follow-up.
|| Data were not available at follow-up.
Overall DQII score ranged from 34 to 75 and was approximately the same among boys and girls (58 v. 57, respectively). Table 2 shows that, on average, participants had relatively high scores for dietary variety (15 out of 20) and adequacy (30 out of 40) but had substantially lower scores for moderation (12 out of 30) and overall balance (1 out of 10). These striking differences in the distribution of the overall DQII score and its categories, expressed as percentages, are depicted in Fig. 1.
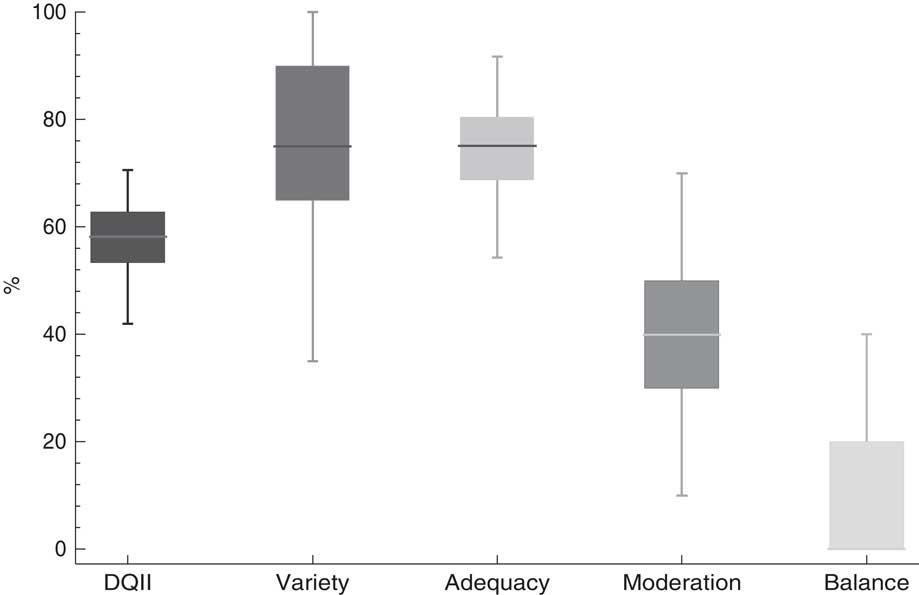
Fig. 1 Box plots of overall Diet Quality Index–International (DQII) and its categories in 546 Canadian children (244 girls and 302 boys) participating in the QUALITY (QUebec Adipose and Lifestyle InvesTigation in Youth) study. The line within the boxes represents the median, the height of the boxes shows the interquartile range, and the whiskers extend to the 2·5 and 97·5 percentiles of the distribution
Table 2 Average Diet Quality Index–International (DQII) scores in 546 Canadian children (244 girls and 302 boys) participating in the QUALITY (QUebec Adipose and Lifestyle InvesTigation in Youth) study
Figure 2 presents scatter plots of DQII scores in relation to changes in adiposity and reveals smaller 2-year increases in body fat for participants with higher baseline DQII scores. The gradient seems to approximate linearity because the depicted Lowess curves and least-squares regression lines are similar (Fig. 2). Table 3 presents the estimated magnitude of the changes in adiposity for every 10-unit improvement in the overall DQII score and 1-unit improvement in DQII categories. After adjusting for all confounders, every 10-units improvement in the overall DQII score was associated with lower gain in CFMI (β=−0·08; 95 % CI −0·17, −0·003) and %BF (β=−0·55; 95 % CI −1·08, −0·02) Dietary adequacy was associated with all body fat indicators after adjusting for confounders. Every unit improvement in dietary adequacy score was associated with lower gain in FMI (β=−0·05; 95 % CI −0·08, −0·008), CFMI (β=−0·03; 95 % CI −0·05, −0·007), %BF (β=−0·15; 95 % CI −0·28, −0·03) and %CBF (β=−0·09; 95 % CI −0·15, −0·02). None of the other DQII categories (variety, moderation and overall balance) were associated with 2-year changes in adiposity. Finally, neither the DQII nor any of its categories were associated with changes in BMI over 2 years.
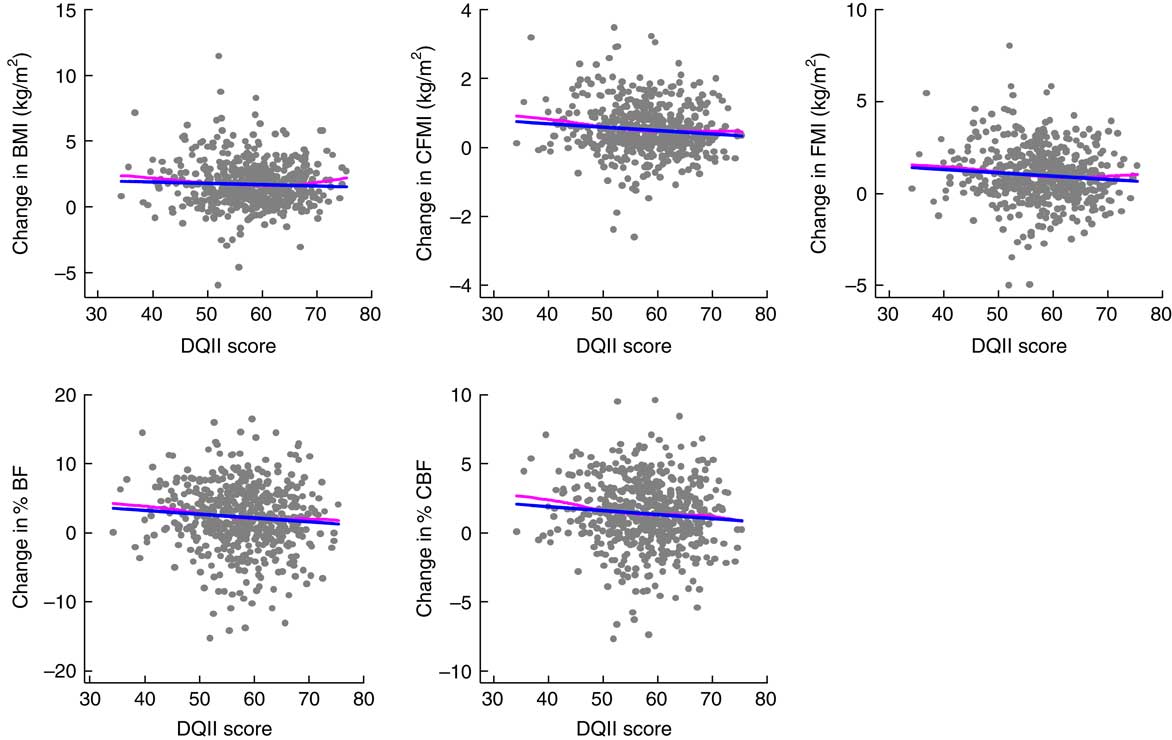
Fig. 2 Association of Diet Quality Index–International (DQII) score with changes in adiposity between baseline and 2-year follow-up in 546 Canadian children (244 girls and 302 boys) participating in the QUALITY (QUebec Adipose and Lifestyle InvesTigation in Youth) study: ![]() , Loess (local regression of the association between diet quality and changes in adiposity and BMI);
, Loess (local regression of the association between diet quality and changes in adiposity and BMI); ![]() , linear least-squares regression of the association between diet quality and changes in adiposity and BMI (CFMI, central fat mass index; FMI, fat mass index; %BF, percentage body fat; %CBF, percentage central body fat)
, linear least-squares regression of the association between diet quality and changes in adiposity and BMI (CFMI, central fat mass index; FMI, fat mass index; %BF, percentage body fat; %CBF, percentage central body fat)
Table 3 The impact of Diet Quality Index–International (DQII) score and its categories on changes in adiposity between baseline and 2-year follow-up in 546 Canadian children (244 girls and 302 boys) participating in the QUALITY (QUebec Adipose and Lifestyle InvesTigation in Youth) study
*P<0·05, **P<0·01.
† Balance was entered into the analysis as dichotomous variable: score ≥2 v. score <2.
‡ Coefficients represent the change in adiposity outcomes per 10-unit change in overall DQII.
§ Linear regression model adjusted for sex and baseline values of age, outcome variables, Tanner stage, total daily energy intake and physical activity, as well as change in Tanner stage and change in physical activity between baseline and follow-up.
Discussion
In the present study, we demonstrated that children with poor dietary quality and particularly poor dietary adequacy were on a trajectory of greater adiposity gain relative to children with better dietary quality. We observed associations of dietary quality with CFMI and %BF, independent of sex, age, total energy intake, physical activity and Tanner stage, but not with FMI, %CBF and BMI. We observed statistically significant associations of dietary adequacy, but not of dietary variety, moderation and balance, with FMI, CFMI, %BF and %CBF.
With an average DQII score of 58, the dietary quality of the children participating in the QUALITY study appeared slightly lower than that reported in prior studies that have used this measure. The DQII scores of 61 and 62 were observed for grade 5 students in the Canadian provinces of Nova Scotia( Reference Veugelers, Fitzgerald and Johnston 26 ) and Alberta( Reference Ferland, Chu and Gleddie 27 ), respectively. Further, average DQII scores of 67, 60 and 59 have been reported for elementary students in Korea( Reference Kim and Bae 28 ) and for nationally representative samples of children in China and the USA( Reference Kim, Haines and Siega-Riz 17 ), respectively. The relatively poor dietary quality seems consistent with the observation that QUALITY participants are more likely overweight or obese and more likely to have a poor lipid profile relative to a representative sample of Quebec children( Reference Lambert, Van Hulst and O’Loughlin 23 ). This is likely a consequence of the inclusion criterion that limited study eligibility/enrolment to children of obese parents. The relatively high values for dietary variety and adequacy in comparison with the low values for dietary moderation and overall balance in the present study (Fig. 1) were also reported for the American population( Reference Kim, Haines and Siega-Riz 17 ).
The relationship of dietary quality and adiposity has not been extensively investigated among children. A prospective study in the UK found a strong association between poor dietary quality and higher total fat mass Z-scores among children below the age of 6 years( Reference Okubo, Crozier and Harvey 19 ). A cross-sectional US study among adolescents utilized the Healthy Eating Index and reported negative associations with both %BF and percentage abdominal fat( Reference Hurley, Oberlander and Merry 21 ). A Greek cross-sectional study utilized the E-KINDEX tool to assess dietary quality among children (mean age: 10·7 years) and reported higher dietary quality to be associated with lower %BF( Reference Lazarou, Panagiotakos and Matalas 22 ). With respect to BMI, three studies, including a cohort study in Australia( Reference Meyerkort, Oddy and O’Sullivan 18 ) that followed participants from birth to adolescence, the prospective UK study( Reference Okubo, Crozier and Harvey 19 ) and a cross-sectional study among grade 5 children in Nova Scotia( Reference Kuhle, Allen and Veugelers 20 ), reported no associations of dietary quality with BMI or excess body weight. An Australian cohort study among children (5–12 years at baseline) in socio-economically disadvantaged neighbourhoods revealed an association between dietary quality and BMI Z-scores among those children who were overweight but not among those with normal body weight( Reference Lioret, McNaughton and Cameron 41 ). Similarly, previous studies( Reference Okubo, Crozier and Harvey 19 , Reference Hurley, Oberlander and Merry 21 , Reference Lazarou, Panagiotakos and Matalas 22 ) reported associations of dietary quality with actual measures of body fat rather than BMI in childhood or adolescence. Two years of follow-up may be too short to expect changes in body fat to translate into differences in body weight categories or BMI in this age group. Studies with longer follow-up may reveal such differences.
The present study examined the importance of dietary quality for prospective changes in adiposity, which had not been previously reported in children and youth. Our findings are consistent with the studies conducted in the UK( Reference Okubo, Crozier and Harvey 19 ), USA( Reference Hurley, Oberlander and Merry 21 ) and Greece( Reference Lazarou, Panagiotakos and Matalas 22 ), with an additional finding of an association of dietary quality with central body fat. The magnitude of changes in total and central body fat that were associated with the overall DQII score seems comparable with those of others( Reference Meyerkort, Oddy and O’Sullivan 18 ). Although the magnitude of changes is small, the cumulative impact over time may be substantial.
Dietary adequacy captures the adequate consumption of fruit and vegetables, grains, protein, fibre, Fe, Ca and vitamin C( Reference Kim, Haines and Siega-Riz 17 , Reference Lee, Kim and Choi 42 ). The present study revealed that dietary adequacy was associated with all adiposity indicators. This observation seems consistent with the concept that adequacy of multiple micronutrients and macronutrients, rather than adequacy of a single nutrient, is essential to good health( Reference Kourlaba and Panagiotakos 14 ). In the present study, we did not reveal significant associations of dietary variety, moderation and balance with adiposity. The explanation of this may be twofold. First, the association between dietary quality and adiposity was mostly driven by adequacy. Second, nutrition research has a long history of studying adequacy( Reference Wretlind 43 ), which has led to good definitions and quantifications of adequacy( Reference Dhonukshe-Rutten, Bouwman and Brown 44 ). Inaccuracies in the definitions and quantifications of variety, moderation and balance may have hampered our ability to observe statistically significant associations.
Strengths and limitations
The present study benefits from several strengths including high retention rate at follow-up (89 %), objective measurement of body fat through dual-energy X-ray absorptiometry and physical activity through accelerometer, as well as directly measured height and weight. Dual-energy X-ray absorptiometry is increasingly accepted as a reference method to measure body composition( Reference Nahikian-Nelms 45 ). Each participant completed two or three 24 h dietary recalls as a single recall may fail to capture the usual intake of individuals( Reference Bingham 46 ). However, our study has some limitations. It is not known how representative changes over a period of 2 years are for longer-term weight gain and risk of chronic diseases. The generalizability of our findings may be limited to Caucasian children with a parental history of obesity, higher socio-economic status, and who are at risk for overweight or obesity. No dietary data were collected at the 2-year follow-up visit which prevented us from examining changes in dietary intake over time.
Conclusion
We observed an inverse association of dietary quality and dietary adequacy with changes in total body fat and central body fat independent of sex, age, total energy intake, physical activity and Tanner stage among children. Therefore, the present findings support preventive initiatives aimed at enhancing the quality of the diet and particularly the adequate intakes of nutrients as a means to reduce the societal burden of excess body weight. Health promotion to date has mostly focused on the reduction of dietary fat and added sugar as strategies to promote healthy body weight. The observations of the present study make a case for the promotion of dietary quality and adequacy as a strategy to achieve healthier body weight and reduce the development of chronic diseases in the long term( Reference Després 47 , Reference Fung, McIsaac and Kuhle 48 ).
Acknowledgements
Acknowledgements: Dr Marie Lambert (July 1952–February 2012), paediatric geneticist and researcher, initiated the QUALITY cohort. Her leadership and devotion to QUALITY will always be remembered and appreciated. The cohort integrates members of TEAM PRODIGY, an inter-university research team including Université de Montréal, Concordia University, INRS-Institute-Armand Frappier, Université Laval and McGill University. The research team is grateful to all the children and their families who took part in this study, as well as the technicians, research assistants and coordinators involved in the QUALITY cohort project. Financial support: The QUALITY cohort is funded by the Canadian Institutes of Health Research (grant numbers OHF-69442, NMD-94067, MOP-97853, MOP-119512); the Heart and Stroke Foundation of Canada (grant number PG-040291); and Fonds de la Recherche en Santé du Québec. K.M. holds a Career Development Award in Prevention Research funded by the Canadian Cancer Society (grant number 702936). M.H. holds a Fonds de Recherche en Santé du Québec Junior 1 salary award. The present analysis was funded through the Collaborative Research and Innovation Opportunities (CRIO) Team programme from Alberta Innovates–Health Solutions (AIHS). The funders had no role in the design, analysis or writing of this article. Conflict of interest: There is no conflict of interest. Authorship: M.H., G.P., A.T. and K.G.-D are the Principal Investigators of the QUALITY study. S.S., P.V. and K.M. conceived the research idea. S.S. conducted the statistical analysis and drafted the manuscript. S.S., P.V., K.M. and J.E. interpreted the statistical analysis. All authors critically reviewed and provided feedback to the draft manuscript. All authors read and approved the final manuscript. Ethics of human subject participation: All children provided assent and their parents provided signed informed consent. QUALITY protocols have received approval from the Institutional Ethics Review Board at the CHU Sainte-Justine and Laval University. The Institutional Ethics Review Board at the University of Alberta approved the current study.


