Obesity has been become a major public health concern in China over the past decade( Reference Mi, Zhang and Wang 1 ). One of the most important contributors of obesity has been identified as diet( Reference Kennedy, Bowman and Spence 2 ), in which dietary energy density (ED), referring to the amount of energy per unit weight of food (kcal/g)( Reference Rolls 3 ), has been paid increasing attention. High energy-dense diets, often rich in fat but poor in micronutrients, are becoming more common among the Chinese in recent years( Reference Wang, Zhai and Du 4 ). Therefore, the potential relationship between high energy-dense diets and the rapid increase of obesity has received considerable interest.
Although both the WHO and the US Department of Health and Human Services recommended limited consumption of high energy-dense foods for obesity prevention( 5 , 6 ), the exact association between ED and obesity has not yet been confirmed. So far, various population-based studies have examined the associations between ED and anthropometric indicators of obesity and come to different conclusions: some observational studies indicate that there are positive associations between ED and BMI, waist circumference (WC) or body weight among adults in the USA( Reference Mendoza, Drewnowski and Christakis 7 – Reference Vernarelli, Mitchell and Rolls 10 ), European countries( Reference Romaguera, Ängquist and Du 11 ), Japan( Reference Murakami, Sasaki and Takahashi 12 ), Denmark( Reference Iqbal, Helge and Heitmann 13 ) and Iran( Reference Azadbakht, Haghighatdoost and Esmaillzadeh 14 ), whereas others do not( Reference de Castro 15 – Reference de Castro 17 ). Additionally, a lack of consensus on how to calculate ED among these studies may lead to illusory interpretation of the association between ED and body composition( Reference Cox and Mela 18 ). Furthermore, indicators like percentage body fat (%BF), fat mass index (FMI) and fat-free mass index (FFMI) are more stable indicators of obesity( Reference Kyle, Morabia and Schutz 19 ) compared with BMI, WC or body weight. To date, only one study using data from the 1991 China Health and Nutrition Surveys (CHNS)( Reference Stookey 20 ) found a null association between ED and body composition, but this data sample may no longer represent the current epidemic trends of obesity or dietary status among Chinese adults.
Given the inconsistent conclusions among previous studies and the lack of research in Chinese populations, we aimed to investigate whether ED was associated with body composition (BMI, FMI, FFMI, %BF and WC) among Chinese adults by using representative data of adults from Southwest China.
Methods
Study sample
Participants for the present analysis were derived from an ongoing, population-based prospective study carried out in Southwest China since 2013, which was designed to collect information on diet, anthropometry and lifestyle (e.g. physical activity) of adults who are representative for Southwest China, as described elsewhere( Reference Xue, Yang and Liu 21 ).
A two-stage (household–person) sampling was used at twenty-one study sites (twelve communities and nine villages) and participants were invited to the study centre for interviews. We used data from the baseline survey of the study collected between 2013 and 2014, and each visit included anthropometric measurements, questionnaires and face-to-face interviews by trained investigators about nutrition-related behaviours, lifestyle and social status. Participants in the present analysis have been shown to be comparable to age-matched adults in our cohort study and the general population of urban and rural areas in Southwest China on sociodemographic and lifestyle characteristics( 22 ).
Initially, 2371 participants aged 20–70 years were recruited for the current analysis, with an overall response rate of 87·8 % (2371/2700). Of all these individuals, 312 participants were excluded for having missing data on 24 h dietary recalls or anthropometric measurements. We also excluded 112 men and fourteen women who misreported daily energy intake (>17 573 or <3347 kJ/d (>4200 or <800 kcal/d) for men and >14 664 or 2092 kJ/d (>3500 or <500 kcal/d) for women)( Reference Yu, Zhang and Xiang 23 ). Therefore, 1933 adults in total (951 men and 982 women, 81·5 % of the eligible sample) were eventually obtained for the statistical analyses.
Dietary data
Throughout the study, we collected dietary intakes by using validated two-day 24 h dietary recalls( Reference Xue, Yang and Liu 21 ). These dietary recalls were completed on two random days (one weekday and one weekend day) within a 10 d period by trained investigators in face-to-face interviews. Participants were asked to report all foods, beverages and drinking-water they had consumed during the preceding 24 h. Trained dietitians were responsible for collecting the information on the recipes and types and brands of all reported food items. In addition, standard serving bowls, plates and glasses were used for helping respondents estimate the portion sizes of foods and beverages as accurately as possible; more than 150 food models for foods commonly consumed by Chinese adults were provided to help clarify the food items reported. Study participants were also given a photo book containing photos of snacks and beverages, including the names of snacks and beverages and pictures of the commonly used commercial packaging (e.g. 1 carton) to improve the dietary recall. In total, approximately 200 food items could be found from this photo book. Nutrient analysis software (NCCW version 11.0, 2014), based on the continuously updated in-house nutrient database (China food composition)( Reference Yuexin and Yaguang 24 ), was used to calculate daily energy intake and food weights from 24 h recalls. Currently, the database contains information on energy and thirty-six nutrients for >1527 entries (944 basic food items, 562 food products and twenty-one dietary supplements). Values of energy intake and mean values of daily ED over two days were used in the analysis.
Calculation of energy density
The ED of each participant’s diet was calculated by dividing the amount of energy (in kilocalories) by the total weight of food consumed (in grams)( Reference Rolls 3 ). The quantity and the energy content of all food items (both liquid and solid) and/or water-based drinks consumed by each participant over the entire two-day period were summed. Next, we calculated the mean value of ED over the two days for further analysis. Since there is no standardized method for selecting which foods and/or beverages to use to calculate ED, researchers who are trying to analyse the relationship between ED and health outcomes must develop their own calculation methods. In previous studies, including or excluding water or water-based drinks from the calculation of ED was an important issue, owing to the remarkable effect of water on overall ED( Reference Daniels and Popkin 25 ). Of all components, beverages represent one of the biggest concerns when calculating ED, because beverage items tend to have a high water content and extremely low energy, which will substantially lower the ED of an entire meal( Reference Kant, Graubard and Mattes 26 ). Additionally, milk and alcohol are two types of common water-based drinks that are not listed in the beverage category of the China food composition database( Reference Yuexin and Yaguang 24 ). We included them separately in our analysis due to their underlying association with obesity( Reference Jaffiol 27 , Reference Schröder, Morales-Molina and Bermejo 28 ) and relatively high intake frequency in Chinese adults( Reference Ma, Zhang and Wang 29 , Reference Liu, Zhang and Du 30 ). Thus, for the present study, ED was calculated using five methods as follows: (i) ED1 included foods only and excluded all beverages; (ii) ED2 included foods and alcohol; (iii) ED3 included foods and milk; (iv) ED4 included foods and energy-containing beverages (beverages containing at least 20·9 kJ (5 kcal)/100 g)( Reference Ledikwe, Blanck and Khan 31 ), such as coffee and sugar-sweetened beverages; and (v) ED5 included foods and all beverages.
Foods are defined as solid, semi-solid and liquid items that are typically consumed as foods( Reference Ledikwe, Blanck and Khan 31 ). For example, rice porridge and egg custard consumed as traditional Chinese foods were categorized as foods in our analyses. According to the China food composition database( Reference Yuexin and Yaguang 24 ), the beverage category contains water-based drinks as follows: carbonated drinks, fruit juices and fruit-flavoured drinks, vegetable juices and drinks, vegetable protein drinks, milk drinks, teas and tea beverages, and powdered beverages. Several unconventional beverages like ice creams and popsicles are also included in the beverage category in the China food composition database, but we did not exclude them from analysis given their extremely low consumption (fewer than ten times total). All methods excluded drinking-water and mineral water as beverages.
Anthropometric measurements
Trained nurses collected anthropometric measurements, with the participants dressed only in underwear, barefoot and with women’s hair uncovered. With an Ultrasonic Weight and Height Instrument (DHM-30; Dingheng Ltd, Zhengzhou, China), technicians recorded body weight and height to a precision of 0·1 kg and 0·1 cm, respectively.
In the analysis, we calculated BMI as weight (in kilograms) divided by the square of height (in metres) and defined individuals as overweight/obese according to the WHO BMI cut-offs for adults( 32 ). WC (in centimetres) was measured to the nearest 0·1 cm using a non-elastic tape at a point midway between the lowest rib margin and the iliac crest in a horizontal plane. Using sex-specific equations we calculated %BF, which was developed and subsequently validated in two independent Chinese cohort populations by Liu et al. ( Reference Liu, Sun and Sun 33 ) in view of ethnic differences between Chinese population and Westerners. Next, we calculated FMI and FFMI as follows( Reference Vanitallie, Yang and Heymsfield 34 ): FMI=(weight × %BF)/height2 and FFMI=[weight – (weight × %BF)]/height2.
Additional information
For the present analysis, age (years) and family-related data like smoking (never, past, current: 1–15, 16–24 or >24 cigarettes/d), education level (<9 years, 9–12 years and >12 years of schooling), occupation (no, yes: part-time worker or full-time worker), monthly family income per capita (<3000 Yuan, 3000–5000 Yuan and >5000 Yuan) and monthly personal income (<3000 Yuan, 3000–5000 Yuan and >5000 Yuan) were considered as potential confounders.
The frequency, duration and type of physical activity as well as leisure-time activities were collected through a detailed questionnaire similar to a previously validated tool for Chinese adults( Reference Matthews, Shu and Yang 35 ), with some additional modifications after a pilot study. Based on these data, energy expended on moderate-to-vigorous physical activities (MVPAEE) and sedentary time( Reference Peterson, Al Snih and Stoddard 36 ) were constructed.
Statistical analyses
The statistical software package SAS version 9.3 (2011) was used for statistical analyses. The statistical significance was considered as P value <0·05. We assessed normality using normal probability plots and the Kolmogorov–Smirnov test. Given their non-normal distribution, all continuous variables were expressed using the median (Q1–Q3). Additionally, data for men and women were analysed separately considering the natural differences in body composition and energy needs between them( Reference Wells 37 ). We used χ 2 and Wilcoxon two-sample tests to explore differences in anthropometric, dietary and family data by sex for categorical and non-normally distributed continuous variables, respectively.
Multiple linear generalized regression models were used to determine whether there were linear relationships between ED and body composition parameters (BMI, FMI, FFMI, %BF and WC). The independent variables included in models were ED1, ED2, ED3, ED4 and ED5, the dependent variables were BMI, FMI, FFMI, %BF and WC, and the data were presented as regression coefficients with their standard errors.
In the multiple linear regression models, each potential covariate was initially considered separately: only variables that had their own independent significant effect in the basic models or that substantially modified the principal association of ED with body composition were considered. Therefore the following variables were included in the analyses: age (years), education level (<9 years, 9–12 years and >12 years of schooling), MVPAEE (kcal/d), monthly family income per capita (<3000 Yuan, 3000–5000 Yuan and >5000 Yuan), monthly personal income (<3000 Yuan, 3000–5000 Yuan and >5000 Yuan), smoking (never, past, current: 1–15, 16–24 or >24 cigarettes/d) and occupation (no, yes: part-time worker or full-time worker).
Results
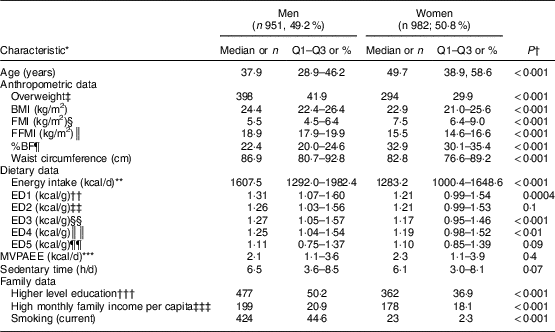
General characteristics of the participants are presented in Table 1. Men had significantly higher BMI, WC and FFMI, and lower FMI and %BF, than women (P<0·001). The prevalence of overweight was also higher in men than in women (P<0·001). We also found significant sex differences in education level, monthly family income per capita, smoking and age (P<0·001), but not in MVPAEE and sedentary time (P=0·4 and P=0·07, respectively). Furthermore, men had significantly higher energy intake than women (P<0·001). Of all five ED calculation methods, ED1 yielded the highest values, which were 5·48 (Q1–Q3 4·48–6·69) kJ/g (1·31 (Q1–Q3 1·07–1·60) kcal/g) for men and 5·06 (Q1–Q3 4·14–6·44) kJ/g (1·21 (Q1–Q3 0·99–1·54) kcal/g) for women. ED5, including all beverages in the calculation, produced the lowest values, which were 4·64 (Q1–Q3 3·14–5·73) kJ/g (1·11 (Q1–Q3 0·75–1·37) kcal/g) for men and 4·60 (Q1–Q3 3·56–5·82) kJ/g (1·10 (Q1–Q3 0·85–1·39) kcal/g) for women. Men had a higher ED than women, although sex differences in ED2 and ED5 were not significant (P=0·1 and P=0·09, respectively).
Table 1 Characteristics of the study sample by sex: adults (n 1933), Southwest China, 2013
* Data are presented as median and Q1–Q3 for continuous variables, or as n and % for categorical variables.
† Tests for differences between men and women were performed using Wilcoxon two-sample tests for non-normally distributed continuous variables or using χ 2 tests for categorical variables.
‡ Overweight defined according to the WHO cut-offs for adults( 32 ).
§ FMI, fat mass index=(weight × %BF)/height2 ( Reference Vanitallie, Yang and Heymsfield 34 ).
║ FFMI, fat-free mass index=[weight – (weight×%BF)]/height2 ( Reference Vanitallie, Yang and Heymsfield 34 ).
¶ %BF, percentage body fat calculated using sex-specific equations( Reference Liu, Sun and Sun 33 ).
** To convert to kJ, multiply kcal values by 4·184.
†† ED1, energy density from foods only, excluding all beverages.
‡‡ ED2, energy density from foods and alcohol.
§§ ED3, energy density from foods and milk.
║║ ED4, energy density from foods and energy-containing beverages (>20·9 kJ (>5 kcal)/100 g)( Reference Ledikwe, Blanck and Khan 31 ).
¶¶ ED5, energy density from foods and all beverages.
*** MVPAEE, energy expended on moderate-to-vigorous physical activities( Reference Peterson, Al Snih and Stoddard 36 ).
††† Higher level education, school education >12 years.
‡‡‡ High monthly family income per capita, monthly family income per capita >5000 Yuan( 22 ).
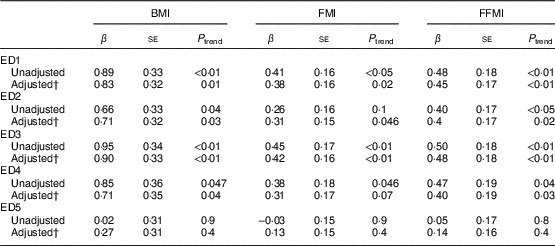
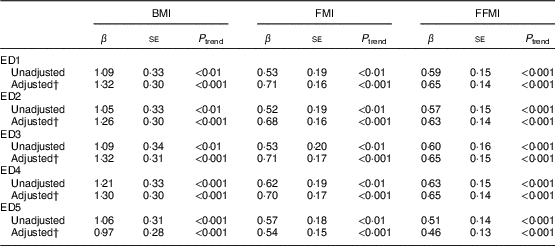
Among men, ED based on most calculation methods (ED1, ED2, ED3 and ED4) was positively and significantly associated with BMI, FMI and FFMI (P<0·05) except for the association between ED4 and FMI (P=0·07); in addition, no significance was observed between ED5 and each of the body composition measures (P>0·1; Table 2). In women, positive associations between ED and BMI, FMI and FFMI were observed regardless of inclusion of beverages in the calculation of ED (P<0·01; Table 3).
Table 2 Association of energy density with BMI, fat mass index and fat-free mass indexFootnote * among men (n 951), Southwest China, 2013
FMI, fat mass index=(weight × %BF)/height2 ( Reference Vanitallie, Yang and Heymsfield 34 ); FFMI, fat-free mass index=[weight – (weight × %BF)]/height2 ( Reference Vanitallie, Yang and Heymsfield 34 ); ED1, energy density from foods only, excluding all beverages; ED2, energy density from foods and alcohol; ED3, energy density from foods and milk; ED4, energy density from foods and energy-containing beverages (>20·9 kJ (>5 kcal)/100 g )( Reference Ledikwe, Blanck and Khan 31 ); ED5, energy density from foods and all beverages.
* Results are presented as regression coefficients (β) with their standard errors.
† Adjusted for age, education level (<9 years, 9–12 years and >12 years of schooling), smoking (never, past, current: 1–15, 16–24 or >24 cigarettes/d), monthly family income per capita (<3000 Yuan, 3000–5000 Yuan and >5000 Yuan), sedentary time and energy expended on moderate-to-vigorous physical activities (MVPAEE).
Table 3 Association of energy density with BMI, fat mass index and fat-free mass indexFootnote * among women (n 982), Southwest China, 2013
FMI, fat mass index=(weight × %BF)/height2 ( Reference Vanitallie, Yang and Heymsfield 34 ); FFMI, fat-free mass index=[weight – (weight × %BF)]/height2 ( Reference Vanitallie, Yang and Heymsfield 34 ); ED1, energy density from foods only, excluding all beverages; ED2, energy density from foods and alcohol; ED3, energy density from foods and milk; ED4, energy density from foods and energy-containing beverages (>20·9 kJ (>5 kcal)/100 g )( Reference Ledikwe, Blanck and Khan 31 ); ED5, energy density from foods and all beverages.
* Results are presented as regression coefficients (β) with their standard errors.
† Adjusted for age, education level (<9 years, 9–12 years and >12 years of schooling), smoking (never, past, current: 1–15, 16–24 or >24 cigarettes/d), monthly family income per capita (<3000 Yuan, 3000–5000 Yuan and >5000 Yuan), sedentary time and energy expended on moderate-to-vigorous physical activities (MVPAEE).
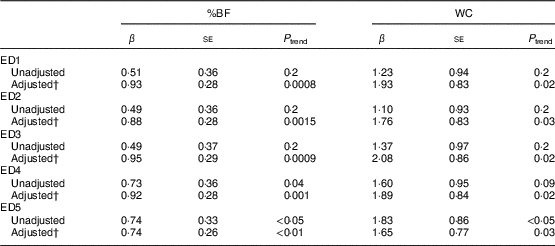
ED was significantly associated with both %BF and WC in women (P<0·05; Table 4). Among men, we observed a significant association between %BF and ED1 and ED3 (P=0·03 and P=0·02, respectively, Table 5), while an association with WC was observed only for ED3 (P=0·03).
Table 4 Association of energy density with percentage body fat and waist circumferenceFootnote * among women (n 982), Southwest China, 2013
%BF, percentage body fat calculated according to sex-specific equations( Reference Liu, Sun and Sun 33 ); WC, waist circumference; ED1, energy density from foods only, excluding all beverages; ED2, energy density from foods and alcohol; ED3, energy density from foods and milk; ED4, energy density from foods and energy-containing beverages (>20·9 kJ (>5 kcal)/100 g )( Reference Ledikwe, Blanck and Khan 31 ); ED5, energy density from foods and all beverages.
* Results are presented as regression coefficients (β) with their standard errors.
† Adjusted for age, education level (<9 years, 9–12 years and >12 years of schooling), smoking (never, past, current: 1–15, 16–24 or >24 cigarettes/d), monthly family income per capita (<3000 Yuan, 3000–5000 Yuan and >5000 Yuan), sedentary time and energy expended on moderate-to-vigorous physical activities (MVPAEE).
Table 5 Association of energy density with percentage body fat and waist circumferenceFootnote * among men (n 951), Southwest China, 2013
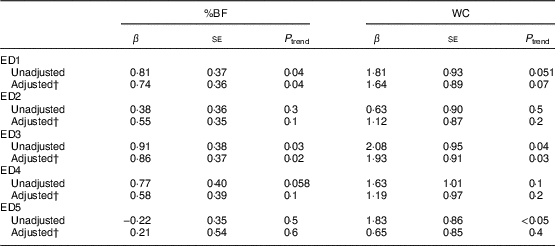
%BF, percentage body fat calculated according to sex-specific equations( Reference Liu, Sun and Sun 33 ); WC, waist circumference; ED1, energy density from foods only, excluding all beverages; ED2, energy density from foods and alcohol; ED3, energy density from foods and milk; ED4, energy density from foods and energy-containing beverages (>20·9 kJ (>5 kcal)/100 g )( Reference Ledikwe, Blanck and Khan 31 ); ED5, energy density from foods and all beverages.
* Results are presented as regression coefficients (β) with their standard errors.
† Adjusted for age, education level (<9 years, 9–12 years and >12 years of schooling), smoking (never, past, current: 1–15, 16–24 or >24 cigarettes/d), monthly family income per capita (<3000 Yuan, 3000–5000 Yuan and >5000 Yuan), sedentary time and energy expended on moderate-to-vigorous physical activities (MVPAEE).
Furthermore, for ED1, a 4·18 kJ/g (1 kcal/g) increase in ED was significantly associated with changes of body composition in both men and women (P<0·05), with the change being much higher in women than in men (P<0·01; data not shown).
Discussion
The present study shows that ED was positively associated with body composition among Chinese adults. In addition, the changes of body composition contributed per unit of ED were much higher in women than in men.
Evidence from previous observational studies on the association between ED and body composition is limited and conflicting. Three cross-sectional studies using data from large-scale surveys from the USA( Reference Mendoza, Drewnowski and Christakis 7 – Reference Ledikwe, Blanck and Khan 9 ) support our finding about the positive relationship between ED and BMI in both men and women, while two other studies with relatively small samples from the USA( Reference de Castro 15 , Reference de Castro 17 ) found a null association between them. The present study found that ED with foods only was associated with WC among women, which is in accordance with two cross-sectional studies conducted in Japan and Iran( Reference Murakami, Sasaki and Takahashi 12 , Reference Azadbakht, Haghighatdoost and Esmaillzadeh 14 ). In contrast, one study conducted in the USA found no significant association between ED and WC in women( Reference Grossniklaus, Dunbar and Gary 16 ). These discrepant findings might be explained, to some extent, by a series of methodological issues such as ethnic and socio-economic differences, and variation in the definitions of ED, which could lead to heterogeneity among different studies. Another reason may lie in the inconsistency of covariate inclusion among previous studies that might alter the true association. Furthermore, the misreporting of energy intake in this kind of research( Reference de Castro 15 , Reference Stookey 20 ) is an issue that needs to be considered. %BF, FMI and FFMI more accurately reflect body fatness and muscle mass, and therefore are preferred indicators of obesity compared with BMI or WC( Reference Vanitallie, Yang and Heymsfield 34 ). In the present study, we initially explored the potential link between ED and these indices among Chinese adults. As a result, we found significant positive associations in both men and women, which strengthened the underlying association between ED and obesity indirectly.
In the present analyses, we used various methods to calculate ED on the basis of one previous methodological study( Reference Ledikwe, Blanck and Khan 31 ) and made adjustments to fit for Chinese populations, according to the China food composition database( Reference Yuexin and Yaguang 24 ). The current study shows that ED based on most calculation methods (ED1, ED2, ED3 and ED4) was significantly associated with BMI, FMI and FFMI in both men and women, and the association remained stable no matter what other water-based drinks were included, whereas a significant association between ED5 and body composition was observed only among women. These findings thus reveal a disproportionate influence of beverages on the association between ED and body composition among Chinese men. Previous studies reported that foods and beverages have differing effects on energy intake and satiety, which might bias the association between ED and body composition in free-living populations towards the null when beverages are included in ED calculation( Reference Kant, Graubard and Mattes 26 , Reference Johnson, Wilks and Lindroos 38 ). However, gender variation on beverage influence in the present study has not been corroborated. This may be partially explained by the fact that beverages, especially tea beverages, were consumed in greater amounts by Chinese men and even concealed the true association between ED and body composition.
In addition, we speculate that alcohol and milk intakes among Chinese adults have no remarkable influence on the association between ED and body composition because the association was not weakened among ED2 and ED3. Energy-containing beverages should also be interpreted with caution when calculating ED, given the fact that the association between ED4 and body composition was apparently muted or even missed.
It is of interest to note that for ED with foods only, the changes of body composition contributed per unit of ED increase were much higher in women than in men. This finding suggests that among the adult Chinese population, ED may have a much greater impact on women’s body composition than on men’s, which also implies that dietary management of ED may provide greater benefits in the prevention and treatment of obesity among women compared with men.
There are some strengths in our study. First, the present study initially used five calculation methods to calculate ED of Chinese adults. Also, to our knowledge, the present study is the first to probe into relationships between ED and FMI, FFMI and other indicators of obesity like %BF in adult populations, which extends the scope and depth of existing studies. Second, we used measured anthropometric data, including height and weight, to calculate BMI, %BF and other indices in our study, instead of self-reported data such as previous studies used from large-scale surveys( Reference Ledikwe, Blanck and Khan 9 , Reference Stookey 20 , Reference Howarth, Murphy and Wilkens 39 ). In addition, misreporting of daily energy intake has been demonstrated to be a concern in dietary data collection, which may become particularly problematic with the understanding and treatment of obesity. The present study took into full consideration the issue of misreporting at the beginning of the analysis by excluding participants who both over- and under-reported daily energy intake. Finally, the present study collected information on several important confounding variables related to both ED and body composition, such as MVPAEE and smoking status.
Several limitations should also be mentioned. First, results from our study cannot provide any direct causality between ED and body composition in view of the cross-sectional design. Furthermore, 98·6 % of the dietary data in our study were collected during autumn and winter, which may result in temporal variations because seasonal effects have been shown not only on food but also on nutrient intakes( Reference Shahar, Yerushalmi and Lubin 40 ). For example, red meat and other high energy-dense foods are eaten more frequently during winter and therefore increase the ED of the entire meal( Reference Willett 41 ). Finally, after excluding misreporters and participants without data on anthropometric measurements or dietary recalls, the sample size of the present analysis is relatively small, which may diminish the statistical power of significant results that reflect a true association.
Conclusions
The present study identified a positive association between ED and body composition in both Chinese men and women, and confirmed the profound effects that beverages have on the association among men.
Acknowledgements
Acknowledgements: All participants are gratefully acknowledged. Financial support: All phases of this study were supported by a research grant from the National Nature Science Foundation of China (number 81472976) and a research grant from the National 1000 Young Talents Program. The funders had no additional role in the design, analysis or writing of this article. Conflict of interest: The authors reported no potential conflict of interest. Authorship: G.C. designed the research; J.Y. performed initial data analyses and wrote the manuscript; H.X., Y.C. and X.Z. edited the manuscript; L.Q. and Y.G. provided critical input on the data analyses; G.C. supervised the study. All authors critically reviewed and approved the final manuscript. Ethics of human subject participation: This study was conducted according to the guidelines laid down in the Declaration of Helsinki and all procedures involving human subjects were approved by the Ethics Committee of Sichuan University. Written informed consent was obtained from all the participants before they took part in the measurement procedures.


