


State legalization of cannabis is increasing in the United States. While California was the first state to legalize medical cannabis in 1996, cannabis is now legal for medical use in thirty-three states and the District of Columbia(1). Furthermore, recreational use of cannabis is currently legal in eleven of those states and the District of Columbia(1). According to a 2015 survey of the National Survey of Drug Use and Health, approximately 22·2 million Americans reported using cannabis within the last month(2). Illicit cannabis use may also be increasing in states with laws for legal medical marijuana(Reference Hasin, Sarvet and Cerdá3).
Cannabis has been shown to stimulate appetite and increase food intake(Reference Mattes, Engelman and Shaw4–Reference Foltin, Fischman and Byrne7). Study participants who used cannabis had an acute increase in the intake of sweet snack foods in laboratory settings(Reference Foltin, Fischman and Byrne7). Foltin and colleagues conducted experimental trials on nine male subjects and found an acute increase in caloric intakes (12133·6–18409·6 kJ/day) on days when subjects smoked marijuana cigarettes compared with placebo (10041·6–14225·6 kJ/day)(Reference Foltin, Brady and Fischman6). In a subsequent study, food consumption was tracked by measuring plate waste; on days when cannabis was consumed, subjects had higher caloric intakes (40 %) and higher intakes of sweet solid snacks such as candy bars(Reference Foltin, Fischman and Byrne7). Similar findings have been reported at a population level(Reference Smit and Crespo8). Smit and Crespo evaluated dietary intakes of cannabis users using the National Health and Examination Survey III (1988–94) (NHANES III). Food and beverage intakes were assessed with an FFQ and a 24-h recall(Reference Smit and Crespo8). Frequent cannabis users (those who used cannabis over eleven times per month) consumed more calories (+2435·09 kJ among heavy users compared with non-current users), more salted snacks (+3·6 times a month among heavy users compared with non-current users) and a higher intake of alcohol (+12 g alcohol among heavy users compared with non-current users)(Reference Smit and Crespo8).
Such reports suggest that cannabis users are likely consuming diets of poor quality. While the intakes of single nutrients, select food groups and total calories have been described for cannabis users in the past three decades, the overall dietary quality among cannabis users has not been explored. HEI is a diet quality score that assesses adherence to the Dietary Guidelines for Americans (DGA). HEI is updated approximately every 5 years after the new DGA is published(9). HEI-2010 and HEI-2015 were valid and reliable diet quality indices that assessed adherence to the DGA-2010 and DGA-2015, respectively(Reference Reedy, Lerman and Krebs-Smith10,Reference Guenther, Kirkpatrick and Reedy11) . HEI-2015 is inversely associated with the risk of all-cause mortality from cancer, CVD and all-cause mortality(Reference Panizza, Shvetsov and Harmon12).
Thus, our objective was to ascertain whether cannabis users report usual diets that differ in quality from those of never or previous users using the HEI-2010 and HEI-2015.
Methods
Overview of the National Health and Nutrition Examination Survey
Data were acquired from six 2-year cycles of the NHANES from 2005 to 2016. NHANES is a continuous, nationally representative survey of non-institutionalized US adults and children conducted by the Centers for Disease Control and Prevention(13). Researchers from NHANES collect health information from approximately 5000 participants a year using a complex, multistage probability sampling design. Self-reported questionnaire, exam and laboratory data are acquired, which provide information on dietary intake, medical status and health-related behaviours. Interviews are conducted at participants’ homes, and additional dietary interviews, laboratory workups and examinations are conducted in a specialized mobile examination centre (MEC) by physicians, medical technicians and highly trained dietary and health interviewers. The first diet recall interview was conducted in the MEC using a well-accepted, USDA-automated multi-pass method(Reference Blanton, Moshfegh and Baer14). A second diet recall was conducted via a telephone call 3–10 d later using the measuring tools provided(15). Detailed information on the methods and design of the NHANES study is available online(13).
Subject selection
Data merged from NHANES years 2005–16 provided a total of 60 936 participants. Participants are selected for the drug use questionnaire in NHANES based on age with lower and upper age limits as cut-off points. The lower age cut-off has changed between 18 and 20 years in several NHANES cycles; the upper age cut-off is 59 years. Therefore, the initial analytic sample included NHANES participants aged 20–59 years (n 22 850) (Fig. 1). Participants were excluded if their dietary data were deemed unreliable, or if reported calories equalled zero (n 2278). The NHANES interviewer assessed the reliability of the dietary recall based on the NHANES participants’ responses. Responses can be assigned as reliable if four out of five steps of the AM/PM interview were completed, food/beverages consumed for each reported eating occasion were identified and all relevant variables had a value. Data were deemed not reliable if at least four out of five steps were not completed, or if there were incomplete variables. Our inclusion criteria included those with a ‘1’ as their response to the reliability variable (DR1DRSSTZ or DR2DRSTZ in NHANES). Participants were also excluded if drug use data were not available (N 1776), if their responses to the drug use questionnaire were not reliable (n 194) or if they were pregnant or lactating (n 747), for a final sample size of 17 855 participants.

Fig. 1 Flowchart showing how the sample was drawn with subjects aged 20–59 years from six 2-year cycles spanning 2005–2016 and the inclusion and exclusion criteria. Subjects were selected if: (1) they had reliable dietary data (as determined by the dietary recall variable DR1DRSSTZ and DR2DRSTZ) and non-zero calorie intake, (2) they completed the required drug use questionnaire, (3) their responses to the drug use questionnaire were reliable (subjects were excluded if they answered ‘don’t know’ or refused the question ‘ever used marijuana or hashish?’; they were also excluded if they responded ‘yes’ to ‘ever used marijuana or hashish’ but then did not reply to the follow-up question ‘last time used marijuana or hashish’), and (4) they were not pregnant or lactating
Demographic information
Ages were reported as means and standard errors as well as three groups: 20–31, 32–45 and 46–59 years. Age categories were used to better visualize possible differences across cannabis use categories. Education was stratified as <9th grade, 9–11th grade, a high school graduate or General Equivalency Diploma (GED), some college or associate degree, or a college graduate or above. Race and ethnicity categories include Mexican American, other Hispanic, non-Hispanic white, non-Hispanic black or other. Poverty-to-income ratio (PIR) was categorized as follows: <1·35, 1·35–1·85 and >1·85. These strata have been used by other researchers and indicated cut-offs for federally funded programmes (Supplemental Nutrition Assistance Program, and Women Infant and Children)(Reference Blumberg, Frei and Fulgoni16).
Cannabis use
The drug use questionnaire was designed to assess self-reported drug use, including cannabis. Data from the drug use survey were used to categorize cannabis use groups. Questions from the drug use questionnaire included ‘ever used marijuana or hashish?’ and ‘last time used marijuana or hashish?’ Drug use data were deemed unreliable if participants reported ‘yes’ to ‘ever used marijuana or hashish?’ and then did not respond to ‘last time used marijuana or hashish?’ Current cannabis users were defined as those who reported using marijuana within the last 30 days (n 2510). Previous users were defined as those who reported marijuana use but not within the last 30 days (n 7127), and never users reported never using marijuana (n 8216). Previous literature has used similar definitions of cannabis users(Reference Penner, Buettner and Mittleman17).
Diet quality measures
Both HEI-2010(Reference Guenther, Casavale and Reedy18) and HEI-2015(Reference Krebs-Smith, Pannucci and Subar19) were used to evaluate dietary quality. HEI-2010 and HEI-2015 have a total diet quality score of 100, with a higher score indicating a better diet quality. The HEI-2010 score has 12 components and includes both dietary adequacy (dietary components to consume more of) and moderation components (dietary components to consume less of). Sodium, refined grains and empty calories – are the components one must consume in moderation and thus are reverse-scored (higher points assigned for lower consumption). HEI-2015 has thirteen components as the empty calorie component of HEI-2010 was divided into saturated fat and added sugars (changes in HEI-2010 and HEI-2015 are detailed online)(9). Higher scores indicate better adherence to both DGA-2010 and DGA-2015.
The HEI-2015 updates incorporated some changes to component areas. In HEI-2010, if total protein was not met, legumes were allocated to total protein and not counted towards vegetables. However, in HEI-2015, legumes are allocated towards total vegetables, greens and beans, total protein foods and in the seafood and plant proteins components. The ‘empty calories’ component of HEI-2010 are excessive calories from solid fats, alcohol and added sugars (SOFAAS). The updated DGA (2015) provides guidance for limiting added sugars to <10 % of calories. Because of this change, the SOFAAS component of HEI-2010 was removed and replaced with two components – saturated fats and added sugars. Alcohol is no longer represented as a component; however, calories from alcohol are taken into account as total calories per day(20). The other components in HEI-2015 are unchanged from HEI-2010, and details on scoring can be found online(9).
Because foods are complex mixtures, they must be disaggregated into food group components. These data were derived from the US Department of Agriculture (USDA) cycle-specific food patterns equivalents database (FPED)(21). The FPED takes dietary recall data from NHANES and converts it into usable food group components for HEI-2010 and HEI-2015. Nutrient contents for dietary recalls were acquired from cycle-specific versions of the USDA Food and Nutrient Database for Dietary Studies. Usual intakes were calculated using the Markov Chain–Monte Carlo (MCMC) method as recommended by the National Cancer Institute (NCI)(20). Details on the model are described under statistical analyses.
Secondary analyses: alcohol measures and regression models
Alcohol measures
Because of the differences in the way calories from alcohol are applied to HEI-2010 and HEI-2015, alcohol intake was examined separately using data from day 1 dietary recall. It was expressed as both drinks per day and grams of alcohol per day.
Regression models
In addition to evaluating the estimated usual intakes across cannabis use groups, regression models were run utilizing a simple method provided by NCI(22). Dietary data for the regression models came from the average of HEI scores from day 1 and day 2 24-h dietary recalls using appropriate survey weights. Models were run with further adjustments for gender, age, PIR, ethnicity, education, alcohol and current smoking status.
Statistical analyses
All analyses were run using SAS, version 9.4 (SAS Institute, Cary, NC). The NHANES uses a complex multistage probability design; therefore, appropriate design characteristics (primary sampling units and strata) and sample weights were applied. All demographic variables (gender, race/ethnicity, PIR, age, age group and education level) were expressed as means (and standard errors) of the proportion of population for each cannabis use group. These estimates were then compared across cannabis use groups using χ 2 tests of independence for categorical variables and t-tests for continuous variables.
Usual intakes were calculated utilizing data from both day 1 and day 2 dietary recalls with the multivariate MCMC approach developed by the NCI(22,Reference Zhang, Midthune and Guenther23) . The MCMC method can estimate usual intakes from one dietary recall as long as there is a second dietary recall in at least a subset of the sample; the latter will provide a means to estimate both within- and between-subject variability. The MCMC method adjusts for measurement error, considers skewness and ensures that foods are episodically consumed and not consumed in isolation from one another. The MCMC method models all components of the HEI, and therefore accounts for a correlation between scoring components and energy, and accounts for a correlation between all constituents and energy. The MCMC method provides the best estimate of a population’s usual intake using balanced, repeated replications. Additional information on the MCMC method can be found online(22). The macros provided by NCI for HEI-2010 were modified to align with the variables needed for HEI-2015. The covariates included in the MCMC models were weekday (Monday–Thursday)/weekend (Friday–Sunday) flag, and dietary recall sequence (day 1 or day 2) and age. Differences in HEI scores across cannabis groups were assessed via t-tests with P < 0·017 deemed significant after Bonferroni adjustments.
Alcohol intakes were compared across cannabis use groups using a multiple regression model adjusting for age, gender, ethnicity, PIR and education level. Note that subjects with missing values for PIR or education level covariates were not included in the alcohol analysis. Differences in HEI scores were also assessed using regression models that accounted for age, gender, PIR, ethnicity, education level, alcohol (g) and current cigarette smoking. While these data do not represent the usual intake of the population, they provide another model for assessing differences in food intakes among groups and are reported in online supplementary material, Supplemental Table 1.
Results
Demographics
A total of 17 855 US adults were included in the current study (Fig. 1), of which 8216 were classified as never users, 7127 as previous cannabis users and 2510 as current users. Current cannabis users were more likely male (63·4 %), whereas never users were more often women (55·5 %) (Table 1). Current cannabis users were younger (35·2 ± 0·4) compared with previous users (40·9 ± 0·2, P < 0·001) and never users (40·2 ± 0·3, P < 0·001). Current cannabis users also tended to be poorer on average (PIR = 2·55 ± 0·1) compared with previous users (PIR = 3·3 ± 0·04) and never users (PIR = 2·9 ± 0·1). A higher percentage of current cannabis users fell in the PIR < 1·35 category (32·9 ± 1·72) compared with previous users (18·8 ± 0·8) and never users (25·2 ± 1·1). A lower percentage of current cannabis users graduated college (19·0 ± 1·7) than previous users (32·3 ± 1·2 %) and never users (31·2 ± 1·3 %). Further details on demographics are described in Table 1.
Table 1 Demographic characteristics of NHANES 2005–16 adult participants (n 17 855) stratified by cannabis use groups*,†,‡

PIR, poverty-to-income ratio; GED, General Equivalency Diploma.
*All data were adjusted for complex sample design of NHANES and day 1 sample weights; superscripted letters represent significant differences among continuous variables at P < 0·017 after Bonferroni adjustments.
†Numbers in cells reflect the mean proportion of population (and standard error) within the cannabis use category.
‡Significance using χ 2 test of independence, P < 0·00.
§Alcohol consumption was reported using regression models (least square means) and was adjusted for age (as a continuous variable), gender, PIR (as a continuous variable), ethnicity, education and smoking status.
Usual intakes: dietary quality using Healthy Eating Index-2010
Total dietary quality (HEI-2010) scores were significantly lower among current users (51·8 ± 0·7) compared with never users (57·7 ± 0·4) and previous users (56·2 ± 0·4) (Table 2). For total vegetables, current cannabis users scored significantly lower (3·0 ± 0·1) than never users (3·7 ± 0·04) and previous users (3·6 ± 0·03). Never users scored higher than current cannabis users for total fruit (3·0 ± 0·1 v. 2·2 ± 0·1), whole fruit (3·3 ± 0·1 v. 2·2 ± 0·1) and whole grains (3·0 ± 0·1 v. 2·0 ± 0·1). There was no difference across cannabis use groups for dairy, total protein foods or fatty acid ratio scores. Current cannabis users scored significantly higher than never users for sodium (4·1 ± 0·2 v. 3·3 ± 0·1) and refined grain scores (6·8 ± 0·2 v. 5·8 ± 0·1) consumption. Thus, current cannabis users consumed less sodium and lesser refined grains per 1000 kcal than never users. Current cannabis users had lower (11·5 ± 0·4) empty calorie (SOFAAS) scores compared with never users (14·0 ± 0·1) and previous cannabis users (13·0 ± 0·2).
Table 2 HEI-2010 and HEI-2015 scores (total and component) of NHANES 2005–16 adults stratified by cannabis use estimated by the multivariate Markov Chain–Monte Carlo method*,†
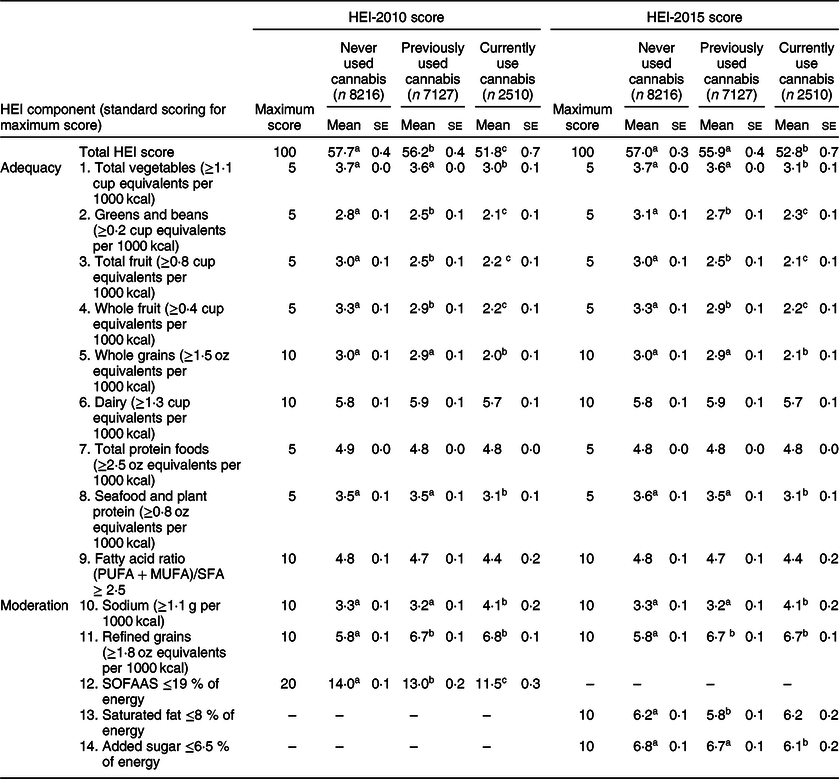
HEI, Healthy Eating Index; NHANES, National Health and Nutrition Examination Survey; SOFAAS, solid fats, alcohol and added sugars.
*Multivariate Markov Chain–Monte Carlo method was used to determine usual intakes simultaneously after adjusting for age, day of the week and energy; all data were adjusted for complex sample design of the NHANES and appropriate sample weights.
†Means with different superscripts are significantly different using Bonferroni-adjusted P-value <0·017, as assessed by t-tests.
Usual intakes: dietary quality using Healthy Eating Index-2015
Current cannabis users scored lower in the total score for HEI-2015 (52·8 ± 0·7) compared with previous cannabis users (55·9 ± 0·4) and never users (57·0 ± 0·3) (Table 2). Current cannabis users scored lower compared with never users in total vegetables (3·1 ± 0·1 v. 3·7 ± 0·04), total fruit (2·1 ± 0·1 v. 3·0 ± 0·1) and whole fruit (2·2 ± 0·1 v. 3·3 ± 0·1). Additionally, current cannabis users scored lower compared with previous cannabis users in total vegetables (3·1 ± 0·1 v. 3·6 ± 0·0), whole fruit (2·2 ± 0·1 v. 2·9 ± 0·1) and seafood and plant protein (3·1 ± 0·1 v. 3·5 ± 0·1). Current cannabis users scored higher on sodium intake (4·1 ± 0·2) compared with previous users (3·2 ± 0·1) and never users (3·3 ± 0·1), indicating less total sodium intake among current users than previous or never users. There were no differences between the groups for dairy, total protein foods or fatty acid ratio. There were no differences between current cannabis users and previous users or never users for saturated fat. However, previous cannabis users scored lower than never users (5·8 ± 0·1 v. 6·2 ± 0·1). Current cannabis users scored lower on added sugar compared with both previous users (6·1 ± 0·2 v. 6·7 ± 0·1) and never users (6·1 ± 0·2 v. 6·8 ± 0·1).
Radar graphs
Radar graphs were chosen to visually display differences in diet quality – both total and subcomponent scores – across cannabis groups. Individual component scores of HEI-2010 and HEI-2015 were converted to a percentage of maximum score and plotted on radar graphs along with the raw total score, which is based out of 100 points (Fig. 2). For the HEI-2010 radar graph, differences can be observed for total vegetables, total fruit, whole fruit, whole grains and SOFAAS. For the HEI-2015 radar graph, group differences can be visualized for total vegetables, total fruit, whole fruit, whole grains and seafood and plant protein.
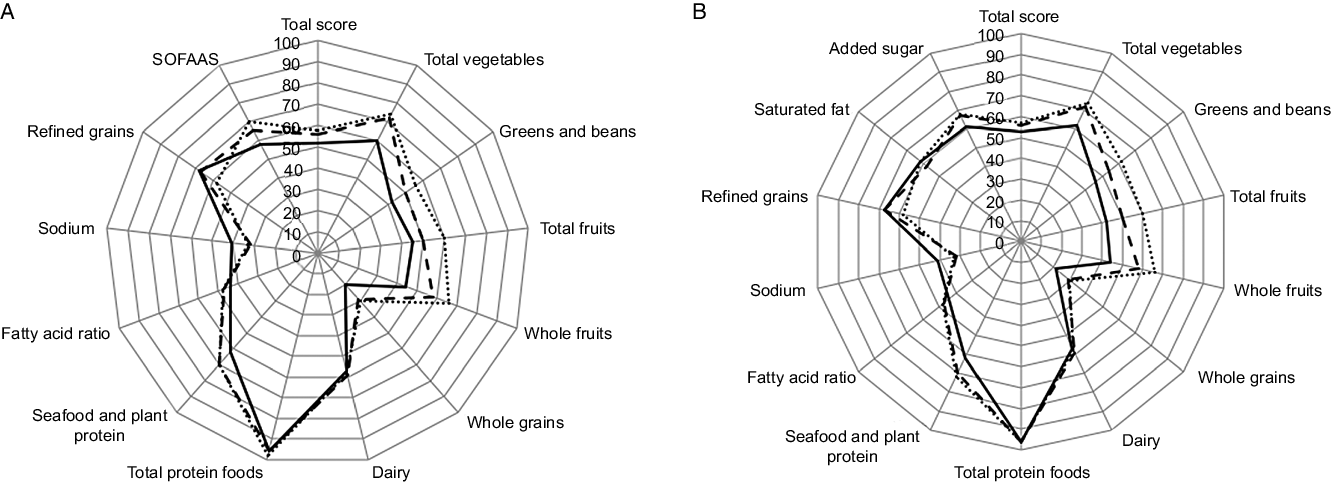
Fig. 2 Total score and individual component scores of cannabis use groups for Healthy Eating Index (HEI)-2010 (A) and HEI-2015 (B). Subcomponent scores shown are percentages of total possible points (scores were divided by total possible points to get a percentage); the total score remains out of 100. Dotted lines represent never users, long dashed lines represent previous users, and solid black line represents current cannabis users
Secondary analyses
Alcohol intakes
As shown in Table 1, alcohol intake was significantly higher among current users (24·9 ± 1·4 g/d) compared with both previous users (13·4 ± 0·6 g/d) and never users (8·0 ± 0·4 g/d) (P < 0·001 for all groups) after adjusting for gender, age, PIR, ethnicity, education and current smoking status. Similarly, when alcohol intake was examined as drinks per day, and adjusting for gender, age, PIR, ethnicity, education and smoking status, alcohol intake was higher among current users (1·1 ± 0·1 drinks per day) compared with both previous (0·6 ± 0·0 drink per day) and never users (0·3 ± 0·0 drink per day) (P < 0·001 for all groups).
Regression models
After adjusting for age (as a continuous variable), gender, PIR (as a continuous variable), ethnicity, education level, alcohol (g) and smoking status, there were no differences across groups in either total HEI-2015 or HEI-2010 scores. Current cannabis users continued to have a better (higher) score compared with other groups for sodium. Results are available for HEI-2010 and HEI-2015 using the regression analysis (least square mean) in online supplementary material, Supplemental Table 1.
Discussion
The current study is the first, to our knowledge, to estimate dietary quality among cannabis users based on HEI-2010 and HEI-2015 using data from the NHANES. Overall, current cannabis users had a lower total diet quality score compared with previous and never users with both HEI-2010 and HEI-2015. Lower diet quality scores among cannabis users are somewhat consistent with reported observations of increased intakes of salty snack foods and regular soda among heavy cannabis users (consumed cannabis over eleven times per month) compared with non-users(Reference Smit and Crespo8). However, the better scores for sodium intakes and those of refined grains, among current cannabis users compared with never users, were unexpected. Our findings of lower sodium intakes among cannabis use groups are consistent with the earlier NHANES report where, after adjusting for age, sex, education and energy intake, current cannabis users (5–10 times per month) consumed less sodium (3234 mg) than non-users (3634 mg)(Reference Smit and Crespo8).
The change in the empty calorie component (SOFAAS) from HEI-2010 to HEI-2015 provided a unique perspective on saturated fat, added sugar and alcohol intake among cannabis users. Using HEI-2010 scores, cannabis users had significantly lower empty calorie scores (11·5 ± 0·3) compared with previous (13·0 ± 0·2) and never users (14·0 ± 0·1). However, in HEI-2015, current cannabis users’ saturated fat scores were no different from those of previous or never users, and only added sugars were lower among current cannabis users (6·1 ± 0·2) compared with previous (6·7 ± 0·1) and never users (6·8 ± 0·1). The primary difference in HEI-2015 was that excessive calories from alcohol were no longer considered and saturated fat and added sugars were scored separately. This large difference in SOFAAS scores led us to investigate alcohol intake separately, and ascertain whether the inclusion of alcohol as part of the SOFAAS score was a driver for the lower SOFAAS score in HEI-2010. We observed a significantly higher alcohol intake among current cannabis users compared with previous and never users, which is consistent with previous literature(Reference Smit and Crespo8). When evaluating the FFQ data from NHANES III (1988–94), Smit and Crespo found higher alcohol intakes among cannabis users (22 g/d after adjusting for age, sex, education and energy intake) compared with non-users (10 g/d)(Reference Smit and Crespo8).
Higher total diet quality scores of HEI-2015 are associated with improved health. HEI-2015 is inversely associated with all-cause mortality, and mortality from cancer and CVD(Reference Panizza, Shvetsov and Harmon12). Findings of the current study indicate that cannabis users have lower diet quality compared with non-users, which may put the current cannabis use group at a higher risk for chronic diseases, such as cancer and CVD, where dietary behaviours have an influential role. While differences in total diet quality scores were observed, the magnitude of that difference between the total score for cannabis users compared with previous and never users was not more than five points, and therefore may not be meaningful in terms of long-term health. All three cannabis use groups had low total HEI scores, indicating all groups would be advised to improve dietary quality.
We observed lower diet quality scores among cannabis users compared with non-users. These findings appear counterintuitive to cross-sectional studies showing an inverse relationship between cannabis use and diabetes(Reference Rajavashisth, Shaheen and Norris24), fasting insulin(Reference Penner, Buettner and Mittleman17), HOMA-IR(Reference Penner, Buettner and Mittleman17) and a smaller waist circumference(Reference Penner, Buettner and Mittleman17). More research is needed to assess the relationship of cannabis use, diet and chronic diseases, especially longitudinally. Further studies evaluating flavour preference, taste and smell changes, hunger and satiety cues and food selection should be conducted to evaluate the extent and consistency of the observed dietary differences, which may accompany persistent cannabis use. Long-term effects of cannabis use on weight, body composition, diabetes prevalence and other indicators of metabolic syndrome are also needed.
Strengths and limitations
Previous research has looked at food intake in a controlled laboratory setting(Reference Foltin, Brady and Fischman6,Reference Foltin, Fischman and Byrne7) and at individual components in an FFQ and diet recalls(Reference Smit and Crespo8). While there is a common belief that cannabis users consume more ‘junk foods’ because they experience ‘the munchies’, this is the first study, to our knowledge, in which usual dietary intakes were evaluated among groups that differ in reported cannabis use. Our study utilized a large sample (17 855 participants) and estimated usual dietary intakes using a multivariate MCMC method. This modelling approach allows one to model all the components of the HEI simultaneously, accounting for variations between individuals and within individuals (day-to-day variation), and is among the methods recommended by the NCI to estimate a population’s usual food intake(22). Moreover, both episodically consumed components and those consumed daily are modelled in relation to energy intake(Reference Zhang, Midthune and Guenther23). Dietary quality scores based on both HEI-2010 and HEI-2015 estimated in this way provide additional insights and the ability to compare and contrast usual intakes across user groups. The use of two diet quality scores in the same population sample allows one to glean the differences among empty calorie components and intakes of alcohol in g/day and drinks per day.
The majority of NHANES data are self-reported, and although the data are confidential, answers to sensitive questions relating to drug use may still be influenced by recall bias and lack of trust. Assessing the dietary intake via a 24-h recall also poses similar challenges to validity, though usual intakes were estimated using data from two recall days and sophisticated modelling. While trained NHANES interviewers assessed diet recall, evidence suggests that certain population groups, especially those who are obese, underreport intakes(Reference Moshfegh, Rhodes and Baer25).
The drug use questionnaire was limited, and it was not known if cannabis was consumed for medicinal or recreational purposes. While the frequency of use was assessed with the questionnaire, it ascertained how many days in the last month someone used marijuana. This question could be misleading as it does not look at the number of times cannabis is consumed in a day. Nor can the survey assess the percentage of the two primary bioactive cannabinoids – δ-9-tetrahydrocannabinol (THC) or cannabidiol (CBD) – consumed by the participant. Given the nature of this self-reported, cross-sectional data, it is important to note that the percentage of THC and CBD, and the perception of its use, has changed over time; there is no way to account for this in NHANES data, which remains an intrinsic limitation of the current study. The primary purpose of the current study was to evaluate dietary quality; however, evaluating additional health outcomes such as BMI, blood pressure, fasting glucose, fasting insulin and cholesterol would have provided a broader picture of health implications among cannabis users.
With the continued legalization of cannabis use at the state level, it is important to research how cannabis influences food intake and the nutrition status of individuals and of the population. Future research should include prospective studies monitoring food intake, body weight and other nutrition-related health outcomes, such as blood pressure, blood glucose and insulin, among cannabis users. Studies evaluating caloric intake and dietary patterns should include an assessment of alcohol intake.
Conclusions
Current cannabis users appear to consume diets of lower dietary quality, and possibly greater alcohol intake, compared with previous and never users. Current cannabis users also consumed diets lower in total vegetables, greens and beans, total fruit and whole fruit compared with previous and never users. While current cannabis users scored the lowest for total diet quality, scores of participants across all three groups ranged from 52 to 57 out of a possible 100, indicating all three groups should improve adherence to the DGA.
Acknowledgements
Acknowledgements: The authors would like to acknowledge Dr. Victor Fulgoni III, senior vice president at Nutrition Impact, LLC, for his substantial contributions in performing data analysis and reviewing the manuscript. The authors thank Dr. Fulgoni and his team for their invaluable technical support in completing the usual intake analysis. Financial support: No funding was received for the current study. Conflict of interest: None. Authorship: Amy Gelfand and Dr. Tangney each contributed to the methodology and writing and editing of the manuscript. Amy Gelfand developed the idea of investigating diet quality among cannabis use groups, and data management and correspondence with Dr. Fulgoni and his team for data analysis. Dr. Tangney oversaw the methodology and analysis of data. Amy Gelfand wrote the initial draft of the manuscript, which was then edited by Dr. Tangney. Ethics of human subject participation: This research was conducted utilising a public use dataset with de-identified data; therefore, it was exempt from IRB review.
Supplementary material
For supplementary material accompanying this article visit https://doi.org/10.1017/S1368980020001846


