


As in many developed countries in the world, New Zealand has experienced a rapid rise in the prevalence of children who are overweight or obese( 1 ) and now has one of the highest childhood obesity rates in the world( 2 ). Even pre-schoolers are affected by this public health crisis; weight and height measurements taken from 4-year-olds every year from 2009 to 2012 have revealed that one in three are overweight or obese, with no improvements seen over time. Māori and Pasifika children and those living in deprived neighbourhoods had an even greater prevalence of excess weight( Reference Rajput, Tuohy and Mishra 3 ).
A recent Lancet series on obesity emphasised that there is a ‘reciprocal … interaction between the environment and the individual’ whereby ‘environmental factors affect personal preferences and demands for unhealthy foods, which, as part of a vicious cycle, encourage environments to continue promoting unhealthy foods’( Reference Roberto, Swinburn and Hawkes 4 ). This elucidates the importance of creating healthy environments for young children who are still forming food preferences, eating behaviours and physical activity patterns, in order to break the ‘vicious cycle’ of demand for nutrient-poor and energy-dense foods and a sedentary lifestyle. Indeed, many commentators have concluded that a focus on the early years is the most cost-effective and efficacious strategy against obesity( Reference Larson, Ward and Neelon 5 – Reference Dennison and Faith 8 ) and that in order to see any progress on obesity prevention, healthy environments in the early years must be assured( Reference Hawkes 9 ).
Early childhood education (ECE), although not compulsory, has become a ubiquitous experience for young New Zealanders and a key environment in their lives. Last year, nearly 96 % of children had attended a licensed ECE service for at least 6 months before starting school at the age of 5 years, with the majority attending since they were 3 years old for an average of more than 20 h per week( 10 ). New Zealand has a diverse ECE sector, consisting of both public and private providers adopting a wide variety of philosophies. However, all licensed services are required to meet the Ministry of Education’s licensing criteria under the Education (Early Childhood Services) Regulations 2008, including the following related specifically to nutrition:
HS19: Food is served at appropriate times to meet the nutritional needs of each child while they are attending. Where food is provided by the service, it is of sufficient variety, quantity, and quality to meet these needs. Where food is provided by parents, the service encourages and promotes healthy eating guidelines( 11 ).
The only survey of New Zealand’s food and nutrition environment in child-care services was conducted in 2007 and then repeated in 2009 with the purpose of monitoring the Healthy Eating Healthy Action policy and Mission-On health promotion initiatives in schools and ECE services( Reference Pledger, Black and Cumming 12 ). Paper-based questionnaires were completed by a nationally representative sample of 562 services in 2007 and 637 services in 2009 (excluding Kōhanga Reo Māori cultural-immersion services but including a small number of home-based services), resulting in response rates of 68 % in 2007 and 77 % in 2009. Overall, the surveys found a large diversity in practice with regard to nutrition, and reported some statistically significant improvements over the 2-year period regarding written guidelines for foods and beverages and a decreasing use of unhealthy foods in fundraising. However, there were many missing data due to the paper-based mode of collection and it was unclear how many ECE services provide meals and snacks to children daily. Also, written policies and information regarding food-related behaviours were not collected in these surveys. It has been 5 years since the 2009 survey and it is possible that the food and nutrition environment has altered, given that a change of government in 2008 saw the end to funding for Mission-On and then the Healthy Eating Healthy Action policy and associated funding for obesity prevention programmes ceased in 2012( Reference Swinburn and Wood 13 ).
The current paper presents data collected in a 2014 survey of child-care services in New Zealand that update and extend our understanding of the nutrition-related policies and practices relevant for 3- and 4-year-olds. First, we consider the comprehensiveness and strength of written policies, evaluated using a standard tool. We then describe the provision of food to children daily, on special occasions and for fundraisers within ECE environments. Food-related behaviours and nutrition education practices are then described, followed by perceived barriers to promoting healthy food. Comparisons with the earlier survey data are discussed where applicable, and differences by type of ECE service and neighbourhood deprivation are also explored.
Methods
This was a cross-sectional online survey completed by one representative from each service listed in the Ministry of Education database of Early Childhood Education Services (August 2013) within the three District Health Board areas of Auckland, Counties Manukau and Waikato. Infant and toddler centres, home-based services, playgroups, unlicensed crèches and hospital-based services (for patients) were excluded from the research as they tend to cater for younger children and have different licensing criteria. All other licensed services with a valid email address in the target population (n 847) were invited to participate via email, with the researchers telephoning services to obtain an email address when it was missing from the database (25 % of the database). The focus on these three regions of New Zealand and children aged 3 and 4 years was to align with the recruitment area for the Growing Up in New Zealand longitudinal cohort and its pre-school data collection wave( Reference Morton, Atatoa Carr and Grant 14 ) to facilitate future research about the influence of ECE environments on child health outcomes (in forthcoming publications). These regions collectively have an ethnically and socio-economically diverse population, containing one-third of New Zealand’s children aged under 5 years( 15 ).
The sixty-five-item questionnaire for the survey was adapted from the Director’s Child Care Nutrition and Physical Activity Assessment Survey( Reference Henderson, Grode and Middleton 16 ) and the Nutrition and Physical Activity Self-Assessment for Child Care tool( Reference Benjamin, Neelon and Ball 17 ), both of which have been validated using direct observation, document review and structured interviews administered alongside the self-report questionnaire. Previous New Zealand surveys of child-care nutrition environments( Reference Pledger, Black and Cumming 12 ) were used to ensure appropriate response categories and the questionnaires from several other similar studies – one of which has been subsequently validated( Reference Dodds, Wyse and Jones 18 ) – also informed item wording and response categories( Reference De Silva-Sanigorski, Bell and Kremer 19 , Reference Parker, Lloyd-Williams and Weston 20 ). Representatives from the ECE and health promotion sectors, and several public health researchers including Māori and Pasifika cultural advisors were consulted during the development of the survey objectives, design and questionnaire.
Once developed, the questionnaire was uploaded to a secure online survey software tool (SoGoSurvey; http://www.sogosurvey.com) and tested. A pilot study of five child-care services (of differing size and type) was undertaken in early 2014 which included interviews with respondents to discuss any issues. Subsequent changes were made to the mode of delivery for invitations (from postal to email) and some wording in the questionnaire and instructions to aid understanding.
Data were collected via the online survey from 30 April to 21 July 2014. A maximum of three reminder emails and one follow-up telephone call were made to non-respondents, with a fluent Māori-language speaker telephoning the Māori services. Respondents were requested to email, fax or upload to the website their written nutrition, physical activity and wellness/hauora policies and/or menu if applicable.
Written policies were rated using the Wellness Child Care Assessment Tool (WellCCAT) developed in 2011 by the Rudd Centre for Food Policy and Obesity Yale University, which has been validated and found reliable in a study of ninety-four policies for 210 child-care centres in Connecticut, USA( Reference Falbe, Kenney and Henderson 21 ). The present authors modified this tool so the wording was consistent with the New Zealand Food and Nutrition Guidelines for Healthy Children and Young People( 22 ) and the Heart Foundation’s recommendations for nutrition policies( 23 ). Changes to the WellCCAT were approved by the developers to ensure internal consistency and construct validity were not compromised. The resulting sixty-three-item WellCCAT-NZ tool quantitatively evaluates five areas of child-care policies: (i) nutrition education; (ii) nutrition standards for foods and beverages; (iii) promoting healthy eating in the child-care setting; (iv) physical activity; and (v) communication and evaluation. Each of the sixty-three items is assigned a score of 0–2: 0 if the statement is not included in the policy, 1 if the statement is weakly worded (e.g. ‘may’, ‘should’, ‘encourage’, ‘suggest’, etc.) or 2 if the statement is specific and stongly worded; then an average score is derived for each section. The total scale and each subscale produce a score for comprehensiveness and strength from 0 to 100. The WellCCAT-NZ Manual is supplied as online supplementary material.
Descriptive analyses of nutrition-related survey variables were performed for the total sample, then tabulated by four child-care service types (private day care, community day care, public kindergartens and playcentres) and by three categories of neighbourhood deprivation based on the location of the ECE service (low, deciles 1–3; medium, deciles 4–7; high, deciles 8–10) using the New Zealand Index of Deprivation (NZDep2006), which is a composite measure of socio-economic indicators from neighbourhood areas in the 2006 census( Reference Salmond, Crampton and Atkinson 24 ). Only statistically significant results have been reported. Findings for Kōhanga Reo are not presented by type of child-care service as only five of these services completed the survey (16 % of Kōhanga Reo invited to participate in the research). Results for all respondents include data from the five Kōhanga Reo participants. Respondents with a missing value for a variable were not included in the analyses, so percentages reported have excluded missing data from the denominator.
The χ 2 test was performed to test differences between proportions of categorical groups and one-way ANOVA tested differences in means. A P value of less than 0·05 was considered to be statistically significant. All data were analysed using the statistical software package STATA/SE 13·1.
Results
A total of 257 services participated in the online survey (30·3 % of the total population of licensed services in Auckland, Counties Manukau and Waikato), with a similar proportion of services by different characteristics found in the total ECE population (Table 1).
Table 1 Overview of survey respondent characteristics compared with the total survey frame among a sample of licensed child-care services in the Auckland, Counties Manukau and Waikato regions of New Zealand, 2014

† Source is the Ministry of Education database Early Childhood Education Services (August 2013).
‡ All licensed child-care services in the Auckland, Counties Manukau and Waikato District Health Board regions, excluding infant and toddler centres, home-based services, playgroups, unlicensed crèches and hospital-based services (for patients).
§ Assessing the null hypothesis that there is no difference in distributions between the survey respondents and the survey frame for each service characteristic; χ 2 test.
|| See Table 2 for more information on the characteristics of different service types.
¶ The New Zealand Index of Neighbourhood Deprivation (NZDep2006) is a composite measure of socio-economic indicators from neighbourhood areas in the 2006 census( Reference Salmond, Crampton and Atkinson 24 ). Assigned based on the census meshblock (geographical location) of the child-care service.
Respondents from private and community day-care services were predominantly the manager (92·3 % and 82·7 %, respectively); 89·8 % of respondents from kindergartens were the head teacher; 54·8 % of respondents from playcentres were parents or family members and 35·1 % were the president or coordinator. Table 2 provides information on the characteristics of the different types of service.
Table 2 Characteristics of survey participants by child-care service type among a sample of licensed child-care services in the Auckland, Counties Manukau and Waikato regions of New Zealand, 2014

† Source is the Ministry of Education’s Annual ECE Census Report 2013, which conflates private and community day-care, so the 25 h/week is an average across the two types of service.
‡ The New Zealand Index of Neighbourhood Deprivation (NZDep2006) is a composite measure of socio-economic indicators from neighbourhood areas in the 2006 census( Reference Salmond, Crampton and Atkinson 24 ). Assigned based on the census meshblock (geographical location) of the child-care service.
Written policies
Four out of every five services (n 206; 82·4 %) reported that they had a written healthy food, nutrition or wellness/hauora policy, with no significant differences in the proportion of services having a policy by service type or neighbourhood deprivation. Written policies and procedure documents were supplied by 112 services (including eleven who supplied additional nutritional guidelines/handouts for parents) and derived for a further nineteen services (when they reported that they had a policy and were part of an association or corporation of child-care services with a generic policy). This resulted in the analysis of 114 different documents for 131 services (63·6 % of those that reported having a written policy). A lower proportion of private day-care centres provided written policies for analyses (n 39; 52·7 % of those with policies) compared with other service types.
Table 3 reports the mean scores for comprehensiveness and strength of the policies, as assessed using the WellCCAT-NZ described earlier. The most common statements in policies were about nutrition education (for children, teachers and/or parents) and these were relatively strong statements; for example, requiring the allocation for funds for nutrition education, or specific actions or teaching points (Table 3). Statements about nutrition standards (e.g. addressing the standard of food provided by the service or brought from home) were also relatively common in the policies, but were usually weak and phrased as suggestions for parents or teachers rather than requirements (Table 3).
Table 3 Wellness Child Care Assessment Tool (WellCCAT) scores of written child-care policies (n 114 policies for 131 services) among a sample of licensed child-care services in the Auckland, Counties Manukau and Waikato regions of New Zealand, 2014

*Statistically significant difference in mean score by type of child-care service, ANOVA (P<0·05).
† Total mean score across all domains.
‡ More information on the WellCCAT domains is available in the online supplementary material
§ See Table 2 for more information on the characteristics of different service types.
|| The New Zealand Index of Neighbourhood Deprivation (NZDep2006) is a composite measure of socio-economic indicators from neighbourhood areas in the 2006 census( Reference Salmond, Crampton and Atkinson 24 ). Assigned based on the census meshblock (geographical location) of the child-care service.
Thirty per cent of the policy documents received (n 34) made reference to external nutrition guidelines such as the Ministry of Health’s Food and Nutrition Guidelines and nineteen (17·0 %) specifically banned certain foods from the centre. Some policies contained statements that showed limited nutrition knowledge (e.g. lists of banned foods and permitted foods with similar nutritional status; mandated provision of instant noodles, full-fat milk or sugar-sweetened beverages such as cordial and Milo regularly to children; total ban on nuts). Many policies reiterated the licensing regulation that water must be available throughout the day for children to independently access, but only thirteen (11·6 %) had ‘water-only’ policies discouraging or banning other beverages.
The mean policy scores regarding promotion of healthy eating in the child-care setting (e.g. teachers sit with children during meals; food not being used as a reward; ensuring adequate time to eat; not pushing children to eat more than they want) were very low for both comprehensiveness and strength (Table 3). No policies included a statement on evaluation and only thirty-six (35·0 %) policies stated a specific date to revise the policy, with over a third of these dates (n 13; 36·1 %) already past.
Two-thirds of all services (n 164; 65·6 %) reported that they had specific written nutrition guidelines for food brought from home, including 68·3 % (eighty-two out of the 120) of services where children brought food daily for all of their snacks and meals. Less than one in six services with nutrition guidelines reported that ‘all’ of their families complied with the policy (n 29; 17·7 %); 72·6 % (n 119) said ‘most’ complied, 9·2 % (n 15) said ‘some’ complied and one service (0·6 %) said ‘none’ of the families complied.
When food is brought from home that does not meet their guidelines, most services (n 121; 73·8 %) discussed this with the parents or family directly, and half (n 93; 56·7 %) used newsletters to remind all parents about the policy. Nearly one-third of services with nutritional guidelines (n 48; 29·3 %) reported that they allow children to eat food that is not in compliance, but some services send the food home (n 28; 17·1 %) or discard the food (n 25; 15·2 %) and give the child something else. Six services (3·7 %) reported that they would do nothing if a child brought food that was not in compliance with their guidelines.
Provision of meals and snacks
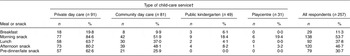
In nearly half of services (n 120; 46·7 %) children eat only food that is provided from home during the day or session, and in a small number of services (n 17; 6·6 %) food from home is usually pooled and shared among all of the children present. In the remaining majority of services (n 145; 56·4 %), food is provided regularly to children by the child-care service (i.e. every day a child attends; Fig. 1).
The proportion of services that provide food daily to children varied considerably by type of service, as shown in Fig. 1. Morning snack was the most commonly provided meal, followed by afternoon snack and then lunch (Table 4). No service provided dinner and only a small number provided breakfast (Table 4). A larger proportion of ECE services in areas of high deprivation (n 17; 18·9 %) provided breakfast regularly to children, compared with services in other neighbourhoods (P<0·01).

Fig. 1 Proportion of child-care services where meals and snacks are provided by the service (![]() , lunch and at least two other meals/snacks provided every day), from home (
, lunch and at least two other meals/snacks provided every day), from home (![]() , all food provided in lunchboxes) or a mix of both (
, all food provided in lunchboxes) or a mix of both (![]() , some food provided every day by the service (e.g. lunch only, or only snacks)), by type of service, among a sample of licensed child-care services in the Auckland, Counties Manukau and Waikato regions of New Zealand, 2014
, some food provided every day by the service (e.g. lunch only, or only snacks)), by type of service, among a sample of licensed child-care services in the Auckland, Counties Manukau and Waikato regions of New Zealand, 2014
Table 4 Meals and snacks provided to children daily in child care (excluding food bought from home), by type of service, among a sample of licensed child-care services in the Auckland, Counties Manukau and Waikato regions of New Zealand, 2014
† See Table 2 for more information on the characteristics of different service types.
Food for special occasions and fundraising
The majority of services required children to bring food from home for some (n 17; 68·9 %), most or all (n 68; 26·5 %) special occasions, such as birthdays, national and cultural celebrations, and farewells. Only twelve (4·5 %) services had banned food from home for such occasions, all of which were private or community day-care centres in areas of low or medium deprivation. Most services reported that they held special occasions (where food is served instead of, or in addition to, the regular meal or snack) ‘monthly’ (n 98; 40·5 %) or ‘a few times a year’ (n 111; 45·9 %). A small number of ECE services (n 17; 7·0 %) reported that special occasions were held ‘weekly’.
The most common food served on special occasions were cupcakes or a cake, and less than half of ECE services reported that they usually serve fruit or vegetables on special occasions (Table 5). More than a quarter of services reported that they usually serve three or more foods or beverages that are typically high in sugar, salt and/or saturated fat, with a greater proportion of playcentres (n 15; 48·4 %) and kindergartens (n 16; 32·7 %) usually having three or more of these foods/drinks on special occasions, compared with other service types (P<0·01). Two survey respondents had introduced alternative non-food celebration rituals (‘play dough cakes’, having a special crown/chair and/or leading ‘mat-time’) in recognition of the frequency of special occasions and that most children also have birthday parties at home, and twenty-three services (9 %) provided parents with ideas for healthy celebratory foods (e.g. plain cake) and advice on child-appropriate potion sizes.
Table 5 Foods and beverages usually served on special occasions in child-care services, by type of service, among a sample of licensed child-care services in the Auckland, Counties Manukau and Waikato regions of New Zealand, 2014

† Defined in the questionnaire as ‘a national/cultural celebration or birthday party etc. where the children/tamariki do not eat, or eat in addition to, the regular meal or snack’.
‡ See Table 2 for more information on the characteristics of different service types.
§ Includes fizzy/soft drinks, fruit drink, sports drinks and cordial. Does not include milk-based products, 100 % fruit juice or non-sugar-sweetened beverages (‘diet’ artificially sweetened drinks).
|| Defined as three or more of the following foods or beverages ‘usually’ served on special occasions: cupcakes or cake; biscuits; pizza, pies, sausages or sausage rolls; potato chips/crisps; lollies, sweets, chocolate or other confectionery; ice cream; hot chips/fries; sugar-sweetened beverages.
One in three services (n 89; 37·2 %) had sold foods or beverages as part of their fundraising activities in the past 12 months, with a greater proportion of playcentres (n 22; 71·0 %) and kindergartens (n 31; 67·4 %) having used foods or beverages in fundraising compared with other service types (P<0·01). The majority of foods used in fundraising for ECE services were typically high in sugar, salt and/or saturated fat: pizza, pies, sausages or sausage rolls were the most common foods for fundraising, followed by cupcakes, cake, croissants or biscuits. Lollies, sweets, chocolate or other confectionery were sold by twenty-one services in the past 12 months (23·6 % of those who fundraise using foods, or 8·9 % of all services). Cultural foods such as hangi, chop suey, samosas, sushi and Indian curries were also sometimes sold.
Promoting healthy eating behaviours and nutrition
Table 6 presents data on the frequency of twelve recommended practices that promote healthy eating in the child-care setting. Nearly all services reported that they did not use food as a behavioural consequence; 95 % never used food to reward ‘good’ behaviour, such as during toilet training or as a treat for cleaning up, and 96·3 % never withheld food as a punishment, such as children who are not quiet do not get a biscuit. Overall, 80 % of staff always sat with children while they eat and always encourage and promote water consumption. However, in less than half of ECE services did staff always talk to children about what they are eating, verbally check with children if they were full before offering seconds and never hurry children to finish eating. ECE services were least likely to follow the best practice of staff eating/drinking the same foods as children (Table 6).
Table 6 Self-reported frequency of recommended practices that promote healthy eating in the child-care setting, by service type, among a sample of licensed child-care services in the Auckland, Counties Manukau and Waikato regions of New Zealand, 2014

No statistically significant differences in these recommended practices were found by neighbourhood deprivation category.
*Statistically significant difference in the proportion by type of child-care service, χ 2 test (P<0·05).
† See Table 2 for more information on the characteristics of different service types.
Nearly all ECE services had an ‘edible garden’ (n 212; 89·5 %) where they grow their own fruit trees and/or vegetables on-site. A slightly lower proportion of private centres had a garden (84·0 %) compared with other child-care service types (P=0·03). Over half of ECE services with a garden reported that their children were involved in gardening activities daily or weekly (n 37; 17·5 % and n 90; 42·5 %, respectively). However, one in seven services with a garden (n 33; 15·1 %) reported that children were involved in gardening only a few times per year or very rarely.
Cooking with children was also a common activity in ECE; 150 services (58·8 %) reported that staff involved children in making, baking or cooking food at least weekly. The most commonly baked food with children in the past 12 months were cupcakes, cake or biscuits (n 189; 79·4 %), muffins (n 173; 72·7 %), fruit kebabs or vegetable sticks (n 169; 71·0 %) and pizza (n 136; 57·1 %). Half of services that cooked with children had made bread (n 126; 52·9 %) and sandwiches or filled rolls (n 121; 50·8 %) in the past 12 months.
Statistically significant differences by service type were found for two-thirds of the recommended practices (Table 6), with a lower proportion of playcentre staff/parents compared with other service types following the recommended practices of promoting water, sitting with children while they eat, talking to them about what they eat, checking children are still hungry before offering seconds, and involving children in gardening and cooking at least weekly. However, children at playcentres were much less likely to be hurried to finish eating. A higher proportion of kindergartens than other service types taught food and nutrition concepts weekly and involved children in baking and gardening at least weekly, and kindergarten staff were more likely to talk to children about what they are eating (Table 6).
Barriers to nutrition
Two out of every five services (n 92; 39·5 %) reported that they experience at least one barrier to providing and/or promoting healthy food to children. The most commonly reported nutrition barrier was a lack of support from parents and families (n 48; 20·6 % of all services) and some also reported concerns about food intolerances or allergies as a barrier (n 24; 10·3 % of all services). Lack of staff training on nutrition and education was said to be a barrier in sixteen (6·9 % of all services) largely private and community day-care centres. Another ten private and community day-care centres (4·3 % of all services) said that a lack of training for cooks was a barrier, and ‘insufficient funds’ was cited as a barrier to providing and/or promoting healthy food to children by twelve services (5·2 % of all services).
Discussion
The current paper has provided updated information on nutrition-related practices in licensed child-care services in mid-2014 and is the first time that written ECE nutrition policies have been analysed in New Zealand. With the exception of providing breakfast to children, no statistically significant differences were observed in any of the analyses by neighbourhood deprivation of the ECE services. It is possible that the measure used for neighbourhood deprivation (based on the location of the ECE service) does not accurately reflect the socio-economic status of children attending the service, or that the differences found between services are due in greater part to the type of service and philosophy and/or training of staff at different ECE service types rather than socio-economic position. A number of differences were evident by type of service, with a greater proportion of playcentres and kindergartens usually serving unhealthy foods on special occasions and selling unhealthy foods for fundraising. Playcentres were less likely to have a nutrition policy and even when they did, attained lower scores for the comprehensiveness and strength of those policies. Playcentres were also less likely to follow many of the recommended practices to promote nutrition and healthy behaviours. However, given the relatively small proportion of children and time per week that children attend playcentres, the results for all service types are arguably of more concern.
The overall scores for comprehensiveness and strength of written nutrition policies of all services were exceptionally low; even the most comprehensive policy only scored 65/100 and the most strongly worded policy scored 39/100. A similar analyses of ninety-four policies in Connecticut had a mean score for comprehensiveness 20 points higher (47·8 (sd 13·4), range 19–74) and strength 13 points higher (23·9 (sd 10·2), range 5–55)( Reference Falbe, Kenney and Henderson 21 ). Policies would benefit from a statement that food provided by the service or brought into the service from home will meet the Ministry of Health’s Food and Nutrition Guidelines( 22 ), and also by including specific directives for staff to follow recommended practices in the child-care setting (see Table 6) to create an environment that enables children to develop healthy preferences and to encourage families to reassess existing unhealthy preferences( Reference Hawkes, Smith and Jewell 25 ).
We postulate that New Zealand’s child-care policies rated lower than the Connecticut policies due to the lack of regulation, evaluation and guidance on child nutrition for ECE services. The nutrition regulations for New Zealand ECE services are very brief and weak compared with the UK( 26 ) and Australia( 27 ) which have both recently developed robust and lengthy guidelines for child-care nutrition policy, food standards and related behaviours; and most states in the USA( Reference McPherson and Homer 28 ) and Canada( 29 ) have regulations (as opposed to voluntary guidelines) that state maximum portion sizes, intakes for key nutrients, and detail authorised and proscribed staff behaviours. The Society of Behavioral Medicine has recently argued for even stronger regulations for ECE policies related to nutrition and to use comprehensive assessment tools to evaluate the implementation of these policies. The Society contends that without strongly worded regulations and guidelines, it is difficult to monitor change in the nutrition environment and near impossible to encourage the vast number of services to improve en masse, as voluntary change requires costly and time-consuming re-education of managers and teachers if it is to be persuasive and effective( Reference Buscemi, Kanwischer and Becker 30 ). A 2010 review of New Zealand food and nutrition initiatives in education found that nation-level policy was ‘an important first step’ to creating supportive nutrition environments, followed by policy change at the service level to embed change in culture and practice( Reference Clinton, Cairns and McNeill 31 ).
In addition to the policy analysis, the present study provides the best current estimate of the number of ECE services providing food to children daily, finding a greater proportion supplying lunch and snacks than earlier studies in New Zealand suggested. The 2009 ECE services Food and Nutrition Environment Survey (FNES) found most services required children to bring food from home for themselves (81·2 %) but it was unclear how many were providing some meals or snacks to children on a daily basis( Reference Pledger, Black and Cumming 12 ). The present survey has found that just over half (56 %) of all ECE services provide some food to children daily; including two-thirds of private day-care centres, one-third of community day-care centres and a few public kindergartens, who provide lunch daily.
Nearly all ECE services in the present study required food to be brought from home for special occasions and it is the food from home that some survey respondents expressed concern about, with one in five services reporting that they face the barrier of ‘a lack of support from parents and families’. However, one-third of services did not have written nutritional guidelines for foods and beverages brought from home (which is higher than that found in both the 2007 (26·6 %) and 2009 (17·0 %) FNES( Reference Pledger, Black and Cumming 12 )), potentially making it difficult for families to know what is expected. Services that do not have guidelines for food brought from home may not be meeting the regulation that they ‘encourage and promote healthy eating guidelines’( 11 ) as this would appear to be a minimum requirement. However, even when the service had written guidelines, our analysis of policies has found that they are often not strongly worded, which can lead to families not complying and staff struggling to enforce them.
Serving extra foods to children on special occasions was a widespread practice in ECE services. Serving a cake at a celebration is a cultural tradition in New Zealand, and so not surprisingly cake was the most common food served on special occasions. However, one in four services usually served three or more foods that are typically high in sugar, salt and/or saturated fat on special occasions, potentially encouraging children to eat more than the recommended daily intakes. Given the very high sugar content and lack of nutritional benefit in confectionery and sugar-sweetened beverages, nutritionists contend that these should not be served at all in child-care settings( Reference DeBoer, Scharf and Demmer 32 – Reference Te Morenga, Mallard and Mann 35 ), yet one in seven ECE services usually served confectionery on special occasions and a small number served fizzy drinks, sports drinks or cordial. Furthermore, all eating times could be seen as an opportunity to increase children’s consumption, exposure to and liking of fruit and vegetables( Reference Anzman-Frasca, Savage and Marini 36 ), yet only half of services reported that they usually serve fruit and vegetables on special occasions. Wider use of celebration guidelines for parents or non-food rituals in child-care services could assist children’s development of healthy food preferences and moderated eating behaviours( Reference Hawkes, Smith and Jewell 25 ).
More than one in three services had sold foods or beverages as part of their fundraising activities in the past 12 months, which is similar to the proportion in 2007 and higher than in 2009 when government-funded initiatives were actively discouraging this practice( Reference Pledger, Black and Cumming 12 ). Fundraising by selling unhealthy foods sends a contradictory message to children and their families, undermining nutrition education( Reference Richards, Darling and Reeder 37 ), and the majority of foods used in fundraising for child-care services were indeed high in sugar, salt and/or saturated fat. There does, however, seem to be greater diversification of the types of food sold compared with the 2007 and 2009 FNES, with a lower proportion of services now selling pizza, pies and sausages (53·9 % in 2014; 70·1 % in 2009) and confectionery (23·6 % in 2014; 41·9 % in 2009)( Reference Pledger, Black and Cumming 12 ).
The most encouraging findings from the current survey relate to nutrition education, which was an area with the most comprehensive and strongest policy statements and where there was evidence of staff following good practice. Teaching children concepts about food or nutrition and cooking with children occurred weekly in three out of five ECE services. Edible gardens were even more widespread, with nine out of ten services growing their own fruit trees and/or vegetables, and most services involving children in gardening activities daily or weekly. This appears to be an increasing prevalence of edible gardens from previous research in 2009 which found 71 % of services in New Zealand grew their own vegetables or had fruit trees( Reference Dawson, Richards and Collins 38 ). A recent evaluation of funding for edible gardens in child care( Reference Moss, Holmes and King 39 ) concluded that these gardens provide opportunities to discuss the importance of fruit and vegetables for health, encourage children to try new foods, provide opportunities for cooking, and have a range of positive outcomes for children and the whole community. The extension of nutrition education activities to all pre-school children could be seen as essential, given the multiple benefits to child development( Reference Contento 40 ).
The results presented in the current paper have some limitations. First, this research collected self-reported information from one person (usually a manager) in each child-care service. There was no validation by observation of the practices or behaviours reported by survey participants. Second, while a response rate of 30 % is common in online surveys( Reference Hoonakker and Carayon 41 , Reference Kaplowitz, Hadlock and Levine 42 ), this limits the ability to generalise the findings to all services. Even though the survey sample contained a sizeable, diverse range of ECE services, with a similar profile between responders and the total population (Table 1), it is possible that managers who were more interested in the topic of nutrition and physical activity were more inclined to take part. Additionally, only two-thirds of services with a written policy on nutrition or physical activity supplied it for the WellCCAT analysis. Third, comparisons of the survey data with the 2007 and 2009 FNES should be interpreted with caution due to sampling and population differences. Previous research has shown the similarity of the child population in the Auckland, Counties Manukau and Waikato District Health Board regions to the national population( Reference Morton, Ramke and Kinloch 43 ) and we expect that the results of the present survey will be pertinent to ECE services outside the study population. Further analyses planned for the survey data include: a dietary assessment of child-care menus; source, cost and preparation of food provided by services; physical activity strategies and equipment; and nutrition and physical activity programme participation. More research is needed to investigate the health outcomes for children exposed to poor nutrition environments in child care.
The present paper has provided a comprehensive picture of the nutrition environment in a varied sample of 257 child-care services which is broadly generalisable to the ECE sector in New Zealand. We have found wide differences between individual services (not always due to service type or neighbourhood deprivation) and presented evidence that some child-care services may not be meeting even the current regulations, which are not very stringent. Many ECE staff follow recommended practices to encourage the development of healthy behaviours in children. However, most appear to be hampered in their efforts to provide a healthy environment by a lack of comprehensive and strongly written nutrition policy, with a particular need for policy that requires food provided from home (every day in lunchboxes, for fundraising and on special occasions) to be consistent with the Ministry of Health’s Food and Nutrition Guidelines.
Acknowledgements
Acknowledgements: The authors would like to thank the participants of the Kai Time in ECE survey; the managers of child-care services involved in the pilot and ECE sector organisations that contributed to the survey design and questionnaire development; Professor Boyd Swinburn, Dr Polly Atatoa-Carr, Professor Paaparangi Reid, Dr Te Kani Kingi and Dr Lana Perese for their helpful advice on survey design and data collection; Moko Kumar and Brogan Harvey for their assistance with data collection and non-response follow-up; Dinusha Bandara for statistical advice; Cheryl Gammon for commenting on the draft paper; and Meghan O’Connell at Yale University for reviewing the WellCCAT modifications. Financial support: This work was supported by the University of Auckland (S.G., Doctoral Scholarship) and Gravida: National Centre for Growth and Development (S.G., Doctoral Scholarship). The University of Auckland and Gravida had no role in the design, analysis or writing of this article. Conflict of interest: None. Authorship: All authors conceived of the study design, revised and approved the final manuscript. S.G. developed the questionnaire, consulted with stakeholders, undertook all data collection and cleaning, conducted all analyses and drafted the manuscript. S.G. and C.W. amended the WellCCAT tool. S.M. and C.W. reviewed draft manuscripts. Ethics of human subject participation: This study was conducted according to the guidelines laid down in the Declaration of Helsinki and all procedures involving human subjects were approved by the University of Auckland Human Ethics Committee. Written informed consent was obtained electronically from all participants.
Supplementary Material
To view supplementary material for this article, please visit http://dx.doi.org/10.1017/S1368980015002955


