

Unhealthy diets are a major cause of many non-communicable diseases – in particular coronary heart disease, stroke and some forms of cancer – while healthy diets protect people against such diseases1. Recently, it has been proposed that as well as ‘unhealthy’ and ‘healthy’ diets, there are ‘unhealthy’ and ‘healthy’ foods (or at least ‘less healthy’ and ‘healthier’ foods), but there is a considerable controversy over the precise definition of ‘unhealthy’/’less healthy’ and ‘healthy’/’healthier’ and how the ‘healthiness’ of a food might be ratedReference Freeland-Graves and Nitzke2.
Nutrient profiling is defined as ‘the science of categorising foods according to their nutritional composition’Reference Rayner, Scarborough and Stockley3, 4 and can be used to score the ‘healthiness’ of individual foods and thereby generate definitions of ‘healthier’ and ‘less healthy’ when applied to foods. Nutrient profile models designed to score the ‘healthiness’ of foods can therefore be viewed as ‘instruments’ equivalent to say instruments designed to score the quality of life of patients with a particular disease or instruments designed to measure the level of air pollution at a given place. As such, nutrient profile models should be subject to reliability and validity testing.
In this paper, we test the validity of a nutrient-profiling model – Model WXYfm – developed for the purpose of regulating the promotion of ‘less healthy’ foods to children in the UKReference Rayner, Scarborough, Stockley and Boxer5. Although developed with this purpose in mind the model is likely to be applicable for uses in connection with the promotion of foods to adultsReference Rayner, Scarborough and Stockley6. Model WXYfm is a scoring system that rates individual foods on a scale from −15 (most healthy) to +40 (least healthy) based on their energy, saturated fat, total sugars, sodium, fibre, protein and fruit, vegetable and nut content per 100 g. It categorises foods as ‘less healthy’ if they score ≥4 or ‘healthier’ if they score <4 and it categorises drinks as ‘less healthy’ if they score ≥1 and ‘healthier’ if they score <1.
Recently, it has become recognised that ‘validating a scale is really a process whereby we determine the degree of confidence we can place on inferences we make … based on scores from that scale’Reference Steiner and Norman7. Validity has various aspects: content validity, criterion validity, convergent and discriminant validity, construct validity, predictive validity and so forth. Some of these aspects (e.g. criterion, predictive) are difficult to test for when validating a nutrient profiling model. Model WXYfm was developed using a systematic approach which aimed to ensure good content validity e.g. by taking account of nutrients that are of major public health concernReference Rayner, Scarborough and Stockley3. In this paper, we describe results of testing for its convergent and discriminant validity and construct validity.
To test for its convergent and discriminant validity, we have compared the way that the model categorises foods with the way that the UK’s national food guide – the Balance of Good Health (BGH) – categorises foods.
To test for its construct validity, we have examined the relationship between the way the model categorises foods and the healthiness of diets in the UK. The rationale for this is that both the ‘healthiness’ of a food and the ‘healthiness’ of a diet can be regarded as ‘constructs’ that are theoretically related.
Methods
Food composition and dietary data
In testing for the validity of Model WXYfm, we have used data from the National Diet and Nutrition Survey (NDNS) and from the ‘nutrient databank’ used to analyse that survey.
The NDNS assessed the diets of 1722 adults aged 19–64 years living in Great Britain, between July 2000 and June 2001Reference Henderson, Gregory and Swan8. Each subject was asked to complete a 7-day diary recording the weighed intake of all foods consumed both in and out of the home. In addition, respondents were assessed for a variety of demographic characteristics and provided blood and urine samples. For all of the analyses reported in this paper, 605 of the 1722 NDNS respondents were excluded, i.e. 347 who did not complete their 7-day diaries or provide urine samples; and 258 who reported being unwell during data collection on the basis that their diets were likely to be affected by their state of health.
All foods and drinks (including alcoholic beverages but not supplements), which were consumed by the NDNS subjects were allocated to one of 7749 different food codes in the ‘nutrient databank’. This nutrient databank contains compositional data for all these food codes.
Convergent and discriminant validity testing
The best and most obvious way of assessing validity is to compare the new measure with another measure of the trait under study, ideally a ‘gold standard’ which has been used and accepted in the field. This is called testing for criterion validityReference Steiner and Norman7. In the absence of a gold standard, we could not test for the criterion validity of Model WXYfm. Instead, we assessed the way Model WXYfm categorises foods compared with another, but related, way of categorising foods: the BGH. Comparison with other measures – not necessarily better ones – of the same variable or a closely related one is called testing for convergent validity. Comparison with measures of variables that are not closely related is called testing for discriminant validity.
The BGH is a ‘pictorial representation of the recommended balance of foods in the diet’9, 10. It categorises foods into ‘fruit and vegetables’, ‘bread, other cereals and potatoes’, ‘milk and dairy foods’, ‘meat, fish and alternatives’, and ‘fatty and sugary foods’. The BGH is effectively a pie chart where the size of the segments represents the amount of food that should be eaten from each food group. The BGH therefore indicates that people should eat lots of foods from ‘fruit and vegetables’, ‘bread, other cereals and potatoes’; intermediate amounts of foods from ‘milk and dairy foods’, ‘meat, fish and alternatives’; and ‘fatty and sugary foods’ sparingly. We therefore postulated that foods that Model WXYfm categorises as ‘healthier’ should be found more frequently within foods categorised by the BGH as ‘fruit and vegetables’ and ‘bread, other cereals and potatoes’ and that foods categorised by the model as ‘less healthy’ should be found more frequently within foods categorised by the BGH as ‘fatty and sugary foods’ (testing for convergent validity). We further postulated that there should be no relationship between the way Model WXYfm categorises foods and the way ‘milk and dairy foods’ and ‘meat, fish and alternatives’ are categorised by the BGH (testing for discriminant validity).
The list of foods in the nutrient databank is clearly not representative of the British diet. So when testing for convergent and discriminant validity we weighted the foods in the databank by their energy contribution to the average daily diet of the NDNS respondents, in order to avoid giving equal weight to rarely consumed foods as to commonly consumed foods.
Construct validity
According to Cronbach and Meehl’s seminal articleReference Cronbach and Meehl11, testing for construct validity involves three steps:
1. Explicitly spelling out a set of theoretical concepts and how they are related to each other.
2. Developing scales to measure these theoretical constructs.
3. Testing the relationships among the constructs.
In other words, unless there is an articulated theory there is no construct validityReference Clark and Watson12.
We theorised that there should be a relationship between the healthiness of foods and the healthiness of diets. Accordingly, we hypothesised that, amongst NDNS respondents:
1. The consumption of foods categorised as ‘healthier’ by Model WXYfm measured as a proportion of energy intake should be higher in people who have healthy diets than people who have unhealthy diets.
2. The consumption of foods categorised as ‘healthier’ by Model WXYfm measured as a proportion of energy intake should be higher in vegetarians than in non-vegetarians.
3. The consumption of foods categorised as ‘healthier’ by Model WXYfm measured as a proportion of energy intake should not be different between the geographical regions of Great Britain.
To test Hypothesis 1, we needed a method of categorising people by the healthiness of their diets. While the general characteristics of a healthy and an unhealthy diet are well-recognised, there is a considerable controversy over the precise definition of a ‘healthy’ or an ‘unhealthy’ diet. A recent review has summarised attempts in rating the healthiness of diets using different scoring systemsReference Waijers and Feskens13. It concluded that existing scoring systems could be much improved. However, one of the methods reviewed – the Diet Quality Index (DQI) – has been tested for its predictive validity and shows a relationship with all-cause mortality and mortality from cardiovascular disease in a population similar to that of the UKReference Seymour, Calle, Flagg, Coates, Ford and Thun14. Therefore, in testing Hypothesis 1 we used the DQI to characterise the healthiness of diets.
The DQI scores diets on the basis of the percentage of total energy from total fat and saturated fat; amounts of cholesterol and sodium; servings of fruits and vegetables and complex carbohydrates; and proportions of the recommended daily allowances of protein and calcium. In order to characterise four ‘diet groups’ ranked in order of their ‘healthiness’, the NDNS participants (n = 1117) were divided into four quartiles based on their DQI scores. Those in the first quartile (Group 1) were considered to have the most healthy diets and those in the fourth quartile (Group 4) the least healthy diets.
Hypothesis 2 is based on the observation that vegetarians have healthier diets than non-vegetariansReference Davey, Spencer, Appleby, Allen, Knox and Key15. Hypothesis 3 is based on the assumption that there is no clear relationship between the healthiness of diet and where people live in Great BritainReference Henderson, Gregory and Swan8, Reference Key, Appleby and Rosell16.
Statistical analysis
The level of agreement between Model WXYfm and the BGH in categorising foods was tested by calculating the κ statisticReference Altman17. For the comparison of characteristics between or within the diet groups, analysis of variance (ANOVA) was used for continuous data (age, body mass index (BMI), energy intake) and the χ 2-test for categorical data (sex, ethnicity, social class, region, vegetarianism vs. non-vegetarianism).
Results
Convergent and discriminant validity
Figure 1 shows how both Model WXYfm and the BGH classify foods in the nutrient databank (weighted by the energy each food supplies to the average daily diet of NDNS respondents).

Fig. 1 Categorisation of foods consumed by National Diet and Nutrition Survey participants (weighted by their contribution of energy to the average daily diet) into ‘healthier’ and ‘less healthy’ foods (as defined by Model WXYfm) within the food groups of the Balance of Good Health (BGH). Some foods within the nutrient databank are not categorised by the BGH, i.e. composite foods and miscellaneous foods (which include condiments, tea, coffee, alcoholic drinks, etc.)
Figure 1 shows that 97% of fruit and vegetables and 72% of bread, other cereals and potatoes as classified by the BGH are classified as ‘healthier’ by Model WXYfm. It also shows that 95% of fatty and sugary foods as classified by the BGH are classified as ‘less healthy’ by Model WXYfm. The level of agreement between Model WXYfm and the BGH in categorising foods from the ‘fruit and vegetables’, ‘bread, other cereals and potatoes’ and ‘fatty and sugary foods’ groups of the BGH as ‘healthier’ or ‘less healthy’ respectively had a κ value of 0.69, a level of agreement defined as good by AltmanReference Altman17. This demonstrates good convergent validity of Model WXYfm by comparison with the BGH.
Figure 1 also shows that for ‘milk and dairy foods’ and for ‘meat, fish and alternatives’, the proportions of foods that are classified as ‘less healthy’ by Model WXYfm were 32% and 42% respectively – i.e. intermediate between the proportions classified as ‘less healthy’ within the ‘fatty and sugary foods’ group (95%) and the ‘bread, other cereals and potatoes’ and the ‘fruit and vegetables’ group (28% and 3% respectively). This demonstrates good discriminant validity of Model WXYfm by comparison with the BGH.
Construct validity
Characteristics of people with healthy and unhealthy diets
Table 1 shows the characteristics of NDNS respondents categorised by the healthiness of their diets using the DQI. In the groups with healthier diets, there were significantly greater numbers of females (P < 0.001), younger people (P = 0.01), non-manual social classes (P < 0.001) and vegetarians (P < 0.01). There were no significant differences between groups with regard to ethnicity, region and mean BMI.
Table 1 Characteristics of NDNS respondents categorised by the healthiness of their diet using the DQI
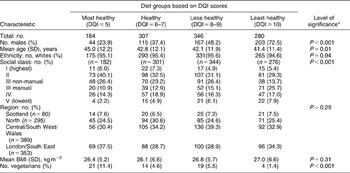
NDNS – National Diet and Nutrition Survey; DQI – Diet Quality Index; SD – standard deviation; BMI – body mass index.
* Significance was calculated using F-test for mean age and BMI; χ 2-test for sex, ethnicity, social class, region and vegetarians.
Hypothesis testing
Hypothesis 1. The consumption of foods categorised as ‘healthier’ by Model WXYfm should be higher in people who have healthy diets.
Table 2 and Fig. 2 show the mean daily energy intake from ‘healthier’ and ‘less healthy’ foods as defined by Model WXYfm in NDNS respondents categorised by the healthiness of their diets using the DQI. Table 2 indicates that there were significant differences in the overall energy intakes of the four groups categorised by the healthiness of their diets, with groups with unhealthy diets having significantly higher energy intakes (P < 0.001).
Table 2 Average energy intake from healthier and less healthy foods for different groups categorised by the healthiness of their diets using the DQI
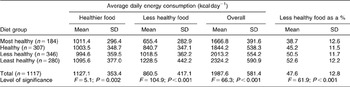
DQI – Diet Quality Index; SD – standard deviation.

Fig. 2 Average energy intake from ‘healthier’ and ‘less healthy foods’ for different groups categorised by the healthiness of their diets using the Diet Quality Index
Table 2 also shows that groups with unhealthy diets derived greater amounts of energy from ‘less healthy’ foods than groups with healthy diets when this is measured both absolutely (in kcal day−1) and relatively (as a proportion of total energy intake) (P < 0.001). In Group 4 (the least healthy diets), the energy derived from ‘less healthy’ foods was twice that derived from ‘less healthy’ foods by people in Group 1 (the most healthy diets).
Table 2 also shows there were significant differences in the amount of energy derived from ‘healthier’ foods between the groups when measured absolutely (P = 0.002) (although these differences did not follow a linear trend) and relatively (as a proportion of total energy intake) (P < 0.001) with the group with the most healthy diets consuming 61% of their energy from ‘healthier’ foods and the group with the least healthy diets consuming 47%. In summary, our Hypothesis 1 was confirmed.
We carried out a similar analysis separately for males and females in the NDNS (data not shown). For all groups categorised by the healthiness of their diet, males had a greater energy intake than females but the patterns of consumption of ‘healthier’ and ‘less healthy’ foods was the same for both males and females and similar to the patterns shown in Fig. 2.
Hypothesis 2. The consumption of foods categorised as ‘healthier’ by Model WXYfm should be higher in vegetarians than in non-vegetarians.
Table 3 shows the average daily energy intake from ‘healthier’ and ‘less healthy’ foods in vegetarians and non-vegetarians. It shows that non-vegetarians have a significantly higher consumption of ‘less healthy’ foods than vegetarians whether measured absolutely (P < 0.05) or relatively (P < 0.05). Table 3 also shows that although there was no significant difference in the absolute amount of energy derived from ‘healthier’ foods between vegetarians and non-vegetarians, the proportion of total energy intake from ‘healthier’ foods amongst vegetarians was significantly higher than in non-vegetarians (P < 0.05). In summary, our Hypothesis 2 was confirmed.
Table 3 Average energy intake from healthier and less healthy foods for vegetarians and non-vegetarians

SD – standard deviation.
Hypothesis 3. The consumption of foods categorised as ‘healthier’ by Model WXYfm should not be different between the geographical regions of Great Britain.
Table 4 and Fig. 3 show the mean daily energy intake from ‘healthier’ and ‘less healthy’ foods as defined by Model WXYfm in NDNS respondents divided into four groups according to the region of Great Britain in which they live. They show that except in the Central region (which includes the South West and Wales), people living in all the regions consumed slightly more energy from ‘healthier’ than from ‘less healthy’ foods. Table 5 also shows that people in the Central region had a significantly lower consumption of ‘healthier’ foods than people in other regions when measured relatively (P < 0.05). In summary, our Hypothesis 3 was only partly confirmed.

Fig. 3 Average energy intake from ‘healthier’ and ‘less healthy foods’ for different groups categorised by the region in which they lived
Table 4 Average energy intake from healthier and less healthy foods for different groups categorised by the region in which they lived
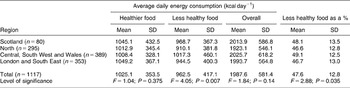
SD – standard deviation.
Discussion
This paper describes the outcome of testing for the validity of nutrient profiling Model WXYfm. Although originally designed for the regulation of food promotion to children, we have shown that it is also applicable for uses in connection with the promotion of foods to adultsReference Rayner, Scarborough and Stockley6. The model was developed using a systematic approach which aimed to take account of its content validity e.g. by ensuring that levels of all the nutrients that are of major concern in relation to the promotion of public health are incorporated into the modelReference Rayner, Scarborough and Stockley3, Reference Rayner, Scarborough, Stockley and Boxer5.
The best and most obvious way of assessing validity is to test for criterion validity: to compare the new measure with another measure of the trait under study – ideally a ‘gold standard’. A major problem with testing for the criterion validity of nutrient profiling models is that there is no gold standard. Two methods of creating a gold standard have been or are being attempted.
Firstly, we have used the data from a survey on the views of nutrition professionals in the UK to rank 120 foods in order of their ‘healthiness’18. However, we do not consider this ranking to be a gold standard because the nutrition professionals were not entirely objective in their assessment of the ‘healthiness’ of foods, as shown by their tendency to use ‘cues’ in the name of the foods such as ‘take-away’ or ‘wholemeal’ to influence their judgements. Secondly, we and others are seeking to develop a list of ‘indicator’ foods ranked by their contribution to the healthiness of a diet19. On the face of it, this would seem relatively simple. However, numerous problems remain to be resolved.
In the absence of such a gold standard for testing the criterion validity of nutrient profiling models, we have tested for the convergent and discriminant validity of Model WXYfm by comparing the way it categorises foods with that of the BGH. The way that the BGH categorises foods is less than completely satisfactory, e.g. it fails to categorise composite foods and some foods appear in more than one category (e.g. baked beans). Nevertheless, it is the most generally accepted method of categorising foods in relation to their health-related properties in the UK. Testing for the convergent and discriminant validity of Model WXYfm shows that it does categorise foods in a way that is congruent with that of the BGH. The most notable exception being foods categorised as ‘bread, other cereals and potatoes’ which, according to the BGH, should be eaten in large amounts but which, according to nutrient profile Model WXYfm, are frequently ‘less healthy’. Those responsible for the development of the BGH were aware that not all ‘bread, other cereals and potatoes’ were ‘healthy’ but found no way of depicting this or being precise about itReference Gatenby, Hunt and Rayner20.
Testing for the construct validity of Model WXYfm is another way of assessing its validity. To do this, we tested a hypothesis relating the construct ‘healthiness’ as applied to foods (and as measured by Model WXYfm) and the construct ‘healthiness’ as applied to diets (measured by the DQI). This hypothesis was confirmed. Two other hypotheses, one relating to the construct ‘healthiness’ as applied to foods and vegetarianism vs. non-vegetarianism and another to where people live in Great Britain, were also largely confirmed.
The hypotheses were tested using data from the NDNS to categorise people by the healthiness of their diets, etc. but it should be noted that this survey was subject to underreporting. A feasibility study for the NDNS compared the 7-day weighed dietary record method (used in the survey) with measurement of energy expenditure using the doubly labelled water methodReference Henderson, Gregory and Swan8, Reference Coward, Wright and Bluck21, and found that the underreporting in the main survey probably led to an underestimation of energy intakes by approximately 25%. Although there was no evidence of differential bias by age or sex, the authors did not look for differential bias by diet quality, so the potential presence of this bias should be borne in mind when interpreting our results of testing for the construct validity of Model WXYfm.
Testing for the construct validity of Model WXYfm as described here appears to involve some circularity in reasoning. For example, the constructs ‘healthiness’ as applied to foods measured by Model WXYfm and the construct ‘healthiness’ as applied to diets measured by the DQI both incorporate measures of saturated fat, sodium and fruit and vegetable content (of foods and diets, respectively). This to some extent is inevitable if the two constructs are to have good content validity. However, the measures were developed entirely independently of one another and use very different ways of scoring the levels of nutrients in foods or diets.
One way out of the circularity of reasoning would be to make the constructs entirely independent of one another. This could be done by testing hypotheses relating the construct ‘healthiness’ as applied to foods to the future ‘healthiness’ of consumers (e.g. measured by their mortality from known diet-related diseases). This would be the ideal way of testing for the construct validity of a nutrient profiling model but the NDNS is a cross-sectional study and data relating to the subsequent health status of the respondents have not been collected. Note that in cross-sectional studies current health status is unlikely to bear much relation to current diets (e.g. Table 1 shows no significant relationship between DQI scores and mean BMI). It should also be noted that the DQI has been validated with respect to future health status.
The healthiness of a diet is clearly not just a function of the ‘healthiness’ of the foods of which it is composed. At least two other factors directly affect the healthiness of a diet: firstly the amount of the different foods consumed – in turn dependent on serving size and frequency of consumption – and secondly the variety of foods consumed. In order to take account of the first of these factors, in our analyses the foods consumed were weighted by the amount of energy that they contributed to diets. We were unable to take account of the second of these factors but possibly could do so in future studies. (Note that serving size is not incorporated in ‘healthiness’ as defined by Model WXYfm but is included in other nutrient profiling models.Reference Kent22, Reference Drewnowski23)
Others have shown that healthy and unhealthy diets are associated with the increased or decreased consumption of foods from different food groups. For example, KentReference Kent22 has shown that the consumption of ‘energy-dense, nutrient-poor’ foods in adult Americans is correlated with a variety of dietary variables including percentage energy from fat, serum concentrations of vitamins A, E, C, B12, etc. But such studies suffer from a lack of clear definitions of food categories such as ‘energy dense–nutrient poor’.
Nutrient profiling has the potential to provide clear and unambiguous definitions of ‘healthier’ and ‘less healthy’ as applied to foods. Here, we show that a nutrient profiling model – Model WXYfm – designed to categorise foods as ‘healthier’ and ‘less healthy’ does so in a way that is clearly related to a well-established representation of a healthy diet: the BGH. But more importantly, we show that this nutrient profiling model categorises foods in a way that is related to the healthiness of diets of free-living individuals.
This method of assessing the validity of nutrient profile models has not, to our knowledge, been attempted before. It is therefore not possible for us to compare the results of testing for the validity of Model WXYfm with that for any other nutrient profiling model. We recommend that similar validity assessments should be conducted for other models in order to establish a conclusive link between the definitions they provide and healthy diets, both recommended and achieved.
Acknowledgements
Sources of funding: M.R. and P.S. are supported by the British Heart Foundation. M.R. and P.S. were funded by the Food Standards Agency to assist with the development of Model WXYfm.
Conflict of interest declaration :The authors declare no conflict of interest in completing this work, other than that which is covered by `sources of funding' above.
Authorship responsibilities: Each author was involved in the preparation of analysis plans and drafting of the final manuscript. C.A. was responsible for the analysis of the data.
Acknowledgements: We thank Dr Rafael Perera and Ms Helen Doll for their statistical assistance.


