


The COVID-19 pandemic caused a global surge in food insecurity and food insufficiency, including in the USA among some vulnerable populations (e.g. low income, unemployed) and in some regions hard hit by the pandemic(Reference Bauer1–Reference Hawkes and Squires5). Food insecurity refers to the disruption of food intake or eating patterns because of lack of money and other resources, and historically it is experienced by one in ten U.S. households annually(6). Food insufficiency is a more severe dimension of food insecurity where households do not have enough to eat(7).
National and state-level statistics from U.S.D.A. surveys found that 10·5 % of U.S. residents reported food insecurity in the past year, at the end of 2019 and the end of 2020, with the rate remaining stable at 10·5 % both years(Reference Coleman-Jensen, Rabbitt and Gregory8). However, these annual surveys may not have accurately captured people’s experiences during the first months of the pandemic(Reference Livings, Bruine de Bruin and Wilson9). Survey data from the U.S. Census Bureau collected regularly throughout the pandemic suggest that rates of food insufficiency did increase in the first months of the pandemic(Reference Schanzenbach and Pitts3). Local studies also documented a rise in food insecurity, especially among some high risk populations such as low-income African Americans(Reference Dubowitz, Ghosh Dastidar and Troxel10). Issues of food access, and its causes and solutions(Reference Gundersen and Ziliak11), may be unique during the pandemic due to the complex and sustained disruptions to economic systems (e.g. job loss), social systems (e.g. social distancing, closure of public institutions) and food systems (e.g. closure and limited hours and capacity of food outlets, changing landscape of food assistance).
Food insecurity, which we use in this literature review to be inclusive of the experience of food insufficiency, is associated with negative health outcomes for children and adults, including poor nutrition, mental health problems and increased risk for diet-related diseases like obesity and hypertension(Reference Gundersen and Ziliak11,Reference Gundersen and Ziliak12) . Although economic hardships are a primary cause of these food issues, the risk factors are complex and include having fewer assets (e.g. owning a home), high cost of living and food prices, single parent households and less education(Reference Gundersen and Ziliak11). Food insecurity can be triggered by disruptions in household members’ income, employment and health(Reference Gundersen and Ziliak11). It may also be exacerbated by shocks to broader ecological systems(Reference Carducci, Keats and Ruel13).
There is evidence that food insecurity can be alleviated through formal and informal food assistance. Government-administered food programmes, the largest in the USA being the Supplemental Nutrition Assistance Program (SNAP), provide low-income households with money to spend on food(14). In 2019, SNAP provided 38 million Americans with an average $250/month(15) and has been shown to ameliorate food security(Reference Gundersen and Ziliak11,Reference Nord and Golla16,Reference Swann17) . Additionally, emergency assistance from charitable food assistance programmes, such as food pantries, provided free food to more than 46 million Americans annually prior to the pandemic(18). Although emergency food assistance programmes were primarily established to relieve acute food needs, they are used as a supplement by recipients of governmental food assistance and as a primary source of food assistance by people without governmental food assistance(19). Emergency food assistance can have positive short-term benefits to nutrition and food security(19,Reference An, Wang and Liu20) . More broadly, people’s social networks – their connections to family, friends, neighbours and community organisations – can also serve as a buffer against food insecurity through the provision of food assistance and social capital(Reference Martin, Rogers and Cook21,Reference Cattell22) .
Food insecurity in the context of the COVID-19 pandemic
Few studies have regularly monitored food insecurity during sustained crises or comprehensively assessed the associated risks and solutions as these dynamics unfolded within a changing system. Most research on food insecurity in the context of the COVID-19 pandemic has been cross-sectional in nature. Cross-sectional research has identified factors associated with a higher risk for food insecurity and food insufficiency among U.S. adults during the pandemic, including being on low income, belonging to race and ethnic minorities, and having children in the household(Reference Lauren, Silver and Faye23), as well as differences in risk across geographic areas (e.g. urban v. rural, and metropolitan regions within a state)(Reference Santarossa, Hill and Sitarik24,Reference Blumenberg, Pinski and Nhan25) . One drawback of cross-sectional studies is that the temporal direction of findings remains unclear. For example, positive relationships at any one point in time between food insecurity and assistance programmes (e.g. SNAP) may mean that food assistance programmes are not working, but they may also be due to people experiencing food insecurity being more likely to seek out these programmes(Reference Ratcliffe, McKernan and Zhang26). Longitudinal data are needed to examine if programme use predicts transitions from experiencing food insecurity to being food secure.
However, longitudinal research that comprehensively examines ecological risk and protective factors that may contribute to the onset and relief of food insecurity is lacking. One of the few studies that did report longitudinal analyses found that U.S. adults who became unemployed during the COVID-19 pandemic experienced increases in food insufficiency and decreases in food expenditures and confidence in the ability to afford food(Reference Restrepo, Rabbitt and Gregory27). Another study on this population found that food insecurity was highest at the beginning of the pandemic (22 % in April 2020) and subsequently declined(Reference Raifman, Bor and Venkataramani28), and that receiving unemployment insurance decreased food insecurity(Reference Raifman, Bor and Venkataramani28).
The present study
Here, we conducted a comprehensive longitudinal study in Los Angeles (L.A.) County, the most populous U.S. county whose 10 million economically and ethnically diverse residents were hard hit by the pandemic. We draw on a social ecological model of health promotion(Reference Stokols29,Reference McLeroy, Bibeau and Steckler30) that highlights the need for identifying individual factors as well as factors in the social, physical, and macro environment that influence food access and diet(Reference Story, Kaphingst and Robinson-O’Brien31,Reference Barnhill, Palmer and Weston32) (Fig. 1). Because the pandemic’s disruptions have altered many of these factors, we examine multilevel risk and protective factors that may be associated with food insufficiency or not having enough to eat. For example, job losses in L.A. County increased unemployment from 5 % in February 2020 to 19 % in May 2020(33). This coincided with constraints in the ‘last mile’ of food distribution as restaurants closed, and people lost access to meals at schools and community centres. Many residents were also were cut off from their social networks and the food support they provide(Reference Martin, Rogers and Cook21). Government and community organisations responded by expanding existing food assistance programmes and creating new ones. For example, the federal government established the Pandemic Electronic Benefit Transfer (Pandemic EBT) food assistance programme that provided additional benefits to spend on food, to families with children who were eligible for free or reduced-price school meals(34). The landscape of charitable food assistance programmes also changed, with some organisations closing, others expanding capacity and new food pantries ‘popping-up’ to meet growing needs. In this changing and complex environment, it is not obvious what key risk factors for food adequacy have emerged (or persisted), and what solutions are working.

Fig. 1 Ecological influences on food access, diet and food security
This longitudinal study was conducted from April to December 2020, with a large and representative sample of L.A. County households (n 1535)(35). Building on the social ecological framework outlined above(Reference Stokols29,Reference McLeroy, Bibeau and Steckler30) (Fig. 1), we examined multilevel risk factors for food insufficiency and expected that poverty, as well as other personal, social and environmental barriers to food access would exacerbate this risk. We also examined the role of established and new food assistance programmes in reducing food insufficiency.
Methods
Study procedure and participants
Data come from the Understanding Coronavirus in America tracking survey, augmented by contextual data on food environments from the U.S.D.A. Food Access Research Atlas(36). Members of the Understanding America Study (UAS) consented to participate in the Understanding Coronavirus in America tracking survey. The UAS is a probability-based nationally representative internet panel of U.S. individuals 18 and older, and the Understanding Coronavirus in America component surveyed households throughout the pandemic. To obtain a representative sample, UAS participants were recruited from randomly selected U.S. addresses. Sampling probabilities were adjusted for underrepresented populations, and internet-connected tablets were provided to interested individuals if needed. UAS protocols, including those relevant to this study, were approved by the University of Southern California Institutional Review Board.
Surveys to assess food insufficiency, as well as risk and protective factors identified by the social ecological framework(Reference McLeroy, Bibeau and Steckler30), were fielded with a sub-sample of Understanding Coronavirus in America participants representative of L.A. County. Therefore this study focused exclusively on participants in L.A. County (n 1535), and their survey responses across nineteen waves conducted from 1 April to 23 December 2020. Participants were invited to respond to survey interviews every 2 weeks and were assigned a fixed day in the 2-week cycle of each survey wave (e.g. the second Wednesday in the 2-week period). They were given 2 weeks to complete the survey, until their invite for the next survey wave. Since the respondents on the last day of the 2-week cycle had 2 weeks to complete their survey, the final responses for every survey cycle (i.e. wave) were collected at most 4 weeks after the start of a wave. The majority (81 %) of participants responded on their assigned day, 96 % were recorded within the first 2 weeks of the survey wave and the remaining 4 % were completed by the end of the 4-week wave. The average annual attrition in the L.A. County sub-sample of the UAS is about 13 % annually, inclusive of the data collected from this sample in 2020 via the Understanding Coronavirus in America tracking survey. Post-stratification weights were used to further align the L.A. sample to L.A. County’s population regarding age, gender, race/ethnicity and education(Reference Angrisani, Kapteyn and Meijer37).
Measures
Food insufficiency was measured every wave using a subset of three items from the validated Food Insecurity Experience Survey (FIES)(Reference Cafiero, Viviani and Nord38), which was selected because of its brevity and validity(Reference Cafiero, Melgar-Quinonez and Ballard39). Of the eight FIES items, we selected three with the highest factor loadings for each level of food insecurity: mild (‘In the past 7 days, were you worried you would run out of food because of a lack of money or other resources?’), moderate (‘In the past 7 days, did you eat less than you thought you should because of a lack of money or other resources?’) and severe (‘In the past 7 days, did you go without eating for a whole day because of a lack of money or other resources’) (Table 1). As is standard in the literature, participants were treated as expressing food insufficiency if they gave a positive response to either or both of the questions about moderate or severe food insecurity in the past week (Table 1)(7,Reference Cafiero, Viviani and Nord38) . We use the label ‘food insufficient’ in this study, instead of ‘food insecure’, because we have used a subset of items from the FIES that capture the more narrow and severe experience of ‘not having enough to eat’. All other participants, including those who indicated worry about food without indicating moderate or severe food insecurity (Table 1), were categorised as ‘not food insufficient’. We note that in a study using the U.S.D.A. Household Food Security Module, assessments of food insecurity were found to be highly correlated (r > 0·9) independent of whether they had 1, 6, 10 or 18 items; only the single-item measure was found to lead to underestimation(Reference McKechnie, Turrell and Giskes40). In this study, the correlation coefficient for the two items used to assess food insufficiency was r = 0·50 (p <.01).
Table 1 Food insufficiency measure

Explanatory variables
Demographics and health
Demographics, reported every 3 months, included: (i) gender (male, female); (ii) age in years (categorised as 18–30, 31–40, 41–50, 51–64 and 65+), (iii) race and ethnicity (categorised as Hispanic/Latinx, White (non-Hispanic), Black (non-Hispanic), Asian (non-Hispanic), American Indian/Alaskan Native, Hawaiian/Pacific Islander and Other); (iv) education level (categorised as having a high school degree, GED or equivalent, or less; or some college or college and above); (v) employment status (used to create two binary variables: unemployed and unemployed because of disability) and (vi) annual household income and household size were used to compute the percentage of the Federal Poverty Level (FPL) and then create two binary variables: ‘living in poverty (< 100 % FPL)’ and ‘low income (< 300 % FPL)’(41). A diagnosis of COVID-19 was assessed at each survey wave with the question ‘Whether or not you have had a coronavirus test, has a doctor or another healthcare professional diagnosed you as having or probably having the coronavirus since (the date of previous survey)?’.
Household and social characteristics
As part of standard UAS procedures, the number of adults and children in the household is updated every 3 months. The most recent report of these measures was used to identify the following variables used in this study: household size, any children in the household and single parent households with children. Social network size and support have been associated with food insecurity(Reference Martin, Rogers and Cook21). Social circle size was assessed monthly with the question ‘About how many friends and family members do you have?’ (followed by a request to confirm the number was correct), and this number was log transformed for analyses. Social support to access food was assessed in July with the question ‘In the past 30 days, how many of these family and friends helped you to get enough food to eat, by sharing money, resources, or food with you?’. The percentage of one’s social circle that helped provide food was calculated by dividing the number that provided food support by the social circle size.
Food access and food environment
Participants were coded as living in a low food access neighbourhood, with limited spatial access to a grocery store (also known as a ‘food desert’), if they lived in a census tract defined as ‘low access tract at 1 mile for urban areas or 10 miles for rural areas’ in the U.S.D.A. Food Access Research Atlas(36). (We also explored U.S.D.A. indicators for census tracts that are both ‘low access’ and ‘low income’, but this did not change the results).
Because access to a personal vehicle has been associated with food access and a significantly lower risk of food insecurity(Reference Martinez, Clark and Gudzune42) in the past, we included two measures related to transportation. Every 3 months, respondents were asked ‘How many private vehicles (cars, vans, trucks, or SUVs) in working condition does your household currently own or lease?’, and their most recent response was used to identify participants with no (0) vehicle. In July, respondents were asked if they had challenges getting food because of lack of car or personal transportation (Yes/No).
Receipt of programmes and benefits
In all survey waves except 8–21 July, participants indicated whether anyone in their household had received any of the following government benefits in the past month (Yes/No): SNAP or Food Stamps; Special Supplemental Nutrition Program for Women, Infants and Children; unemployment insurance; Social Security; Supplemental Security Income; Social Security Disability Insurance; economic stimulus funds; aid for people or businesses affected by the coronavirus epidemic. Receipt of these benefits at each survey wave was treated as a time-varying explanatory variable. Receipt of Pandemic EBT benefit of up to $136/month for families whose children are eligible for funded school meals (described as ‘Pandemic EBT benefits for children in your household, to help pay for food because schools are closed’) was assessed at the end of the year (January 2021). At one survey wave (April 29–May 12), participants indicated whether they had received food from a food bank or food pantry in the past two weeks (Yes/No).
We also explored if the amount of money people received from these programmes predicted food insufficiency. However, these variables were excluded from the final models because they did not add predictive value and were not assessed at all waves or for all types of benefits.
Statistical analysis
Variables were checked for accuracy of responses, particularly with regard to the receipt of benefits. For example, if participants younger than 62 years reported receiving Social Security benefits, we assumed they were not likely to be eligible and this was corrected. After the data cleaning, the results of the statistical analysis were essentially unchanged.
We computed descriptive statistics for all variables used in the analyses. Longitudinal analysis to identify predictors of food insufficiency was performed using fixed effects models(Reference Mundlak43). A challenge for the analyses we have undertaken is that not all characteristics of respondents are captured by the data. For example, raw correlations between food insufficiency and receipt of SNAP benefits are positive, which could be interpreted as the receipt of SNAP benefits increasing someone’s risk for food insufficiency. A more plausible interpretation is that those who receive SNAP are generally in need of food assistance, a characteristic that is not fully captured by our data – although poverty level is one imperfect proxy. For this reason, we employed fixed effects models to account for non-time-varying individual factors that are not captured by our data.
The fixed effects model employed takes into account individual fixed effects but exploits a result derived by Mundlak(Reference Mundlak43), which shows that the estimates of time-varying explanatory variables are identical to a procedure where one does not include fixed effects but rather includes the mean of all time-varying variables as additional regressors. The coefficients of these means are interpreted as estimates of the correlation of the unobserved individual effects with the time-varying variables. The advantage of this procedure is that one can retain all non-time-varying explanatory variables and estimate their effects on the outcomes of interest. Thus, the advantage of the use of a fixed effects models is that it accounts for the effect of non-observed time invariant factors and in that way accounts for possible reverse causality. For example, as in the example above where the positive correlation between food insufficiency and SNAP receipt plausibly reflects unobserved factors that make families at higher risk of food insufficiency more likely to be SNAP recipients. The general interpretation of the estimated coefficients of time-varying explanatory variables (like SNAP receipt or employment status) is that they measure the effect of changes in the explanatory variables on changes in the dependent variable (food insufficiency in this case). Since we consider brief 2-week periods, these estimates reflect short-term effects (e.g. how SNAP receipt within a 2-week period affects food insufficiency in that period). The effects of non-time-varying variables are by construction constant during the observation period. For example, the effect of education on food insufficiency is assumed not to vary during the sample period. An additional benefit of using fixed effects models is that they account for the correlation in longitudinal data from the same individual, which may be due to unobserved factors that differ between individuals such as personality and survey response styles. Fixed effects models eliminate these sources of correlation between waves.
We also fit ordinary least squares regression models, which do not take into account unobserved individual characteristics, to explore the stability of results across the two approaches. The results presented are consistent with the trends identified in the ordinary least squares. Survey weights were not included in the regressions or fixed effects models as this would amount to assuming heteroskedasticity (i.e. the error term has different variances for different observations), where respondents with high weights would be assumed to give the most accurate information. There is no reason for such an assumption, and so weighting would likely make the statistical inference less precise. The results of the fixed effects model and significant effects (P < 0·05) are described in the results.
Results
Descriptive statistics
Between April and December 2020, the average rate of past week food insufficiency across all surveys was 10 % (Table 2). However, rates of past week food insufficiency differed markedly over time, peaking at 23 % during the beginning of April, when our survey started just weeks after L.A. County ‘stay at home’ orders were issued, declining to 12 % by early May, and fluctuating between 8 and 11 % in June–December (Fig. 2). Among respondents who completed all nineteen survey waves, we found that 26 % had experienced food insufficiency at one or more waves from April to December 2020.
Table 2. Descriptive statistics (unweighted) for food insufficiency and explanatory variables, split by adults who were food sufficient v. food insufficient (at any time) between April and December 2020

Obs., number of observations over all waves; GED, Tests of General Educational Development; FPL, Federal Poverty Level; SNAP, Supplemental Nutrition Assistance Program; WIC, Special Supplemental Nutrition Program for Women, Infants, and Children.
For variables that are assessed at multiple waves (time varying), the data from all waves were used to compute the summary statistics, while for variables assessed at only one wave (time invarying), data from that one observation were used to compute the summary statistics. For example, variables assessed at all nineteen waves for all 1535 participants have 27 630 potential observations, while variables assessed at one wave for all 1535 participants have 1535 potential observations. Thus, the variables are represented as they are analysed in the statistical models.
* Social circle size = the number of family and friends they have.
† Low food access neighbourhood = a census tract defined as a food desert based on the U.S.D.A.’s definition of ‘low access tract at 1 mile for urban areas or 10 miles for rural areas’.
‡ Household does not have a vehicle = participant reported that their household does not own or lease any private vehicles.
§ Difficulty getting food because no car = participant reported that they had challenges getting food because they lacked a car or personal transportation.
|| % of social circle that helped with food = participant’s estimation of the proportion of their family and friends (social circle) that helped them to get enough food to eat, by sharing money, resources or food.

Fig. 2 Percent of the L.A. County adult population that experienced past week food insufficiency and received government benefits, by survey wave (weighted statistics).
SNAP = Supplemental Nutrition Assistance Program; WIC = Special Supplemental Nutrition Program for Women, Infants and Children; UI = Unemployment Insurance; SS = Social Security, SSI = Supplemental Security Income; SSDI = Social Security Disability Insurance.
Note. Most benefits were not assessed in UAS 252, 8–21 July
Table 2 presents descriptive statistics for all variables included in the analysis for all participants and split by participants who experienced food insufficiency (i) never and (ii) at any time between April and December. The descriptive statistics show a higher rate of food insufficiency among women, younger adults, Hispanic/Latinx and people reporting less education, low incomes, unemployment and lacking personal transportation. Rates of food insufficiency also varied with receiving food assistance from family and friends, food pantries and government programmes, including SNAP, Special Supplemental Nutrition Program for Women, Infants and Children and the new Pandemic EBT benefit. Some challenges with food access were more common among people experiencing food insufficiency (Table 2). The proportion of people living in low food access neighbourhoods was higher among people who were food sufficient (13 %) v. food insufficient (9 %).
Figure 2 and the associated online supplementary material, Supplemental Table 1 present weighted descriptive statistics for rates of food insufficiency and the time-varying explanatory variables over the nineteen survey waves. They show that the percentage of the L.A. County population receiving many government benefits was stable, while SNAP use increased from 12 % in April to 16 % in July, an increase that is consistent with local government records(44). Most households that received government economic stimulus funds and ‘coronavirus aid’ did so between April and July.
Predictors of food insufficiency
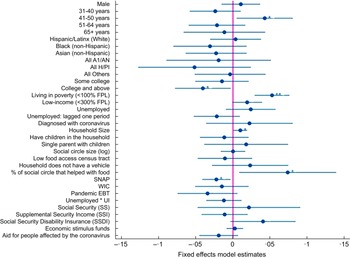
Figure 3 (online supplementary material, Supplemental Table 2) shows that living in poverty predicted food insufficiency (est. = 0·05, P < 0·001). Given the average 10 % rate of food insufficiency, having a household income < 100 % FPL increased the risk of food insufficiency by 53 % (i.e. 5·3 percentage points on a base of 10 %). Age also predicted food insufficiency: relative to 18–30-year-olds, the risk for food insufficiency was lower for all age groups except 41–50-year-olds. Being 41–50 years old increased the risk for food insufficiency by 43 % (est. = 0·04, P = 0·03). Finally, having a larger household significantly increased risk for food insufficiency (est. = 0·01, P = 0·04), with each additional household member increasing the risk by 10 %. Having a college education significantly lowered risk for food insufficiency by 41 % (est. = –0·04, P = 0·04). Other demographic, health and household factors did not significantly predict food insufficiency

Fig. 3 Fixed effects model results: Predictors of past week food insufficiency in L.A. County, April to December 2020. Points represent the estimate for each variable, and lines the 95% confidence interval around the estimate.
AI/AN = American Indian/Alaskan Native; H/PI = Hawaiian/Pacific Islander; FPL = Federal Poverty Level; SNAP = Supplemental Nutrition Assistance Program; WIC = Special Supplemental Nutrition Program for Women, Infants, and Children; UI = Unemployment insurance
*P < 0·05, **P < 0·01, ***P < 0·001
Challenges with food access did not predict food insufficiency. The null effect of living in a low food access neighbourhood (est. = –0·01, P = 0·56) may partly be explained by some wealthy areas in L.A. County having few grocery stores, although additional analyses indicated living in a low-income food desert also did not predict food insufficiency. Although 12 % of people who experienced food insufficiency did not have a vehicle (v. 8 % of those who were food sufficient), and 21 % reported having difficulty getting food because they did not have a car (v. 4 % of those who were food sufficient), lack of a vehicle was not a significant predictor of food insufficiency in the fixed effects models (est. = 0·02, P = 0·38). The latter question asking about difficulty accessing food because they did not have a car was very strongly related to food insufficiency and was not included as a predictor of food insufficiency because of the high correlation and its formulation which makes the presence of food insufficiency more likely (this effect is denoted as N.S. in online supplementary material, Supplemental Table 2).
The receipt of some types of support and benefits was associated with food insufficiency risk, most with lower risk, but some with higher risk. The receipt of SNAP and Special Supplemental Nutrition Program for Women, Infants and Children was both associated with reduced food insufficiency, but this relationship was only statistically significant for SNAP (est. = –0·02, P = 0·02). Participants getting SNAP (v. not) were 22 % more likely to transition from food insufficiency to food sufficiency. Getting Pandemic EBT had a negative but non-significant association with food insufficiency (est. = –0·03, P = 0·097). Receipt of unemployment insurance, Social Security, Supplemental Security Income, economic stimulus funds and coronavirus aid was not significantly associated with a reduction in food insufficiency (see Fig. 3 and online supplementary material, Supplemental Table 2).
Having a greater proportion of one’s social circle who ‘provided help with food’ positively predicted food insufficiency (est. = 0·07, P = 0·03). This may reflect a process where people experiencing food insufficiency have social circles that respond to this need by providing help (rather than a process where receiving food help increases one’s risk for remaining food insufficient).
Joint tests for the effects of programmes and benefits received were also explored, because these explanatory variables are likely correlated (i.e. people who receive one type of benefit can be more likely to receive other benefits), and this correlation can lead to insignificant individual coefficients, while they are jointly significant. However, none of the joint tests was statistically significant. Finally, the model included coefficients of the averages of the time-varying variables, which represent the correlation of the unobserved individual characteristics with the time-varying explanatory variables (statistics available on request). We find that the individual effects that make one more likely to experience food insufficiency also make one significantly more likely to be unemployed and to receive SNAP, Social Security Disability Insurance and stimulus money.
Discussion
The results of this study, which rapidly and regularly monitored food insufficiency in L.A. County, show that the COVID-19 pandemic quickly led to a rise in rates of food insufficiency among county residents. On average, 10 % of L.A. County residents (i.e. one million people) experienced past week food insufficiency between April and December 2020. This is aligned with national statistics reporting that the average rate of household food insecurity in California was 9·8 % between 2018 and December 2020(Reference Coleman-Jensen, Rabbitt and Gregory8), based on surveys that assessed peoples’ experience of food insecurity over the previous 12 months. However, this annual survey masks the large fluctuation in rates captured by our biweekly surveys, which found that the highest rates of food insufficiency – up to 23 % past week food insufficiency – were observed at the onset of the pandemic. Historically, the county has monitored food insecurity only among low-income households (< 300 % FPL), and the proportion of low-income households that experienced food insecurity at some point in the previous 12 months was 31 % in 2011, 29 % in 2015 and 27 % in 2018(45). In 2018, it is likely that approximately 5 % of low-income households experienced food insecurity in a given month(45). Given the major shock of the pandemic to L.A. County’s economic, social and food systems, a spike in food insecurity was anticipated, but it was alarming to find that almost a quarter of the population experienced food insufficiency – the most severe dimension of food insecurity – within weeks of the pandemic onset.
Aligned with previous evidence(Reference Gundersen and Ziliak12), this study found that poverty, low household income and less education were key risk factors for food insufficiency during the pandemic. Although race and ethnicity did not predict food insufficiency in our multivariate statistical models, Hispanic/Latinx residents of L.A. County were disproportionately impacted by food insufficiency. Thus, initiatives to provide food assistance to these populations that pre-dated the pandemic were likely well-positioned to reach communities at risk for food inequities when the pandemic hit. This study also found that residents with a larger household size had additional risk for food insufficiency. Because household size is accounted for when computing household poverty and low-income status, the independent effect of household size suggests that larger households, regarless of their income level, have an increased risk for food insufficiency, perhaps due to more food requirements.
One less expected finding was that adults aged 41–50 had the highest risk for food insufficiency during the first year of the pandemic, relative to other age groups. Historically younger adults are more likely to experience food insecurity and insufficiency than older adults(Reference Gundersen and Ziliak12). But, at the onset of the pandemic, there was concern that low-income older adults (e.g. 65 and up) would face challenges getting enough food as they would be more likely to shelter at home, lose social and community supports, and because they may have less digital literacy to access emerging food assistance programmes. We found adults ≥ 65 years made up 17 % of our study population, but only 7 % of the sub-population that experienced food insufficiency, and in our statistical models they had the lowest risk for food insufficiency. Older adults appear to have been less impacted by the pandemic-related financial crisis, as they are less likely to be in the workforce (and thus impacted by unemployment) and more likely to have stable sources of incomes and savings. This age group may also have been well served by the programmes that emerged to deliver food to older adults(46). However, low- to middle-income adults aged 41–50 were more likely to have lost jobs and incomes, and they may have dependents on ‘both sides’ (i.e. children and parents) and larger financial obligations, compared to their younger or older counterparts. This finding highlights the importance of quickly monitoring and identifying segments of the community experiencing food insecurity and insufficiency during a given crisis, to tailor the outreach and the response(Reference de la Haye, Miller and Weber47).
The environments in which L.A. County residents live is varied, reflecting the diversity in cultural groups and landscapes that span the counties’ many cities – such as Compton, Los Angeles, Santa Monica and West Hollywood. Participants in our study who experienced food insufficiency had larger households, but smaller social networks, compared to those who were food sufficient. More than one in ten people in our sample (12 %) lived in a food desert, with poor access to a grocery store, and 21 % of people experiencing food insufficiency reported that they had difficulties getting food because they did not have a vehicle. These potential barriers to food access did not significantly increase Angelenos’ risk for food insufficiency. Nonetheless, they should be taken into consideration in future research as possible risk factors for broader experiences of food insecurity and in future efforts to make local food systems more fair and resilient(Reference Hawkes and Squires5).
Finally, the results of this study provide evidence that governmental food assistance through the SNAP programme was associated with a lowered risk for food insufficiency. SNAP has historically ameliorated food insecurity(Reference Gundersen and Ziliak11) and food insufficiency(Reference Gundersen, Kreider and Pepper48) and appears to have continued to do so during the pandemic. The 20 % reduced risk for food insufficiency found in our results matches previous evidence: that SNAP programme participants are between 5 and 20 percentage points less likely to be food insecure than nonparticipants, after accounting for factors that lead people to enrol in the programme (including the experience of food insecurity itself)(Reference Gundersen and Ziliak11). As food insufficiency spiked, SNAP’s reach into low-income communities expanded with the County government recording a 20 % increase in enrolments between March and August(Reference de la Haye, Miller and Livings49). Although this is certainly a success, it is also worth noting that 15–27 % of L.A. County residents were likely eligible for SNAP, but not enrolled(Reference de la Haye, Miller and Livings49). Historically, food insecure households may under-enrol in or not be eligible for SNAP(Reference Gundersen50). It is also important to note that SNAP is not accessible for undocumented residents, and a limitation of our study is that we do not know if the sample is representative of the undocumented population, which is estimated to be 880 000 residents in L.A. County(51).
Pandemic EBT was not significantly associated with food insufficiency. This newly established government food assistance programme provided additional assistance to families with children eligible for free or reduced-price school meals.(34) Perhaps because its benefits were issued for children, receipt of pandemic EBT was not significantly associated with reduced food insufficiency for adult survey respondents. Other government benefits that provided financial assistance, including Social Security and the temporary economic stimulus funds and coronavirus aid, were not associated with lower food insufficiency risk, perhaps because this money was being spent on other pressing financial needs like delayed rent and other bills.
Study strengths and limitations
A key strength is that the study participants constituted a large and representative sample of the L.A. County population, allowing us to infer population-level rates of food insufficiency, and risk factors and solutions for a large and diverse urban population. Additionally, the panel participants were surveyed every 2 weeks throughout the pandemic, providing longitudinal data with temporal richness in both the experience of food insufficiency and changes to participants’ use of food assistance supports, programmes and other benefits. This allowed us to test if change in these exposures predicted change in food insufficiency.
A limitation is that the food insufficiency measure used in this study, a subset of items from the FIES(Reference Cafiero, Viviani and Nord38), which was selected in part because of its’ brevity (an important criteria in large panel surveys), is not the same measure used historically by L.A. County to track food insecurity, the U.S.D.A.’s U.S. Adult Food Security Survey Module(52). Also, for brevity, we used three of eight FIES items that are central as seen in item-total correlations(Reference Cafiero, Viviani and Nord38,Reference Cafiero, Melgar-Quinonez and Ballard39) , but that focus on a more severe dimension of food insecurity (Table 1).
Because the study was not an experimental design, it is possible that the significant associations we observed in this longitudinal study (e.g. the receipt of SNAP being associated with a transition from food insufficiency to food sufficiency) may be explained by other unmeasured confounding variables. This limits our ability to identify causal effects. Also, because we considered brief 2-week periods between survey waves, the fixed effect model estimates reflected relatively short-term effects of time-varying variables (e.g. receipt of SNAP or stimulus funds) on food insufficiency, rather than potential longer-term effects (e.g. if the receipt of stimulus checks had an impact on food insufficiency over a longer timeframe).
A further limitation was that the U.S.D.A. measure of neighbourhood food access(36) did not capture change in food outlets (closures, openings) related to the pandemic and associated mandates for business opening times and capacity.
Conclusions
This study highlights the value of rapidly monitoring population food insecurity and insufficiency during a sustained crisis to determine the level of risk, who is at risk, and the barriers they face. We found that the COVID-19 pandemic caused high rates of food insufficiency in L.A. County, with poverty, low income, less education and larger households increasing food insufficiency risk. Middle aged adults (41–50 years old) were a segment of the population at especially heightened risk, who may require tailored outreach and interventions.
This study also finds evidence for the benefits of government food assistance programmes in alleviating food insufficiency during a crisis. Varied emergency food and financial assistance programmes were used by the many L.A. County residents who experienced food insufficiency in the first year of the COVID-19 pandemic, including help from family and friends, food pantries, and government emergency relief and sustained programmes. Although emergency food assistance can provide short-term benefits(Reference An, Wang and Liu20), it was a sustained government food assistance programme – SNAP – that appears to have meaningfully alleviated food insufficiency. Efforts to quickly increase access to and enrolments in this type of government programme are likely to help reduce food insufficiency and insecurity in large urban populations during a sustained crisis.
Supplementary material
For supplementary material accompanying this paper visit https://doi.org/10.1017/S1368980023001337
Acknowledgements
This research was conducted in coordination with the Los Angeles County Emergency Food Security Branch as part of a strategic partnership on food insecurity between Los Angeles County and the University of Southern California (USC) Dornsife Public Exchange. We are grateful for the expert advice of the Emergency Food Security Branch’s staff and leadership, particularly Gary Gero and Alison Frazzini. We would also like to acknowledge the Understanding Coronavirus in America project at the University of Southern California Center for Economic and Social Research, which administers the tracking survey and provided support for the data analysis.
Authorship
K. de la H.: Conceptualisation, methodology, funding acquisition, supervision, writing – original draft, review and editing. H.-W.S.: Formal analysis, methodology, writing – reviewing and editing. S.M.: Formal analysis, writing – reviewing and editing. W.B.de B.: Conceptualisation, writing – reviewing and editing. J.P.W.: Conceptualisation, writing – reviewing and editing. K.W.: Funding acquisition, project administration, resources, writing – reviewing and editing. A.F.: Conceptualisation, resources, writing – reviewing and editing. M.L.: Formal analysis, writing – reviewing and editing. M.B.: Project administration, writing – reviewing and editing. A.K.: Data curation, methodology, writing – reviewing and editing.
Financial support
This material is based upon work supported by the National Science Foundation under Grant No. 2125616 (PI: de la Haye). This project was also supported by the USC Dornsife Emergency Fund and the Keck School of Medicine of USC COVID-19 Research Fund through a generous gift from the W.M. Keck Foundation.
Conflict of interest
There are no conflicts of interests.
Ethics of human subject participation
This study was conducted according to the guidelines laid down in the Declaration of Helsinki and all procedures involving research study participants were approved by the University of Southern California ethics committee. Informed consent was obtained from all subjects.


 Open access