


Periconceptional intake of folic acid is known to significantly reduce a woman's risk of having a pregnancy affected by a neural tube defect (NTD)( 1 , Reference Czeizel and Dudas 2 ); yet public health measures to encourage women to consume a daily supplement have not been effective, particularly in higher-risk subgroups of the target population( Reference Mallard and Houghton 3 – Reference Stockley and Lund 5 ). Food fortification programmes present a complementary strategy to improve dietary intake of folic acid. In the USA, mandatory folic acid fortification of enriched cereal grain products was implemented in 1998 and has been estimated to provide 100–200 μg folic acid/d to reproductive-age women( Reference Quinlivan and Gregory 6 , Reference Yang, Carter and Mulinare 7 ). Most importantly, the incidence of NTD-affected pregnancies has declined substantially in the USA since implementation of the mandatory programme( Reference Williams, Mai and Edmonds 8 – Reference Boulet, Yang and Mai 11 ). Currently, regulations for folic acid fortification of flour have been mandated in over fifty countries, while many other countries are considering similar policies( Reference Crider, Bailey and Berry 12 ).
In 2007, Food Standards Australia New Zealand recommended a mandatory programme, effective October 2009, requiring the fortification of almost all types of bread with folic acid at a level of 80–180 μg/100 g bread( 13 ). While Australia implemented the programme as scheduled, mandatory fortification of bread in New Zealand was put on hold for 3 years due to concerns regarding safety, cost-effectiveness and impact on consumer choice. In the interim, the bread baking industry was requested by the government to adopt greater voluntary bread fortification with the major producers agreeing to add folic acid to approximately one-third of their range of breads at a level of 200 μg/100 g bread( 14 ). In 2008, there were only six breads fortified with folic acid in New Zealand with a rise in the number of fortified breads to thirty-four in 2011, accounting for approximately 12·5 % of production( 15 ). Following public submission and consultation, the mandatory fortification of bread in New Zealand was revoked in August 2012 and a new standard was signed allowing for the continued voluntary folic acid fortification of bread( 16 ).
To date, no study has assessed whether greater adoption of voluntary bread fortification has resulted in a significant improvement in dietary folate intakes of the target population. Efforts to assess dietary intakes have been limited by a lack of valid dietary assessment methods and incomplete food folate composition data. Using up-to-date food composition values which differentiate naturally occurring food folate and fortificant folic acid, the aims of the present analysis were to quantify dietary folate intakes of reproductive-age women at the time of the study in 2008, and to simulate the potential impact of increased voluntary folic acid fortification of bread and the proposed mandatory fortification programme on folate intake adequacy. In addition, food consumption data were used to determine the major contributors of dietary food folate including folic acid from voluntarily fortified foods.
Materials and methods
Study design and participants
The cross-sectional study was part of the baseline data collection for a folate intervention trial conducted between July 2008 and May 2009( Reference Hursthouse, Gray and Miller 17 , Reference Houghton, Gray and Rose 18 ). Healthy, reproductive-age women (18–40 years old) were recruited in July 2008 from the staff and student population at the University of Otago, Dunedin, New Zealand and from the local community through advertisements in the newspaper and word of mouth. Women were not included in the study if they were pregnant, lactating or were planning a pregnancy in the next 12 months. Based on the dose–response objective of the primary research study, additional exclusion criteria were regular use of folic acid-containing supplements in the previous 6 months; self-reported history of cardiovascular, gastrointestinal, hepatic, renal or haematological disease; and the use of medications that interfere with folate metabolism (e.g. methotextrate, sulfasalazine or anticonvulsants). The total number of women recruited was based on the sample size needed for the intervention trial (n 140). The study was conducted according to the guidelines laid down in the Declaration of Helsinki and all procedures involving human participants were approved by the Human Ethics Committee of the University of Otago, Dunedin, New Zealand.
Data collection
Sociodemographic and general health data were obtained using a self-administered questionnaire; height and weight were taken according to standardized procedures and measured to the nearest 0·1 cm and 0·1 kg, respectively. Participant ethnicity was classified as New Zealand European, Māori, Pacific, Asian or other ethnicities. Education was collapsed into three categories: secondary school or less, post-secondary education (university or college) and advanced degree.
Dietary data were collected by means of a 3 d weighed food record completed over two non-consecutive weekdays and one weekend day. Participants were provided with electronic digital scales accurate to 1 g (Vista Electronic Kitchen Scale, model 3010; Salter Housewares Ltd, Tonbridge, UK) and received oral and written instructions on how to weigh and record all foods and beverages consumed. Nutrient intakes were estimated from foods and beverages consumed using food composition data from the New Zealand Food Composition Database( 19 ). The dietary folate data in the New Zealand food composition table are reported in μg as naturally occurring food folate, folic acid (from fortified foods) and total folate (sum of food folate and folic acid). Commercial food products consumed by participants that were not in the New Zealand food composition tables were either substituted with similar foods in the New Zealand food composition table based on ingredients, or were manually added to the food composition table using similar foods obtained from the US Department of Agriculture database( 20 ) or brand-specific product data from food manufacturers when available. No missing values were permitted. For each of the foods consumed by our study participants, folate values (natural and folic acid) were assigned. Total folate intakes were expressed as dietary folate equivalents (DFE) using the following equation:
 $${\rm{DFE}}\, = \,{\rm{\rmu g}}\,{\rm{food}}\,{\rm{folate}}\, + \,{\rm{(\rmu g}}\,{\rm{dietary}}\,{\rm{folic}}\,{\rm{acid}}\,\times \,{\rm{1}} \cdot {\rm{7)}}{\rm{.}}\eqno\rm$$
Folate intake estimates were generated for three scenarios: (i) voluntary fortification of bread based on the Manufactured Foods Database in 2008 (six breads, median concentration 200 μg folic acid/100 g bread)( 15 ); (ii) increased voluntary fortification of bread in 2011 based on the New Zealand Association of Bakers (thirty-four breads, median concentration of 200 μg folic acid/100 g bread)( 21 ); and (iii) mandatory fortification of all breads with the exception of organic (median concentration of 130 μg folic acid/100 g bread, reflecting the mid-point of the range of proposed permitted folic acid fortification of bread (80–180 μg/100 g))( 13 ).
The top ten food sources of DFE and natural folate, and top five sources of folic acid, were determined by grouping all food items consumed by the study population into main food groups. When one particular food item within a group contributed significantly more folate or folic acid than other items within the same group, they were analysed separately. The total amounts of DFE, natural folate and folic acid consumed by all participants in each food group were used to calculate the percentage contribution to dietary folate intake, and ranked accordingly.
Statistical analysis
The statistical software package Stata version 11 was used for statistical analysis. Estimates of mean dietary folate intakes were expressed in μg as natural food folate, folic acid (from fortified foods) and DFE. Dietary intakes between the different fortification scenarios were compared using the non-parametric Wilcoxon signed rank sum test. To account for multiple pairwise comparisons, a Bonferroni-adjusted P value of 0·0167 was used to test for statistical significance at the P ≤ 0·05 level.
The prevalence of inadequate folate intake was calculated using the Estimated Average Requirement (EAR) cut-point method based on the Australian and New Zealand EAR of 320 μg DFE/d for non-pregnant and non-lactating women aged 19–50 years( 22 ), after statistically estimating the usual intake distribution by partially removing the day-to-day variability in the observed folate intakes (natural and DFE), i.e. within-person variation, using PC-SIDE version 1·012 (Department of Statistics, Iowa State University, Ames, IA, USA). PC-SIDE software developed to implement the Iowa State University method could not be applied to folic acid as the variable for this data set had too many observed zero intakes.
Results
Of the 140 participants enrolled in the study, complete weighed 3 d diet records were available for 125 participants. The characteristics of the study population are presented in Table 1. Participants were predominantly New Zealand European (75 %), relatively well-educated (88 % had some post-secondary education) and had a mean age of 24 (sd 6) years. Compared with recent census data, this sample had a higher proportion of New Zealand Europeans (75 % v. 68 %), a lower proportion of Māoris (5 % v. 15 %) and Asians (6 % v. 9 %) and no Pacific people (0 % v. 7 %)( 23 ). Using the US Institute of Medicine categories of BMI for normal, overweight and obesity, the majority of women (69 %) were classified as normal weight, with nearly all of the remaining women classified as overweight and obese (27 %).
Table 1 Demographic characteristics of the study participants: reproductive-age New Zealand women (n 125)

Values are presented as means and standard deviations or as numbers and percentages.
*Asian in this sample included people of Chinese, Vietnamese and Sri Lankan ancestries.
†Others in this sample included people of Australian, Canadian, American, Irish, Italian, African, Hungarian, Polish and Dutch ancestries.
Figure 1 shows the likelihood for usual folate intakes of participants at the time of the study in 2008 and as simulated based on the two fortification scenarios. The median and interquartile ranges of daily usual folate intakes before and after simulation of increased fortification are also presented in Table 2, along with the probability of having a dietary intake less than the EAR. Compared with dietary folate intakes as determined in 2008 at the time of the study, increased voluntary fortification of bread as of 2011 and mandatory fortification of bread as proposed resulted in significantly improved intakes of folic acid, and subsequently DFE, among participants (both P < 0·0 0 1). For example, the folic acid intake of the study population was estimated to increase by 10 μg/d with increased voluntary bread fortification, and the prevalence of intake inadequacy to decline by 8 %. Simulated mandatory fortification of all breads led to an increase in intake of 89 μg/d, and a marked reduction in the prevalence of folate inadequacy from 37 % before simulation to an estimated 5 % with mandatory fortification. No participants were consuming folic acid at intakes greater than the Tolerable Upper Intake Level with any of the three models. Only one participant consumed ≥400 μg folic acid/d (the supplemental amount recommended to minimize the risk of NTD) from fortified foods with mandatory bread fortification, while none of the women reached this level of intake under the voluntary food fortification scenarios.
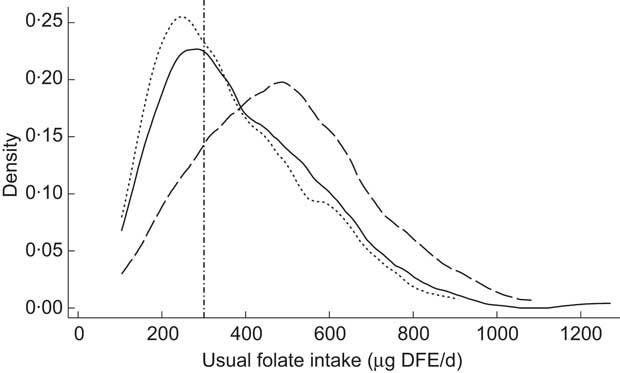
Fig. 1 Usual folate intakes of a sample of reproductive-age New Zealand women (n 125) before (-------, voluntary fortification 2008) and after simulated fortification based on increased voluntary bread fortification as of 2011 (———) and mandatory bread fortification, as proposed for implementation in 2012 (— — —). The vertical line (– · – · –) represents the Estimated Average Requirement (EAR; 320 μg dietary folate equivalents (DFE)/d). The y-axis, labelled ‘density’, shows the likelihood for each level of intake in the study population
Table 2 Dietary folate intake of reproductive-age New Zealand women (n 125) and comparisons with the Australian and New Zealand EAR as a cut-off point for assessing nutrient adequacyFootnote *
EAR, Estimated Average Requirement; IQR, interquartile range; DFE, dietary folate equivalents.
a,b,c Median values within a row with unlike subscript letters were significantly different (P < 0·05, Bonferroni-adjusted).
* Folic acid is reported as unadjusted median and interquartile range; natural folate and DFE values are expressed as the usual (adjusted) median and interquartile range.
† Absolute change from voluntary bread fortification prior to 2009 to increased voluntary bread fortification in 2011.
‡ Absolute change from voluntary bread fortification prior to 2009 to mandatory fortification as proposed.
Table 3 lists the major contributors of DFE, natural food folate and folic acid in the diet of participants at the time of the study. Breads and ready-to-eat breakfast cereals contributed 82 % of total overall folic acid intake. Bread was the most commonly consumed fortified food, with daily intakes ranging from 5 to 242 g and providing between 13 and 550 μg folic acid/d. The average intake of bread was 69 g/d, equivalent to approximately two slices. Ready-to-eat breakfast cereal was the second most commonly consumed fortified product. We calculated that a ready-to-eat breakfast cereal serving provided, on average, 105 μg folic acid (based on nutritional data supplied by the manufacturers for the five most commonly consumed ready-to-eat cereals) with daily cereal intakes ranging from 5 to 386 g, in turn providing 10 to 250 μg folic acid/d. Other fortified products that were generally consumed were yeast spreads, margarines and soya beverages, albeit the contributions to overall folic acid intakes by these food products were minimal. Vegetables, fruits and bread contributed 40 % to the overall natural food folate intake.
Table 3 Top contributing food sources and percentage contribution of DFE, natural food folate and folic acid intake to overall intake among reproductive-age New Zealand women (n 125)

DFE, dietary folate equivalents.
*Folic acid was found predominantly in only five food group sources.
Discussion
The present analysis demonstrates that the prevalence of inadequate folate intake among reproductive-age women in New Zealand at the time of the study (2008) was high (37 %). Simulation of the increased targeted voluntary fortification efforts of bread manufacturers as of 2011 showed a modest increase in the usual folic acid intake of participants, resulting in an 8 % overall reduction of inadequate folate intakes; however, mandatory fortification of bread with folic acid was estimated to substantially reduce the prevalence by 32 %. The results of the analysis clearly show that although efforts to increase the amount of fortified breads can have a beneficial impact on dietary folate intakes, it is far inferior to mandatory fortification as a reliable public health intervention.
Our findings add to the modelling activities undertaken for development of the mandatory folic acid food fortification programme. As part of the final assessment report published in 2006, it was estimated that reproductive-age women were consuming, on average, 58 μg folic acid/d from voluntary fortified foods, with a 95th percentile intake of 190 μg/d( 13 ). This estimate is highly comparable to our results, where women were consuming a mean of 64 μg folic acid/d at the time of the study, with a 95th percentile intake of 170 μg/d (data not shown). More importantly, similar to the assessment report, median folic acid intake (46 μg/d) was much lower than the mean intake, suggesting that while a small number of women in the study population were consuming a larger number of fortified foods, the majority were consuming relatively low amounts. Mandatory fortification of bread with folic acid was predicted to deliver an additional 140 μg of folic acid daily to the target population( 13 ). This estimate was based on the median consumption of three to four slices of bread daily as determined from a nationally representative food consumption survey conducted in 1997( 24 ). Habitual bread intake among our study participants was lower, consistent with recent findings in a retrospective survey of postpartum New Zealand women( Reference Mallard, Gray and Houghton 25 ). Subsequently, our results show that simulated mandatory folic acid fortification of bread provides a substantially lower median folic acid intake (89 μg/d) compared with the assessment report.
Despite the lower than anticipated intake of folic acid, our modelling results indicate that mandatory fortification of bread led to an overall median dietary folic acid intake of 135 μg/d, and substantially increased the proportion of women with intakes above 100 μg/d compared with voluntary fortification efforts. This is important to consider because although many governments, including the New Zealand Government, recommend that reproductive-age women consume a daily supplemental intake of 400 μg folic acid in the periconceptional period, it is increasingly acknowledged that the level of folic acid required to prevent most folate-responsive NTD may be lower( Reference Mosley, Cleves and Siega-Riz 26 , Reference Ahrens, Yazdy and Mitchell 27 ). For example, the USA and Canada implemented mandatory fortification of enriched grain products in 1998. Since then, estimates of usual intake of folic acid from fortified foods among North American reproductive-age women have been shown to range from 100 to 165 μg/d( Reference Shakur, Garriguet and Corey 28 , Reference Bailey, Dodd and Gahche 29 ). Using case–control data from the Slone Birth Defects Study, Ahren and colleagues( Reference Ahrens, Yazdy and Mitchell 27 ) recently investigated the risk of NTD in relation to maternal folic acid supplementation and dietary folate intake in the post-fortification era. The authors found that periconceptional folic acid supplementation did not appear to decrease the risk of spina-bifida-affected pregnancies compared with women who had reported no supplementation – even among women consuming low amounts of dietary folic acid. The lack of benefit among supplement users suggests that women have attained sufficient folic acid intakes from the fortified food supply to prevent nearly all folate-sensitive NTD.
Despite the benefits of mandatory folic acid fortification, the New Zealand Government revoked the programme in August 2012 and set forth to encourage the major bread manufacturers to adopt greater fortification of their products with a particular focus on breads thought to be consumed more often by women. Data herein show that the increase in fortified breads may have led to a slight shift in the overall median consumption of folic acid among reproductive-age women; however, it is unknown from our study population whether this shift would be equally distributed among income and educational levels or regions. Moreover, the folic acid intakes modelled on increased bread fortification may be overestimated as recent analytical testing of fortified breads revealed significant variability in the folic acid content of the highest selling breads, with actual amounts measuring well below the set objective of 200 μg folic acid/100 g bread( 30 ). Where mandatory fortification provides clear governance of the type of foods to be fortified and the amount of fortifying agent that can be added, a non-binding agreement with the bread industry to increase the range of voluntary fortified breads is potentially unreliable. Future intentions by the government and the baking industry to increase the fortified breads from one-third to one-half of packaged breads underscores the need to monitor the effectiveness of this targeted intervention using analytically determined folic acid values.
It is possible that sufficient amounts of folate could be obtained from our food supply if voluntary fortification practices were more liberal and proper food choices were made. Bread was chosen as the vehicle for mandatory fortification as most women of reproductive age eat bread regularly and it is not traded internationally; however, a number of other food products have been able to be fortified voluntarily in New Zealand since 1996 including: breakfast cereals, pasta, fruit and vegetable juices and drinks, and legume and cereal analogue foods such as soya and rice milk. Based on consumption patterns at the time of our study, voluntarily fortified bread was the main contributor of folic acid intake to the diet followed by ready-to-eat breakfast cereals. The number of breakfast cereals fortified with folic acid has increased by 30 % between 2003 and 2006( 31 ). In contrast to bread, mean concentrations of measured folate in a sample of breakfast cereals showed the amount of folic acid per serving was well above the manufacturer label claim in nine of thirteen sampled cereals, with overages ranging from 24 to 198 %( 31 ). Breakfast cereals are consumed by 70 % of the population( 32 ) and permission to increase the maximum allowable level may serve to further shift usual folate intakes. For example, in the USA, the legislation specifies up to 400 μg folic acid per serving of breakfast cereal compared with current New Zealand regulations, which allows only 100 μg folic acid per reference quantity( 33 ). The three remaining food categories contributing to folic acid intakes among study participants were yeast spreads, margarines and fortified beverages. In addition to encouraging fortification uptake by manufacturers of permitted foods, other suitable food staples and condiments not currently listed should be considered. For example, rice is not included on the list of permitted foods for fortification; however, it may present a feasible food fortification vehicle in the diet of the country's increasing Asian sub-population( 34 ).
To our knowledge, the present analysis is the first in New Zealand to report naturally occurring food folate and fortificant folic acid intakes among the target population, and to simulate the effect of increased voluntary fortification of bread on folate adequacy. Nevertheless, there are a number of study limitations. First, the actual amount of folate in the food supply is unknown. As described above, a certain amount of over- and under-fortification of fortified foods is likely present; however, with few foods analysed using state-of-the-art assay methods, the validity of the folate values listed in the compositional table is uncertain. In addition, the natural folate content of fortified foods was not determined analytically but rather by subtracting the concentration of folic acid from the manufacturer's label information from the total folate content derived from analytically measured values or from carefully considered estimations derived from other known analytical folate values. These issues underscore the need to establish a credible database for food folate using reliable analytical methods. Second, study participants may under-report dietary intake leading to an overestimation of the proportion of women at risk of not meeting their folate requirement. While we cannot disregard under-reporting, inherent strengths of our dietary collection method include the use of 3 d weighed food records and application of an established statistical method to adjust within-person variability to estimate usual and inadequate folate intakes. Lastly, our study population was not representative of the target population and therefore the results cannot necessarily be generalized to all New Zealand reproductive-age women. The majority of our study participants were New Zealand European and had a post-secondary education. Nationally representative survey data on dietary and supplemental folate intakes would be of value to determine true prevalence of inadequate folate intakes, particularly given the recently documented disparities in periconceptional folic acid supplement use and reported differences in bread consumption patterns between New Zealand European and Māori and Pacific people( Reference Mallard, Gray and Houghton 25 , Reference Mallard, Gray and Houghton 35 ).
Conclusion
The present results indicate that the probability of folate intakes being inadequate among our reproductive-aged study participants is unacceptably high – even despite the recent commitment by the baking industry to increase the range of breads fortified with folic acid. For this reason, mechanisms to extend voluntary fortification practices and increase industry participation are needed along with public health efforts to educate women about choosing foods rich in folate and encouraging the uptake of a folic acid-containing supplement during the periconceptional period. Accurate nationally representative baseline assessment of dietary folate intakes is required to evaluate the impact of currently available fortified products in context with socio-economic and biological risk factors for deficiency. Moreover, nationally available food consumption data will allow for simulation of different folic acid fortification levels of both permitted and proposed foods on the prevalence of inadequate and excess folate intakes across all life-cycle groups.
Acknowledgements
Sources of funding: This study was supported by a University of Otago Research Grant. Conflicts of interest: The authors declare that they have no conflict of interest. Authors’ contributions: Each author contributed to the development of this work. L.A.H. was responsible for the study design, statistical analysis and writing. S.E.E. and V.L.M. were responsible for entering the dietary data, analysing the data and contributed to the writing and editorial review. M.C.P. and J.C.M. coordinated the study and contributed to the editorial review.


