


High sugar consumption during pregnancy has been associated with a number of adverse pregnancy health outcomes including excessive gestational weight gain (GWG), gestational diabetes and preterm delivery(Reference Goran, Plows and Ventura1). In light of such findings, consumption of artificial sweeteners (AS) has been promoted as a healthier alternative for weight management because of their low energy content(Reference Rahavi, Altman and Stoody2). AS are synthetic sugar substitutes (e.g. aspartame, sucralose, acesulfame-K and saccharin) that provide a sweet taste to foods (e.g. soft drinks, baked goods, candies and dairy products) without the high energy content associated with energetic sugars. Over the last decade, AS are increasingly being added to the food supply(Reference Piernas, Ng and Popkin3). Although AS consumption is higher in non-pregnant women(Reference Sylvetsky, Figueroa and Rother4), studies in western countries have shown that more than one-third of pregnant women consume AS, with the majority of women consuming AS more than once per week(Reference Sylvetsky, Figueroa and Rother4–Reference Maslova, Strom and Olsen6).
The use of AS is regulated by international agencies such as Codex Alimentarius, Health Canada, the Food and Drug Administration (FDA) and the European Food Safety Authority(7–9). According to Diabetes Canada and the Academy of Nutrition and Dietetics, AS are considered safe for use during pregnancy within the acceptable daily intakes(10,Reference Fitch and Keim11) . However, two recent meta-analyses in the non-pregnant population (one including thirty-seven studies, n 0·4 million, and the other including seventeen studies, n 10 million) have identified a positive association between the consumption of AS and obesity, type 2 diabetes, metabolic syndrome and cardiovascular events(Reference Imamura, O’Connor and Ye12,Reference Azad, Abou-Setta and Chauhan13) . Studies in animals have linked the effect of AS to changes in hormones, microbiota and taste preference(Reference Pepino and Bourne14,Reference Suez, Korem and Zeevi15) .
Given that the prenatal period is critical for fetal programming, concerns have been raised about the impacts of AS consumption during pregnancy on maternal and child health(Reference Palatnik, Moosreiner and Olivier-Van Stichelen16). Animal studies have demonstrated that prenatal exposure to AS increases the body weight, visceral fat deposition and fasting glucose levels in the offspring(Reference Collison, Makhoul and Zaidi17,Reference Collison, Inglis and Shibin18) . AS consumption by obese pregnant and lactating rats altered the gut microbiota of the offspring in their early lives (6 weeks), causing impaired glucose tolerance, as shown with faecal microbiota transplant(Reference Nettleton, Cho and Klancic19). However, evidence regarding human health effects due to the prenatal use of AS is conflicting. While some studies have reported an association between AS use and an increased risk of preterm delivery(Reference Englund-Ogge, Brantsaeter and Haugen5,Reference Halldorsson, Strom and Petersen20) , other studies have not found any association(Reference Petherick, Goran and Wright21). Further investigations are needed to clarify the effects of prenatal AS consumption. The aim of this study was to systematically identify, critically appraise and quantitatively synthesise existing evidence regarding the potential association between prenatal AS consumption and birth outcomes.
Methods
Protocol and registration
This review was performed in accordance with the Preferred Reporting Items for Systematic Reviews and Meta-Analyses (PRISMA) guidelines on systematic reviews and meta-analyses(Reference Moher, Liberati and Tetzlaff22). The protocol was registered with the International Prospective Register of Systematic Reviews (PROSPERO) (Registration no. CRD 42019136728).
Information sources
A structured search of electronic databases (Medline, CINAHL, Embase, Cochrane Library, Scopus, Web of Science, FSTA – the food resource database and ClinicalTrials.gov) up to 9 April 2020 was performed by a research librarian. The language of publication was not restricted. The reference lists of included papers and relevant systematic reviews were checked for additional relevant studies. The complete search strategy is presented in the Supplemental Document.
Eligibility criteria
This study was guided by the participants, interventions, comparisons, outcomes and study design (PICOS) framework.
Study design
Primary studies of any design were eligible; case studies, narrative or systematic reviews, meta-analyses and editorials were excluded.
Population
The population of interest comprised pregnant women (at any stage of pregnancy). The inclusion was not restricted by the maternal age or health conditions.
Intervention/exposure
The intervention/exposure included any type/dosage/frequency of AS. The intervention/exposure described as ‘diet sodas’ was included when the sweeteners used in the products were classified as AS.
Comparison
Eligible comparators were no AS consumption during pregnancy.
Outcomes
Primary outcomes: preterm delivery (PTD, <37 weeks of gestation), gestational age and birth weight.
Secondary outcomes: GWG, inadequate GWG, excessive GWG(Reference Medicine23), large for gestational age (LGA, a weight above the 10th percentile for the gestational age), small for gestational age (a weight below the 10th percentile for the gestational age), C-section, miscarriage (or spontaneous abortion, defined as loss of a fetus prior to 20 weeks of gestation)(24), stillbirth (a fetal death occurring after 20 completed weeks of pregnancy)(Reference Macdorman and Gregory25), gestational hypertension (a new-onset elevated blood pressure (≥140/90 mmHg) after 20 weeks of gestation without proteinuria or end-organ involvement), preeclampsia (the development of hypertension with evidence of end-organ effects or proteinuria after 20 weeks of pregnancy)(26), glucose intolerance and gestational diabetes mellitus (any degree of glucose intolerance with onset or first recognition during pregnancy as defined by the criteria used by the study)(27). Child BMI-z score (or its equivalent BMI-for-age percentile, measures relative weight adjusted for child age and sex)(Reference Must and Anderson28), overweight (age- and sex-specific WHO cut-offs or defined by the study)(Reference Corby and Secker29), asthma (doctor diagnosed asthma) and allergic rhinitis (doctor diagnosis of hay fever).
Study selection and data extraction
After the removal of duplicates, two reviewers (C.C. and M.H.D.) independently assessed the titles and abstracts of articles by online software Covidence (Veritas Health Innovation). Studies were selected for full-text review by at least one reviewer. All full-text articles were screened by two reviewers independently for eligibility (C.C. and M.H.D.). In the event of disagreement, eligibility was determined based on discussion between the two reviewers and by decision of a third reviewer when needed. Two reviewers independently extracted the data in Microsoft Excel. If the study had multiple publications, the most recent or complete publication was selected for meta-analysis; however, relevant data from all publications were extracted. Study characteristics (e.g. study period, study design, country) and population characteristics (e.g. number of participants, age, pre-pregnancy BMI, parity, pregnancy complications), exposure/intervention (frequency, dose and type of AS) and outcomes (PTD, gestational age, birth weight, and GWG, LGA, small for gestational age, inadequate GWG, excessive GWG, C-section, miscarriage, stillbirth, gestational hypertension, preeclampsia, glucose intolerance, gestational diabetes mellitus, BMI-z score, overweight, asthma and allergic rhinitis) were extracted (see online supplementary material, Supplemental Table 1). Any differences related to the data extraction were resolved by rechecking the full text of the study or by discussion. If data were not available for extraction, the corresponding authors were contacted for additional information. Where data were only presented in figures and authors could not be reached via email, data were extracted using WebPlotDigitizer (Web Plot Digitizer, V.3.11: Ankit Rohatgi, 2017), an online tool that supports the extraction of numeric data from graphs(Reference Cramond, O’Mara-Eves and Doran-Constant30,Reference Drevon, Fursa and Malcolm31) .
Quality assessment and certainty assessment
Quality assessment (Risk of bias)
Two reviewers independently assessed the quality of the studies. The Cochrane Risk of Bias Tool was used for randomised controlled trials. Study quality of prospective cohort, case–control and cross-sectional studies were accessed by using the NIH ‘Quality Assessment Tool(32). For example, cohort study was assessed by the NIH Quality Assessment Tool for Observational Cohort, and cross-sectional studies include the assessment of selection bias, information bias and confounding bias based on the following questions: selection bias (1. Was the research question or objective in this paper clearly stated? 2. Was the study population clearly specified and defined? 3. Was the participation rate of eligible persons at least 50 %? 4. Were all the subjects selected or recruited from the same or similar populations? Were inclusion and exclusion criteria for being in the study prespecified and applied uniformly to all participants? 5. Was a sample size justification, power description or variance and effect estimates provided? 13. Was loss to follow-up after baseline 20 % or less?), information bias (6. For the analyses in this paper, were the exposure of interest measured prior to the outcome being measured? 7. Was the timeframe sufficient so that one could reasonably expect to see an association between exposure and outcome if it existed? 8. For exposures that can vary in amount or level, did the study examine different levels of the exposure as related to the outcome? 9. Were the exposure measures clearly defined, valid, reliable and implemented consistently across all study participants? 10. Was the exposure assessed more than once over time? 11. Were the outcome measures clearly defined, valid, reliable and implemented consistently across all study participants? 12. Were the outcome assessors blinded to the exposure status of participants?) and cofounding bias (14. Were key potential confounding variables measured and adjusted statistically for their impact on the relationship between exposure and outcome?). Risk of bias across studies was rated as ‘serious’ when studies with the greatest influence on the pooled result (contributing >50 % of the weight of the pooled estimate in forest plots) presented ‘poor’ quality.
Certainty assessment (GRADE)
The certainty of the evidence across each outcome was assessed by the Grading of Recommendations Assessment, Development and Evaluation (GRADE) tool(Reference Guyatt, Oxman and Vist33). Evidence from randomised controlled trials began with a ‘high’ certainty of evidence rating and was downgraded if there were concerns of risk of bias, indirectness, inconsistency or imprecision. Evidence from all observational studies began with a ‘low’ certainty rating. The initial ‘low’ rating was upgraded when there was evidence for large magnitude of effect, evidence of dose–response, counteracting plausible residual bias or confounding(Reference Balshem, Helfand and Schunemann34). Inconsistency across studies was considered serious when heterogeneity was high (I 2 ≥ 50 %) or when only one study was assessed (I 2 unavailable). Following the GRADE recommendations(Reference Huguet, Hayden and Stinson35), GRADE can be used only for single study; however, we need to rate down for inconsistency since this is an indicator that the literature is not well established in the area. Imprecision was considered serious when the 95 % CI crossed the line of no effect. Imprecision was not considered serious when only one study was assessed because the study would have already been downgraded for inconsistency for this reason. Finally, publication bias was assessed via funnel plots when more than ten studies were included in the forest plot. Publication bias was not assessed when there were fewer than ten studies.
Data synthesis
Review Manager v5.3 (Cochrane Collaboration) was used to conduct the statistical analyses. For continuous outcomes, mean values and their sd were used in the meta-analyses. Risk ratio (RR) and corresponding 95 % CI were used to assess the association between the clinical outcomes and AS consumption. If adjusted data were available, we calculated the natural logarithms of the effect measure and corresponding se; otherwise, we included the unadjusted estimate. When the study reported the outcome with OR, the OR was converted to RR by using the formula proposed by Zhang et al. (1998)(Reference Zhang and Yu36). MedCalc Statistical Software 19.0.7 (MedCalc Software bvba) was used to compare the correlation coefficients between groups. When available, we obtained correlation coefficients (r) and standardised beta coefficients (β). To pool data, standardised betas were transformed to correlation coefficients using a simple imputation formula proposed by Peterson and Brown (2005)(Reference Peterson and Brown37). The pooled correlation coefficients were calculated after a Fisher r-to-z transformation (z), with a random effects model(Reference DerSimonian and Laird38). We conducted meta-analyses if comparable outcome data from two or more studies were available(Reference Valentine, Pigott and Rothstein39). A priori-determined subgroup analyses were conducted when possible for the following subgroups: (1) women with pre-pregnancy BMI ≥ 25·0 kg/m2 compared with women with pre-pregnancy BMI < 25·0 kg/m2; (2) amount of AS consumed; (3) type of AS; (4) geography and (5) quality of study. Because of the highly heterogenous group of available studies in terms of variable doses of AS consumption, prenatal AS consumption (≥1 serving/d) and no AS consumption were used as the primary comparisons in this paper based on the available data. According to the available studies, one serving of AS was equivalent to one cup (250 ml) or one can (355 ml) of an AS-added drink or to one packet of AS. If the results were presented for several periods of follow-up (e.g. at 1 year and 7 years). We selected a single time point and analyse only data at this time for studies in which it is presented(Reference Higgins and Green40). Significance was set at P < 0·05. Inverse-variance weighting was applied to obtain change scores using a random effects model. I 2 statistic was used to assess the heterogeneity between the studies. In the case of I 2 ≥ 50 %, heterogeneity was explored further with sensitivity analyses. Heterogeneity will be further explored by conducting meta-regression if more than ten studies were included(Reference Deeks, Higgins and Altman41).
If data were not suitable for meta-analysis, authors were contacted to obtain additional information. Data were synthesised narratively if authors were unable to provide additional numerical data.
Results
The literature search identified 677 unique citations with ten cohort studies and one randomised controlled trial(Reference Renault, Carlsen and Norgaard42) (n 138 007 women) from five countries (Canada, Norway, USA, Demark and UK). One of the included studies is a randomised controlled trial. However, the intervention includes a hypoenergetic Mediterranean type of diet and physical activity, thereby differing from our target intervention/exposure (AS). The data used in our review are obtained from secondary analysis of the associations between self-reported AS consumption and GWG. These data were collected and analysed with an observational aspect (regardless of the intervention). Hence, the quality of this study was evaluated according to the specifications for a cohort study. A PRISMA diagram of the search and study selection results is shown in Fig. 1.

Fig. 1 Study flow diagram
All studies assessed the intake of AS by FFQ. The definition of AS was reported as ‘artificially sweetened soft drink’, ‘artificially sweetened beverage’, ‘artificially sweetened carbonated soft drinks’ or ‘diet beverage’. The mean age of the included women ranged from 26 to 32 years, and their mean pre-pregnancy BMI ranged from 23 to 28 kg/m2. Most of these women were Caucasian, and more than half of the women had a post-secondary degree. Regarding health status, one study included only obese women, while the remaining studies included women of all BMI categories. The characteristics of the eligible studies are summarised in Supplemental Table 1. Excluded studies, with reasons for their exclusion, are presented in the Supplemental Documents. Corresponding authors were sent letters requesting additional information or clarification of data from five studies(Reference Englund-Ogge, Brantsaeter and Haugen5,Reference Maslova, Strom and Olsen6,Reference Petherick, Goran and Wright21,Reference Gillman, Rifas-Shiman and Fernandez-Barres43,Reference Zhu, Olsen and Mendola44) . One author responded and clarified the data; however, no additional information could be provided for the meta-analysis(Reference Gillman, Rifas-Shiman and Fernandez-Barres43) (see online supplementary material, Supplemental Documents for the detailed list).
Quality assessment and certainty assessment
Based on NIH quality assessment, six studies had good quality(Reference Englund-Ogge, Brantsaeter and Haugen5,Reference Maslova, Strom and Olsen6,Reference Halldorsson, Strom and Petersen20,Reference Gillman, Rifas-Shiman and Fernandez-Barres43,Reference Azad, Archibald and Tomczyk45,Reference Azad, Sharma and de Souza46) , three studies were of fair quality(Reference Petherick, Goran and Wright21,Reference Renault, Carlsen and Norgaard42,Reference Zhu, Olsen and Mendola44) and two had poor quality(Reference Renault, Carlsen and Norgaard42,Reference Plows, Morton-Jones and Bridge-Comer47) . The common sources of bias were information bias(Reference Petherick, Goran and Wright21,Reference Renault, Carlsen and Norgaard42,Reference Azad, Archibald and Tomczyk45,Reference Azad, Sharma and de Souza46) and selection bias(Reference Englund-Ogge, Brantsaeter and Haugen5,Reference Maslova, Strom and Olsen6,Reference Halldorsson, Strom and Petersen20,Reference Petherick, Goran and Wright21,Reference Renault, Carlsen and Norgaard42,Reference Renault, Carlsen and Norgaard42–Reference Zhu, Olsen and Mendola44,Reference Plows, Morton-Jones and Bridge-Comer47) , which included the exposure assessed only once over time and loss to follow-up (see online supplementary material, Supplemental Table 2). All the studies had a low risk of selection bias (the two groups were similar and were recruited from the same population; and long enough) and confounding bias (the adequacy of the confounding control).
All the included studies were observational studies, which began with a ‘low’ certainty assessment. No studies were upgraded, and the most common reasons for downgrading certainty of the evidence were (1) inconsistency and (2) imprecision. All the outcomes included <10 studies, and publication bias was not assessed. Overall, the certainty of evidence ranged from ‘low’ to ‘very low’ (see online supplementary material, Supplemental Table 3). This means that ‘Our confidence in the effect estimate is limited: The true effect may be substantially different from the estimate of the effect’ (‘low’) or ‘We have very little confidence in the effect estimate: The true effect is likely to be substantially different from the estimate of effect’ (‘very low’)(Reference Balshem, Helfand and Schunemann34).
Synthesis of data
Outcomes
Preterm delivery
Overall, there was ‘low’ certainty evidence from three observational studies (n 129 009) regarding the association between prenatal AS consumption (≥1 serving/d) and PTD. The pooled estimate demonstrated that prenatal AS consumption (≥1 serving/d) was associated with an 18 % increase in the risk of PTD compared with no AS consumption (unadjusted data, RR = 1·18, 95 % CI 1·09, 1·28, I 2 = 9 %; see Fig. 2). Adjusted data were not available separating ≥1 serving/d to no servings/d; all the three studies reported adjusted data on the following subgroup exposures: = 1 serving/d, 2–3 servings/d and ≥4 servings/d. A subgroup analysis was done to investigate the adjusted RR in these exposures (Fig. 3). The pooled estimate demonstrated that prenatal AS consumption (=1 serving/d) was associated with a 21 % increase in the risk of PTD compared with no AS consumption (RR = 1·21, 95 % CI 1·07, 1·37, I 2 = 0 %; see Fig. 3A), but no significant effect was observed from the other two exposures. The subgroup analyses showed no significant effect was observed from different geographical locations, nor from different study qualities (see Table 1, see online supplementary material, Supplemental Figure 1and 2).

Fig. 2 Effects of prenatal artificial sweetener consumption (≥1 serving/d) on risks of preterm delivery. M-H, Mantel–Haenszel method

Fig. 3 Effects of prenatal artificial sweetener consumption (A. = 1 serving/d; B. 2–3 servings/d; C. ≥4 servings/d) on risk of preterm delivery. IV, inverse-variance method
Table 1 Associations between prenatal artificial sweetener consumption (≥1 serving/d) and preterm delivery, gestational age and birth weight

Gestational age
There was ‘low’ certainty evidence from three studies (n 64 417) showing that prenatal AS consumption (≥1 serving/d) was associated with a decrease in gestational age compared with no AS consumption (mean difference(Reference Van Beukering, van Melick and Mol48) = –0·11 weeks; 95 % CI –0·19, –0·03, I 2 = 0 %; see Fig. 4). The subgroup analyses showed that no significant effect was observed from different geographical locations, nor from different study qualities (see Table 1, see online supplementary material, Supplemental Figure 3 and 4).

Fig. 4 Effects of prenatal artificial sweetener consumption (≥1 serving/d) on gestational age. IV, inverse-variance method
Birth weight
There was ‘low’ certainty evidence from three studies (n 64 417 women) showing that prenatal AS consumption (≥1 serving/d) was associated with an increase in birth weight compared with no AS consumption (mean difference = 23·74 g; 95 % CI 0·89, 46·58, I 2 = 0 %; see Fig. 5)(Reference Maslova, Strom and Olsen6,Reference Zhu, Olsen and Mendola44,Reference Azad, Sharma and de Souza46) . The subgroup analyses showed that no significant effect was observed from different geographical locations, nor from different study qualities (see Table 1, see online supplementary material, Supplemental Figure 5 and 6).
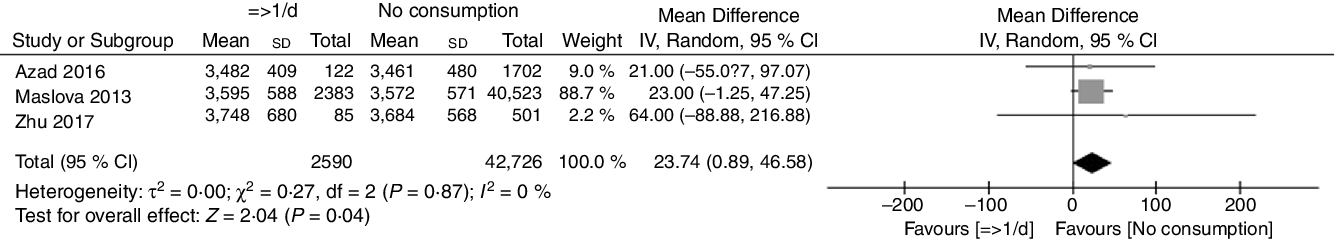
Fig. 5 Effects of prenatal artificial sweetener consumption (≥1 serving/d) on birth weight. IV, inverse-variance method
Secondary outcomes
The results of secondary outcomes are presented in Supplemental Documents. Briefly, women who ingested AS during pregnancy had an increased risk of excessive GWG (RR = 1·43, 95 % CI 1·10, 1·86; ‘very low’ certainty evidence; one study, 342 women)(Reference Renault, Carlsen and Norgaard42), having an LGA baby (RR = 1·57, 95 % CI 1·05, 2·35; ‘very low’ certainty evidence; one study, 918 women)(Reference Zhu, Olsen and Mendola44) and child with asthma (RR = 1·57, 95 % CI 1·05, 2·35; ‘very low’ certainty evidence; one study, 60 466 women)(Reference Maslova, Strom and Olsen6). The consumption was not associated with other child health outcomes, such as being overweight (see online supplementary material, Supplemental Figure 7) and BMI-z scores at the age of 1 year (see online supplementary material, Supplemental Figure 8).
Discussion
In this systematic review and meta-analysis of eleven cohort studies (n 138 007), there was ‘low’ certainty evidence demonstrating that daily consumption of AS (a mixture of AS types) was associated with a clinically meaningful (18 %) increase in the risk of preterm delivery. It is estimated that more than 1 in 10 of babies are born preterm, resulting in 15 million babies born too soon each year(Reference Liu, Oza and Hogan49). Eighteen percentage increase in the risk of preterm delivery by AS could bring additional 2·7 million preterm babies every year. Preterm delivery is associated with long-term neurodevelopment impairments and chronic health problems(Reference Raju, Pemberton and Saigal50,Reference O’Brien, Hinder and Callaghan51) . In addition to health effects, preterm delivery has financial impacts on the affected families and places additional costs on society in terms of healthcare and education(Reference Petrou, Yiu and Kwon52). Our data also provided ‘low’ certainty evidence of an overall increase in birth weight (+24 g) and decrease in gestational age (–0·11 week); however, this is unlikely to be clinically meaningful.
The results of the meta-analysis suggest daily consumption of AS during pregnancy increases the risk of preterm delivery by 18 % compared with an absence of AS consumption. There are several plausible explanations. First, most AS (such as saccharin and acesulfame-K) are not directly digested, which could cause the alteration of the gut microbiome. Animal studies demonstrated that prenatal AS consumption induces the alterations in gut microbiome composition(Reference Suez, Korem and Zeevi15,Reference Abou-Donia, El-Masry and Abdel-Rahman53) . The enrichment of bacterial genes involved in proinflammatory pathways preceded the development of glucose intolerance(Reference Plows, Morton-Jones and Bridge-Comer47,Reference Olivier-Van Stichelen, Rother and Hanover54) . The prenatal period is marked by dramatic microbiome shifts with unique inflammatory and immune changes(Reference Edwards, Cunningham and Dunlop55). When the maternal inflammatory state shifts from a physiologic to an excessive level due to excessive AS consumption, vascular dysfunction of the placental tissue can develop, leading to adverse effects such as preterm delivery. These data also suggested a small (24 g) increase in birth weight and 57 % increase in the risk of having an LGA baby. Studies in rodents have found that some AS (i.e. saccharin and acesulfame-K) can activate the sweet taste receptors type 1 (T1R) subunits 1 (T1R1) and 3 (T1R3) in the intestines, which could result in the up-regulation of the expression of glucose transporters, increase the intestinal absorption of glucose and trigger insulin secretion(Reference Mace, Affleck and Patel56–Reference Margolskee, Dyer and Kokrashvili59). Consistently, elevated maternal glucose levels due to daily AS consumption could lead to increased fetal growth(Reference Scholl, Sowers and Chen60). Finally, unlike nutritive sweetener, consumption of AS does not change the release of the satiety-related hormones (such as ghrelin, peptide YY and glucose-dependent insulinotropic peptide)(Reference Ma, Bellon and Wishart61–Reference Steinert, Frey and Topfer63), which may increase the food intake, leading to an increase in birth weight. Given the small number of studies reporting on LGA, the influence of AS on birth weight and excessive fetal growth warrants further investigation. Prenatal AS consumption appears to be a potential factor for increasing the risk of childhood allergy; however, reported data limited our ability to confirm.
The present meta-analysis is the first to quantitatively synthesise the overall effect of prenatal AS consumption on maternal and child health. Rigorous methodological standards (following GRADE guidelines) were used to assess the certainty of the evidence; we also examined grey literature and did not limit our search to a single language.
However, some considerations should be noted. First, we acknowledge the ethical constraints of randomised controlled trials; no randomised controlled trials were available regarding prenatal AS consumption. As a result, meta-analyses of observational data sometimes are necessary to address questions for which randomised evidence is insufficient or absent. Thus, the findings of the review relied on observational data which can suggest association but not causation. Nevertheless, the current analysis tries to eliminate this possibility by using adjusted data when available, to control for potential covariates is already considered in the model. Data taken from observational studies also increased the heterogeneity and reduced the certainty of evidence. In addition, all studies assessed AS consumption through self-reported measures, which increased the risk of recall bias. Additionally, we could not evaluate different types of AS due to a lack of reporting from the included studies. Finally, the paucity of eligible studies limited the ability to draw conclusions for certain several outcomes.
Future work should seek to improve the precision of the evidence. The existing evidence is based on North America and Europe. Populations from other high AS consumption regions, such as Australasia and Latin America(Reference Popkin and Hawkes64), should be further explored. Future studies investigating the effects of different types of AS are also warranted.
Conclusions
These data provide ‘low’ certainty evidence of a relationship between daily AS consumption during pregnancy and adverse outcomes, such as preterm delivery. Daily AS consumption during pregnancy may have important short- and long-term health implications in women and their children. However, more prospective studies with a longer follow-up period are urgently needed to draw conclusive recommendations about the harmful effect of AS on maternal and child health.
Acknowledgements
Acknowledgements: Not applicable. Financial support: M.H.D. is funded by a Heart & Stroke Foundation of Canada (HSFC)/Health Canada Improving Heart Health for Women Award, National and Alberta HSFC New Investigator Award, Christenson Professorship in Active Healthy Living, and Natural Sciences and Engineering Research Council of Canada (NSERC) Discovery Grant. Conflict of interest: The authors have no conflicts of interest to report. Authorship: C.C. designed the study, collected the data, performed the statistical analysis and wrote the manuscript. M.H.D. designed the study, collected the data, contributed to discussion and wrote the manuscript. A.S. participated in designing the study and acquisition of data. All authors read and approved the final manuscript. Ethics of human subject participation: No ethic needed.
Supplementary material
For supplementary material accompanying this paper visit https://doi.org/10.1017/S1368980021000173


